Intelligent Agents for Real Time Data Mining in Telecommunications Networks Luis E. Rocha-Mier1, Leonid Sheremetov2, and Ildar Batyrshin3 1
Department of Analytics, SAS Institute Paseo de la Reforma 505 Piso 38, Torre Mayor Col Cuauhtemoc C.P. 06500 Mexico DF, Mexico
[email protected] 2 St. Petersburg Institute for Informatics and Automation of the Russian Academy of Sciences, 39, 14th Line, St. Petersburg, 199178, Russia
[email protected] 3 Institute of Problems of Informatics, Academy of Sciences of Tatarstan, 20, Mushtari, Kazan, 420012, Russia
[email protected]
Abstract. Over the last years, the data generated in Telecommunications Networks has reached unmanageable limits of information. Data Mining (DM) techniques have showed their advantages on helping to manage this information and transforming it in useful knowledge. However, due to the dynamics of the environment of Telecommunications Networks, the simple application or adaptation of DM techniques is not enough to obtain timely a deeper knowledge. In this paper, this problem is addressed by applying DM techniques in real time. First, we propose a methodology taking into account all the processes involved in transforming telecommunications data into information, and finally to knowledge. Second, we propose a framework for the utilization of Intelligent Agents to help the process of DM in real time. To illustrate our approach, we describe a real-life case study based on the integration of Intelligent Agents and DM technologies for obtaining in real time knowledge that is critical for managing telecommunication networks. Keywords: Real-time Data Mining, Intelligent Agents, Telecommunications Networks.
1 Introduction Over the last years, the telecommunications industry has experienced an unthinkable growth. Nowadays, it generates and stores a tremendous amount of data [1]. These data are classified in three types: call detail data, network data and customer data. The massive generation of network-management data typically hides knowledge that is critical to some of the key tasks involved in effectively managing a communication network [2]. Data Mining (DM) is the exploration and analysis of large quantities of data in order to discover meaningful patterns and rules [3]. Different DM models have been successfully applied in the telecommunication industry to solve problems like: fraud detection, marketing/customer’ profiling, network fault isolation and forecasting telecommunication equipment failures [4], [5], [6], [7]. However, these works do not V. Gorodetsky et al. (Eds.): AIS-ADM 2007, LNAI 4476, pp. 138–152, 2007. © Springer-Verlag Berlin Heidelberg 2007
Intelligent Agents for Real Time Data Mining in Telecommunications Networks
139
take into account the eventual changes of Telecommunications Networks’ environment and the knowledge obtained from their DM models can become obsolete if they are not updated in a timely manner. In order to analyze the Telecommunications Networks data, these data must be transformed in time series. Recently, a variety of methods of Time Series Data Mining (TSDM) have been developed [8], [9], [10], [11]. The specific of problems in Telecommunications Networks is that it is impossible to analyze them by using only statistics. Moreover, if traditional DM techniques are applied at a considered time, a high risk exists that theses techniques could became obsolete in a future time as we above-mentioned. The Telecommunications Networks environment is dynamic and can change dramatically in a very short time. Therefore, traditional DM techniques based on static off-line training usually do not give satisfactory results predicting network behavior. Another disadvantage of traditional methods is the need of a experienced user to train the models and interpret their results. This work is an attempt to overcome these limitations of traditional approach using real-time DM [6] and Intelligent Agent (IA) technology [12]. The agents have proved their efficiency to solve problems in very complex and dynamic environments. An IA is able to sense the environment, process the data/information obtained from the environment, and act to execute the most appropriate actions that contribute to the improvement of his behavior: they are especially useful for highly dynamic environments as telecommunications networks [13]. That is why IA technology has been widely used as a framework for distributed DM and data fusion [14], [15]. The approach of this work is to automate the DM process of Telecommunications Networks data using cognitive and cooperative capabilities of IA and Web services (WS) encapsulating specific DM models throughout the DM process cycle. The contribution of this research work is twofold: i) we propose a theoretical framework decomposing the DM process of Telecommunications Networks data into several steps, and ii) we develop a hybrid multi-agent system supporting the DM process. Moreover, we describe a case study based on the integration of Intelligent Agents and DM technologies for mining Telecommunications Networks data. The rest of the paper is organized as follows. Section 2 describes the proposed theoretical framework. The perceptual and combined forecasting as well as the neural network model for prediction are described in more detail. In Section 3 the multiagent infrastructure supporting the proposed approach is described. In Section 4 we present our experimental results and their analysis. Finally, conclusions and future work are summarized.
2 Theoretical Framework The problem discussed in this paper consists in predicting a network variable (network utilization level in our case) based on the historical observations of the network data. The predictions are made on a daily basis with one-hour shifts. The proposed framework for real-time DM contains seven steps (see Fig. 1): 1. Collection of Telecommunication Network variables from distributed data sources (e.g. network data logs from network segment routers) and their integration in a Network Data Mart [16].
140
L.E. Rocha-Mier, L. Sheremetov, and I. Batyrshin
2. Preparation of the collected data and construction of time series. Sometimes the collected data must suffer some transformations (e.g. delete of repeated or duplicated data, normalization of time scales, etc.) to be used in the DM process. 3. Correlation analysis of the network variables to eliminate the redundant network variables. At this step, the network variables should be selected for further optimization of the Data Mining forecasting and predictive models. 4. Importance analysis of the most relevant network variables with respect to the target variable (the variable to be predicted). 5. Forecasting of the network variables to be used in the predictive/descriptive model. From the time series of each network variable, it is important to select the most appropriate forecasting method or combine forecasting methods. 6. Prediction/Description Modeling. At this step, the most appropriate model (e.g. Neural Networks, Decision Trees, Lineal Regression, etc.) is determined and applied to predict a characteristic network variable. 7. Evaluation of the DM process and interpretation of the results.
Fig. 1. Steps of the theoretical framework
The first four steps of the theoretical framework are the collection of data and the construction of time series data that contain several irredundant/relevant network variables that describe the environment state in a telecommunications network. A time series is a sequence of vectors, x(t), t = 0,1,..., where t represents an elapsed time. Theoretically, x may be a value, which varies continuously with t, such as the utilization of network links. In practice, for any given physical system, x will be sampled to give a series of discrete data points, equally spaced in time. Time series are generally sequences of measurements of one or more visible variables of an underlying dynamic system [17]. Examples of the variables used in the case study presented below include: Ethernet Traffic, Data Base Load, CPU utilization, and TCP transmissions.
Intelligent Agents for Real Time Data Mining in Telecommunications Networks
141
The time series from Telecommunications Networks usually have redundant and irrelevant variables that contain the same information and contribute in the same way to the target problem (prediction or description of an event). This represents a problem of selection of the important number of variables to take into account. In order to address this problem, some correlation technique to detect the redundant variables should be used. The Spearman correlation could be an alternative. This technique indicates that there is high correlation between two variables if the result is close to one and a low correlation if the result is close to zero. A threshold of 0.8 was chosen to detect the variables that were highly correlated. Once the redundant variables are eliminated at the Correlation analysis step, there are still irrelevant statistics that do not contribute to the target prediction. Besides, the large number of input variables can affect forecasting and prediction models. Once artificial neural networks (ANN) are used in the prediction model, they are affected in two ways. First, the more variables are used as inputs into the network, the larger the network needs to be, increasing the risk of overfitting and increasing the size of the training set. Second, the more variables are used, the longer it takes the network to converge to a set of weights. And, with too many variables, the weights are less likely to be optimal. This variable selection problem is a common difficulty for statisticians and decision trees provide a good method for choosing the best variables [3]. The predictive model has to be based on the irredundant/relevant network variables obtained at the previous step of the proposed framework. However, the values of each variable are not known at the moment of the prediction; it is where forecasting takes place [18], [19]. Although the next time points following the known ones are the output information we only want for forecasting, practically many of the existing forecasting algorithms usually supply or are able to supply some other related information supporting the forecasting. For example, a Bayes algorithm may also supply M values of post-probabilities for each possible time point. We can take advantage of this information in order to compare and/or combine the results of multiple classifiers. As an example, parallel perceptual forecasting is implemented within the framework. Forecasting model using Bayesian approach is constructed to combine the results. Finally, a predictive model based on a multilayer perceptron (MLP) neural network is used to predict the network utilization level. After the prediction of network events, the results must be interpreted and used to improve the performance of Telecommunication Networks (actionable knowledge). We describe forecasting and predictive models in more details below. 2.1 Perceptual Forecasting Both the stochastic nature of the TS and the need in real time forecasting make it feasible to approximate the original TS with piece-wise linear patterns. Recently, several algorithms for piece-wise linear representation of time series have been developed in TSDM. For example, the method of symbolic representation of time series called Symbolic Aggregate approximation SAX was proposed in [8], [10]. In this paper, a perceptual forecasting method is developed on the basis of the Moving Approximation (MAP) transform reported in [11]. The idea of the method consists in the following. We replace the time series values by slope values. The time pattern
142
L.E. Rocha-Mier, L. Sheremetov, and I. Batyrshin
before forecasting time moments is called a goal pattern. As a result, the goal pattern of time series values is replaced by a perceptual pattern of slope values describing a class of time series patterns with the shape of the goal pattern. In the history of time series, the method looks for the subsequence of slope values most similar to the perceptual image of the goal pattern. To apply this idea to the considered problem, first, all TS of measured variables should be pattern TS. Due to their stochastic nature of the TS (Fig. 2a), we both smooth and divide patterns using the beginning of the impulse and its average intensity as pattern descriptors, as shown in example from Fig. 2b. Next, we analyze the TS of patterns for each day to construct classes of signals. For each class we identify the forthcoming classes with the corresponding probability. Also, a corresponding average signal TS is constructed for each class.
a)
b) Fig. 2. Example of initial and pattern TS for the variable “Web Browsing.CPU Utilization”: a) original TS, b) pattern TS.
Intelligent Agents for Real Time Data Mining in Telecommunications Networks
143
As a distance between the TS of patterns shown in Fig. 2b the following measure was used:
d ( x, y ) =
m
2 2 ∑ α (t xi − t yi ) + β (q xi − q yi ) ,
i =1
(1)
where m is a number of patterns in a considered class of TS of patterns x and y, i is an index of the current pattern, t and q are time points and intensity of patterns respectively, α and β are normalizing parameters. The forecasted values are extracted from the most similar pattern following that of the goal. The location of the value following the found pattern is extended on the location of a forecasted value following the goal pattern. Then the slope value directly following this found subsequence is used for calculation of forecasted value following the goal pattern. We can forecast both the whole patterns following the goal one, or applying this method sequentially, forecast values in several sequential time points. 2.2 Combined Forecasting
Since each forecasting method exhibits strengths and shortcomings that are time series dependant, collaboration among heterogeneous methods is needed to bring forth their benefits, so that DM process can be brought to higher ground. In this paper this collaboration refers to the collaboration among several agents assigned to the classification of the patterns in the perceptual forecasting methods described above. Towards this end, each agent Ar is responsible for pattern identification and the results from multiple agents are combined. When multiple agents work in parallel, a conflict resolution strategy is needed to arbitrate among the contradictory decisions generated by them so that one consolidated solution can be generated. The problem of decision fusion for multiple agents has been considered in the literature, but most of the authors concentrated on the combined classification [14]. In this paper, we extend the model to combined forecasting based on a Bayesian approach [15], [20]. This approach differs considerably from that of collaborative forecasting [21]. Suppose we have Cj , j = [1,..., J ] class patterns identified during TS analysis. In general, the predictions from each forecasting agent Ar can be recorded in a confusion matrix (CM) as follows:
⎛ n r n r ... ⎜ 11 12 ⎜ r r r ⎜ n21 n22 ... CM = ⎜# # ⎜ r ⎜ nr ⎝ J 1 n J 2 ... where nijr ,
n1r( J +1) ⎞⎟ ⎟ n2r ( J +1) ⎟ , ⎟ # ⎟ r n J ( J +1) ⎟⎠
(2)
i = [1,..., J ] and j = [1,..., J + 1] indicates the number of samples
belonging to class Ci that have been assigned to class Cj by Agent Ar. The diagonal
144
L.E. Rocha-Mier, L. Sheremetov, and I. Batyrshin
elements of CMr are then the correct predictions from Ar. The confusion matrix is computed for each method during the offline training stage. The information in CMr is used in real-time as follows: the conditional probability that implies x∈ Ci given the evidence er(x)= j from agent Ar can be computed as [20]:
P( x ∈ Ci er ( x) = j ) =
nijr n•r j
=
nijr
∑i=1 nijr J
, i ∈ [1,..., J ] .
(3)
where P ( x ∈ Ci er ( x) = j ) can be considered the confidence of a classifier regarding the assignment of sample x to class Ci. Each agent r∈[1, R] has its own confusion matrix, CMr, and R evidences are produced in real-time. Each agent expresses its predictions supporting the proposition that x∈ Cj in the form of conditional probability. The combined probability PE that supports x∈ Ci from the collaboration among the agents can then be written as:
∏ P( x ∈ C A ( x) = j ) . A ( x) = j , r = 1,..., R) = ∑ ∏ P( x ∈ C A ( x) = j ) R
P ( x ∈ Ci
r =1
r
r
i
J
R
i =1
r =1
r
i
r
r
(4)
r
Based on (4), a sample x is classified into class j depending on the combined conditional probability. The class Ci with the highest PE can be selected as the optimal combined prediction. 2.3 Predictive Model Using MLP Neural Network
Once the values of the forecasting variables are obtained, they are used as inputs to the predictive model of the network utilization level variable (or other network event). The predictive model used in this step was chose by an Intelligent Agent thanks to its higher prediction ability with respect to other predictive models such as Decision Trees. The neural network architecture is a multilayer perceptron architecture (Fig. 3). In the case study presented in section 4, we used a multilayer perceptron architecture
Fig. 3. MLP architecture
Intelligent Agents for Real Time Data Mining in Telecommunications Networks
145
with seven inputs (independent variables), seven elements of the hidden layer and a network link utilization as an output variable (dependent variable). This architecture uses a linear combination function in the hidden and output layers and uses a sigmoid activation function in the hidden layer. After being normalized to [0,1], input signals at the j–th time instant from the input nodes are multiplied by proper weights wil, corresponding to connections between input neurons, from which the signal has been dispatched, and neurons in the hidden layer. In each of the m hidden nodes, the weighted sum of all the incoming signals and threshold values (w0l) is computed and then transformed by – in case of this study – the logistic function, giving the value of al dispatched by l-th neuron: g ⎡ ⎤ al = ⎢1 + exp(− w0l − ∑ wil xi ⎥ i =1 ⎣ ⎦
−1
(5)
Afterwards, the signals al, multiplied by proper weights vl, are transferred to the neuron of the third layer. In this final stage, the new weighted sum is computed m
y j +T = v0 + ∑ al vl
(6)
l =1
and after de-normalization of the output, the forecasted value yj+T is determined. Another prediction models such as Decision Tree or Linear Regression models can also be used at this stage as we above-mentioned. Once other techniques are implemented, the approach to combined prediction similar to that described in Section 2.2 can be applied.
3 Multi-agent Framework The theoretical framework from Fig. 1 can be represented as a business process scheme using components described in the previous section as shown in Fig. 4. Bayesian Classifier
. . .
. . .
Spearman Correlation/ Decision Tree
. . .
Pattern TS classificati on
. . .
Pattern TS Classificat ion Network Variables (191)
Time Series of Measured Variables (191)
Correlation and Importance analysis
Time Series of independent and relevant variables (7)
Combined Forecasting
Multilayer Perceptron (ANN)
Predicted network variable (network utilization)
Bayesian Classifier
Forecasted Time Series of independent and relevant variables (7)
Prediction
Fig. 4. Business process scheme of the telecommunication network data mining
146
L.E. Rocha-Mier, L. Sheremetov, and I. Batyrshin
In order to implement the scheme from Fig. 4, we developed a multi-agent framework. This framework uses the problem solving components both self-made and from the shelf implemented as Web and agent services along with the agents’ ability to encapsulate different decision making techniques. Agents were developed using CAPNET agent platform [22]. In order to enable the integration with Web services, the model of agent and Web service integration implemented within the CAPNET is used [23]. The business process model developed for the orchestration of the Web and agent services follows the DM process described above according to the implementation scheme shown in Fig. 5, where each of agents addresses a different aspect of the DMP. The collaboration among the agents makes the framework capable of providing multi-faceted automation for DMP of telecommunication data. Now we discuss the components of the framework in more details. The first step in the process is the network data collection from the subnets composing the particular network topology. Since the log files always contain huge amount of data (e.g. typical net log with the main parameters of a medium size subnet for one hour can measure several Gb), data collection agents are located in the monitoring nodes, extracting the set of network variables using business logic defined as extraction rules. These variables are summarized in Table 1 described in Section 4. CAPNET Expert System Shell component is used as inference engine.
Fig. 5. DM process implementation scheme
Once data filtering and cleaning is finished, data collection agents send the information to the Data Mart manager agent for data integration and storing in the Network Data Mart. Correlation and importance analysis methods are implemented as Web Services, their function is to eliminate redundant and irrelevant variables from the Network Data Mart. By now, only Spearman Correlation and Decision Tree methods are implemented for the discrimination of redundant and irrelevant variables
Intelligent Agents for Real Time Data Mining in Telecommunications Networks
147
respectively. Once more methods are implemented as components, the agent can decide the best method (service) to use. The next step is the forecasting of network variables. As described above, perceptual and ANN forecasting methods are implemented. They are invoked by the forecasting agents. In the case of perceptual forecasting, two agents are assigned to each TS collected on the daily basis, both using the method described in Section 2.1. One of them as a proximity measure uses the distance to the closest pattern of the cluster, while another one uses the distance to the average pattern of the cluster. They provide their forecasted patterns to the referee agent generating combined forecasting variables to use in each particular analysis as described in Section 2.2. As a result of the forecasting, the predicted time series for network parameters for the next time period are generated and stored in the Data Mart by the manager agent. At the final step of the process, these data are used for the prediction of the link utilization variable for the traffic prediction in network links by the MLP agent. This process is dynamic and iterative. It means that for each time period t+d, both training and evaluation are applied to the TS data for a time period preceding the predicted one. This way, each time the prediction is made using the most recent data taking into account the typical fluctuations of the network parameters during the day. Moreover, each time the best model is selected as a product of the negotiation among agents. This process is illustrated in the following section by the case study example. The only difference with the described process is that we use Opnet Modeler to generate log files instead of real network monitoring parameters.
4 Data Network Scenario Description and Experimental Results We decided to create a network scenario using Opnet Modeler. This tool was used to generate the statistics and values of the network data variables. However, the same network data variables can be obtained from network data logs by using Intelligent Agents. The sequences of measurements of these variables represent the times series based on Data Network statistics. Opnet let us generate the network traffic and several kinds of services and applications in order to create several network traffic load levels. 4.1 Case Study
We propose a partial network topology from a Mexican retail enterprise. This enterprise has several branches distributed around the country. In this scenario the information and services that gives the enterprise, are requested from a particularly branch, in this case Mexico City. Our network topology has four subnets. The network model is shown in Fig. 6, which has followed a hierarchical design where each of the branches is represented by a subnet. Opnet organizes the statistics in three groups: global, node and link statistics. The following statistics were chosen according to the objectives of this work (Table 1).
148
L.E. Rocha-Mier, L. Sheremetov, and I. Batyrshin Table 1. Network statistics
Global statistics Node statistics
Link statistics
Data Base, Email, Ftp, Ethernet and http Client DB, Client Email, Client Ftp, Client http, CPU, Ethernet Channel, Ethernet, LAN, Server DB, Server Email, Server Ftp, Server http, Server performance and Switch. Queuing delay, throughput and utilization.
Fig. 6. Network scenario
There are some variables that can define the network performance such as link utilization, workload of the servers, network delay, response time of the applications, etc. However, the utilization variable was defined as the target because we want to know timely when a network link is overloaded. There are two important properties to define in the simulation: duration and values per statistic. The duration of the simulation is limited to the number of events that can be used, and as the number of events is increased according to the traffic load in the network. We established duration of 500 minutes and 5000 values per statistic. 4.2 Simulation Results
Opnet lets to export the statistic data of the simulation. These statistics represent the measurements of the variables that are the components of the times series based on Data Network statistics. According to the statistics selected and the number of devices used in the network we got 191 statistics, each of them representing a network variable. These time series are preprocessed like explained in Section 2. At the first stage, we got 22 irredundant network variables (see Table 1) as a result of the correlation analysis of the 191 variables that integrated the TS. Further on, seven variables were selected for predicting the link utilization variable (Fig. 4). The 80 % of the data was used to train the model and the 20 % for its validation. Such random partitioning is not appropriate for TS data since the order of the samples cannot be changed. In order to preserve the chronological order of the samples in the training and validation, we do the partitioning in the SAS BASE code node.
Intelligent Agents for Real Time Data Mining in Telecommunications Networks
149
The input variables of the VAR component are the logarithms of the original variables. The relation among the variables is not always linear, so the inputs should be standardized for correct operation of the model. To train the VAR model the inputs are the lagged values of the targets, so if we want to forecast the input variable values at the time t, the input values have to be its logarithm in the time t-1. The results of the forecasting comparing different models are shown in Table 2 for two simulation runs with different generated statistics. We show the average forecasting results for all seven variables. As it can be seen, the Bayesian combined forecasting obtained slightly better results then the VAR model. Table 2. Performance evaluation of each forecasting agent
Forecasting agent
VAR forecasting model Distance to the closest pattern of the cluster Distance to the average pattern of the cluster Bayesian Combination
Simulation run 1 81.34 79.15
Recognition rate Simulation run 2 83.56 75.16
Average 82.45 77.155
82.26
80.01
81.135
84.13
82.78
83.455
4.3 Predictive Model Results
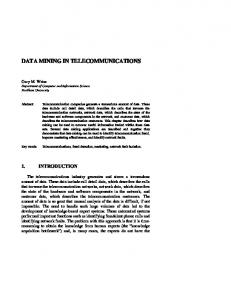
In Fig. 7, we show a comparison of the link network utilization level obtained in the first simulation run and the prediction link network utilization of the ANN model. Besides, we can notice that the neural network model is well suited to anticipate high utilization in order to avoid important network failures. 110
Simulation Prediction model
100
% Utilization
90 80 70 60 50 40 27000
27500
28000
28500
29000
29500
30000
Validation time (seconds)
Fig. 7. Prediction of the Utilization level of the network link
150
L.E. Rocha-Mier, L. Sheremetov, and I. Batyrshin
For the implementation of the prototype the following tools were used: • • • • • • •
MS .Net Framework 1.1. MS SQL Server 2000. MS IIS Web server used as WS container for CAPNET. CAPNET Agent Platform with CAPNET Expert System Shell as the inference component for Data Mart composition agent. PerceptMiner Perceptual Forecasting Component. SAS export components for VAR forecasting and MLP prediction models. OPNET Modeler.
5 Conclusions In this research work, we presented a theoretical framework showing the importance of the use of Intelligent Agents to analyze the big amount of data available in Telecommunications Networks in real time. This with the aim of obtaining knowledge and intelligence needed to attend network management tasks such as the traffic prediction in network links. Bayesian approach used to combine different forecasting methods takes advantage of collaboration among agents. Through this, the strengths of the different methods can be integrated while the drawbacks of the individual methods diminished through collaboration. The decomposition of the DMP of Telecommunications Networks data along with the multi-agent implementation framework permit applying the DM techniques in real time taking advantage of online data extraction, automatic learning and higher degree of parallelism. Another key benefit of the multi-agent framework is that it enables efficient computational integration of complex components. The work is in progress; the first prototype version with a limited number of competing models has been developed so far and is reported in this paper. Though we use in the paper Opnet Modeler for simulation of the network parameters, multi-agent infrastructure is transparent for using data collection agents directly in the subnets in real-life scenarios. At this moment, we are working on more complex network scenarios and the implementation of rules extraction algorithms to facilitate the explanation of rules generated from the neural networks models. Another direction of current efforts is the implementation of another forecasting/prediction methods. Finally, the DM process workflow using Agent services and Web services integration capabilities of the CAPNET agent platform is under development. Acknowledgments. Partial support for this research work has been provided by the SAS Institute.
References 1. Weiss, G. M.: Predicting Telecommunication Equipment Failures from Sequences of Network Alarms. In W. Kloesgen and J.Zytkow (eds.): Handbook of Knowledge Discovery and Data Mining, Oxford University Press (2001) 891–896
Intelligent Agents for Real Time Data Mining in Telecommunications Networks
151
2. Garofalakis, M. and Rastogi, R.: Data Mining Meets Network Management: The NEMESIS Project. In ACM SIGMOD Int'l Workshop on Research Issues in Data Mining and Knowledge Discovery, May (2001) 3. Berry, M. and Linoff, G.S.: Data Mining Techniques, Second edition, Wiley (2004). 4. Weiss, G. M.: Data Mining in Telecommunications. In O. Maimon and L. Rokach (eds.): Data Mining and Knowledge Discovery Handbook: A Complete Guide for Practitioners and Researchers, Kluwer Academic Publishers, (2005) 1189–1201 5. Lee, W., Stolfo, S., Chan, P., Eskin, E., Fan, W., Miller, M., Hershkop, Sh. and Zhang, J.: Real Time Data Mining-based Intrusion Detection, The 2001 DARPA Information Survivability Conference and Exposition (DISCEX II), Anaheim, CA, June (2001) 6. Hatonen, K., Klemettinen, M., Mannila, H., Ronkainen, P. and Toivonen, H.: Knowledge discovery from telecommunication network alarm databases. In Proc. of the 12th Int. Conf. on Data Engineering, New Orleans, Louisiana, IEEE Computer Society (1996) 115–122 7. Klemettinen, M.: A Knowledge Discovery Methodology for Telecommunication Network Alarm Databases, PhD thesis, University of Helsinki, Finland (1999) 8. Lin, J., Keogh, E., Lonardi, S., Chiu, B.: A symbolic representation of time series, with implications for streaming algorithms. In Proc. of the 8th ACM SIGMOD Workshop on Research Issues in Data Mining and Knowledge Discovery. San Diego, CA. June (2003) 9. Last, M., Klein, Y. and Kandel, A.: Knowledge discovery in time series databases, IEEE Trans. SMC, Part B, 31(1) 160–169 (2001) 10. Keogh, E. Lin J. and Fu A.: HOT SAX: Efficiently Finding the Most Unusual Time Series Subsequence. In Proc. of the 5th IEEE International Conference on Data Mining (ICDM 2005), Houston, Texas, Nov 27-30 (2005) 226–233 11. Batyrshin, I. and Sheremetov, L.: Perception based time series data mining with MAP transform. In Advances in Artificial Intelligence, Lecture Notes in Artificial Intelligence, Vol. 3789. Springer Verlag (2005) 514–523 12. Weiss, G.: Multiagent Systems: A Modern Approach to Distributed Artificial Intelligence. The MIT Press (2000) 13. Rocha-Mier L.E., Amy B. and Pellegrini, C.: Neural Networks for learning in a Collective Intelligence: Internet packet routing application, The 3rd Int. Conf. on Cognitive Science, Beijing, China, August (2001) 14. Gorodetsky, V., Karsaev, O., Kotenko, I. and Samoilov V.: Multi-Agent Information Fusion: Methodology, Architecture and Software Tool for Learning of Object and Situation Assessment. Proc. of the 7-th International Conference Fusion-04, Stockholm, Sweden, June 28-July 2 (2004) 346–353 15. Ng Y. S. and Srinivasan R.: Multi-agent Framework for Fault Detection & Diagnosis in Transient Operations. In V. Plesu and P.S. Agachi (eds.): Proc. of the 17th European Symposium on Computer Aided Process Engineering, Bucharest, Romania, 27-30 May, Elsevier B.V. (2007) 16. Samtani, S., Mohania, M., Kumar V. and Kambayashi Y.: Recent Advances and Research Problems in Data Warehousing. Lecture Notes in Computer Science, Vol. 1552. Springer Verlag (2004) 81–92 17. Frank, R.J., Davey N. and Hunt, S.P.: Time Series Prediction and Neural Networks. J. of Intelligent and Robotic Systems, Springer Verlag, 31(1-3), May (2001) 91–103 18. Han J. and Kamber, M.: Data Mining: Concepts and Techniques, Morgan Kaufmann Publishers (2000) 19. Sims, C.A.: Macroeconomics and Reality, Econometrica, Vol. 48 (1980)
152
L.E. Rocha-Mier, L. Sheremetov, and I. Batyrshin
20. Xu, L., Krzyzak, A., Suen, C.Y.: Methods of combining multiple classifiers and their applications to handwriting recognition, IEEE Transactions on Systems, Man, and Cybernatics 22(3): 418–435 (1992) 21. Hassan, U. and Soh, B.: Using adaptive web service multi agents for collaborative forecasting and countering bullwhip effect in SCM. In Proc. of the Int. Conf. Integration of Knowledge Intensive Multi-Agent Systems, April 18-21 (2005) 567–572 22. Contreras, M., Germán, E., Chi M. and Sheremetov, L.: Design and implementation of a FIPA compliant Agent Platform in .NET. J. of Object Technology, ETH Zurich, 3(3), March-April (2004) 23. Sheremetov, L. and Contreras, M.: Industrial Application Integration Using AgentEnabled SSOA: CAPNET Case Study. In: W. Shen (ed.): Information Technologies for Balanced Manufacturing Systems, IFIP Series, Springer Verlag (2006) 109–118