Poster: Interactive Coverage Effectiveness Multiplots for Evaluating Prioritized Regression Test Suites Adam M. Smith†
∗
† Department
Joshua J. Geiger†
of Computer Science University of Pittsburgh
Gregory M. Kapfhammer‡ ‡ Department
of Computer Science Allegheny College
Manos Renieris◦
G. Elisabeta Marai†
◦ Google
Covered Test Reqs
C(T ,l)
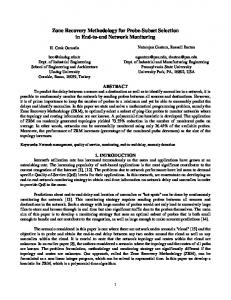
r1 r2 r3 r4 r5 Execution Time A BSTRACT t X X X X 4 1 Software testing increases confidence in the correctness of an apt2 X X 1 plication’s source code. Altering a test suite’s execution order ent X 1 3 ables earlier detection of defects and allows developers to fix errors t4 X X 2 sooner. The many existing prioritization methods produce different possible test suite orders from which to choose. We propose, Table 1: Example of a Test Suite. Test orderings cover the requireimplement in a free and open source system, and informally evalments at different rates, leading to variations in fault detection. uate Interactive Coverage Effectiveness Multiplots, an interactive PSfrag replacements visualization technique that allows software testers to quickly filter, Sn−1 Cover R(t1 )Cover i=1 R(ti ) appraise and compare the effectiveness of many test suite orders. Preliminary results show that researchers, students, and practitionCover R(T ) ers in the field of software testing find the system useful. tn Done 1 I NTRODUCTION ... Z time(T ) Developers may introduce errors while implementing software systems. In an attempt to isolate defects and gain confidence in the C(T, l) Area = 0 correctness of a program, developers often run a test suite T = ht1 , t2 , t3 , . . . , tn i. If a test fails, then it is likely that a defect is Testing Time (l) present in the source code executed by the test. As the program tn−1 Done t1 Done grows in size and number of features, engineers write new tests. In an effort to ensure that the new features do not negatively impact Figure 1: Calculating Coverage Effectiveness (CE). The CE score is correctness, developers perform regression testing by re-running a the area under C(T, l) divided by the area under the ideal test suite suite containing both the existing and newly added tests. function (represented by a dashed line). R(ti ) denotes the set of The inclusion of new tests gradually increases the size of the test requirements covered by a test case ti . suite until its execution time may become prohibitively expensive. Test suite prioritization methods create an order of the tests that is more likely to locate defects earlier in the test execution process orders [7]. Yet, it is challenging for testers to pick the best priori[6, 7]. Table 1 shows an example of a test suite with 4 tests and 5 tizer for a given test suite and set of requirements since these methrequirements where a checkmark in a cell (ti , rj ) means that test ti ods have many configurations (e.g., greedy choice metrics pick the covers the requirement rj . If we execute the test suite in the order next test according to either test cost, coverage, or the cost to covT = ht1 , t2 , t3 , t4 i, then it does not cover all of the requirements erage ratio). Testers often become overwhelmed when they solely until 8 time units have passed. Yet, if the test suite runs in the rerely upon static cumulative coverage multiplots and/or large tables verse order, T = ht4 , t3 , t2 , t1 i, it covers all of the requirements in of CE scores and test orders. Since the existing approaches to vi4 time units. Test orders that cover all of the requirements sooner sualization assist during different development processes [2, 3, 5], often support earlier fault detection, and are thus of particular interwe introduce an interactive visualization system that aids testers in est to software developers. evaluating and selecting a prioritized regression test suite. Normally leveraging static visualizations and tables of numerical scores, testers use metrics like coverage effectiveness (CE) to rate a 2 V ISUALIZATION AND I NTERACTION test suite based on how fast it covers each requirement rj [4]. The Figure 3 shows a screenshot of the visualization interface that uses cumulative coverage step function, denoted C(T, l), allows testers interactive CE multiplots to help testers to evaluate different orders to determine how many requirements T covers after l time units of a test suite. Drawing inspiration from features demonstrated by (Figures 1 and 2). The CE score is the area under C(T, l) divided Becker et al. [1] and a NY Times interactive visualization of marby the area under the ideal test suite function shown by a dashed ket statistics1 , our tool allows users to interactively pick prioritizers line in Figure 1 (i.e., an ideal suite immediately covers all requireand compare the CE values and the actual order of the resulting ments). Falling exclusively between 0 and 1, the “higher is better” test suites. The visualization provides details on demand, thus obCE metric enables testers to compare different orders of T . viating the need for large and confusing legends and data tables. Since finding the optimal test suite by generating and evaluatIn an effort to both (i) encourage empirical study on the use of viing all n! possible orders is too expensive, multiple prioritization sualization during test suite prioritization and (ii) enable software schemes have been proposed for efficiently constructing new test testing practitioners to quickly find the best test suite order for their ∗ e-mail:
[email protected] own applications, we have made the free and open source Reduce And prIoritize SuitEs (RAISE) system available for download at http://raise.googlecode.com/. 1 http://www.nytimes.com/interactive/2008/10/11/business/20081011 BEARMARKETS.html
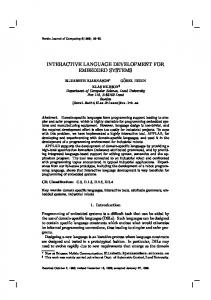
Figure 3: Interactive Coverage Effectiveness Multiplot in RAISE. Visualization using interactive multiplots and details-on-demand allows the user to quickly filter, evaluate and compare prioritized test suites. Figure 2: Static Coverage Effectiveness Multiplot. Multiple lines severely clutter the visualization, making evaluation and comparison of the prioritized test suites nearly impossible.
The visualization interface uses two panels (Figure 3). The left panel provides information about the test suite and lets the user select which prioritizer’s results will be displayed in the multiplot. Clicking on a toggle button in the cell table enables or disables the display of information about the test suite order resulting from the use of a specific greedy choice metric (organized horizontally) and prioritization method (shown vertically). To support rapid identification of details about the test order, each toggle button in the cell table is color coded to match its cumulative coverage step function in the multiplot. Below the table, the system contains a slider bar that allows a tester to choose a number of random prioritizations that appear as thin gray lines in the multiplot. The region below the slider bar gives the average CE value and standard deviation of CE scores for the current random sample. The user interface accesses CE values from all of the previously generated test suites in order to give the running average and standard deviation. The right panel provides a multiplot of cumulative coverage step functions for all of the currently chosen methods. As in Figures 1 and 2, the multiplot uses the vertical axis to display the number of covered requirements and the horizontal axis to show the test suite execution time. Since all of the toggle buttons in the left panel matrix are currently filled in Figure 3, the multiplot contains coverage functions for all greedy choice metrics and prioritization techniques. Since a multiplot of too many functions severely clutters the visualization, RAISE highlights a line and shades the area under it when a user performs a mouse-over on a function curve. Mouseover events also reveal the chosen prioritization method, greedy choice metric, and final coverage effectiveness score. 3
E VALUATION
We conducted two informal studies to gather preliminary evidence about the benefits and drawbacks associated with the use of interactive visualization during regression testing. In the first study, a senior researcher in regression testing was asked to use the tool and answer a series of questions. The researcher correctly answered questions such as “How does the use of different greedy choice metrics impact the CE score of orderings produced by the four prioritizers?” Feedback gathered during this study included: “It was challenging for me to analyze the raw data set and the large collection of static plots. RAISE helped me to quickly
identify the prioritizer that produced the test suite with the highest CE score. I think that my students and industrial colleagues would benefit from applying this tool to their test suites.”
During the second study, we asked two master’s level students doing research in software testing to independently download, install, and use RAISE. After learning how to use the interactive visualization, the students abandoned their static graphs and data tables and used RAISE until the completion of their master’s thesis. The students often employed the interactive visualization to determine the best configuration of new regression testing methods for programs that process eXtensible Markup Language (XML) files. 4 C ONCLUSION AND F UTURE W ORK This paper presents an interactive visualization that assists software developers during the evaluation of a prioritized regression test suite. We proposed, implemented in a system, and informally evaluated Interactive Coverage Effectiveness Multiplots, a visualization technique that allows software developers to quickly filter, appraise and compare prioritized test suites. Available as a free and open source tool, the system supports the activities of researchers, students, and practitioners in the field of software testing. Encouraged by the anecdotal evidence demonstrating that users find RAISE to be helpful, we intend to add new features and conduct more experimental studies (e.g., integrating and studying the use of test metrics besides CE). Ultimately, we anticipate that RAISE will serve as a simple and valuable tool in a comprehensive framework supporting all of the phases in the regression testing process. R EFERENCES [1] R. A. Becker, S. G. Eick, and A. R. Wilks. Visualizing Network Data. IEEE Trans. on Visual. and Comput. Graph., 1:16–28, 1995. [2] J. A. Cottam, J. Hursey, and A. Lumsdaine. Representing unit test data for large scale software development. In Proc. of 4th SoftVis, 2008. [3] J. A. Jones, M. J. Harrold, and J. Stasko. Visualization of test information to assist fault localization. In Proc. of 24th ICSE, 2002. [4] G. M. Kapfhammer and M. L. Soffa. Using coverage effectiveness to evaluate test suite prioritizations. In Proc. of WEASELTech, 2007. [5] S. Mukherjea and J. T. Stasko. Toward visual debugging: integrating algorithm animation capabilities within a source-level debugger. ACM Trans. Comput.-Hum. Interact., 1(3), 1994. [6] G. Rothermel, R. H. Untch, C. Chu, and M. J. Harrold. Prioritizing test cases for regression testing. IEEE Trans. on Soft. Engin., 27(10):929– 948, 2001. [7] A. M. Smith and G. M. Kapfhammer. An empirical study of incorporating cost into test suite reduction and prioritization. In Proc. of 24th SAC, 2009.