J. ADV. SIMULAT. SCI. ENG. Vol. 2, No. 1, 96-107.
© 2015 Japan Society for Simulation Technology
Interactive segmentation and visualization system for medical images on mobile devices Titinunt Kitrungrotsakul, Chunhua Dong, Tomoko Tateyama, Xian-Hua Han, Yen-Wei Chen Graduate School of Information Science and Engineering, Ritsumeikan University, Shiga, Japan
[email protected] Received: October 6, 2014; Accepted: February 21, 2015; Published: May 31, 2015
Abstract. Ubiquitous computing is an important technology in medicine that is predicted to support doctors anywhere and anytime. To help achieve it, this paper develops the Interactive Segmentation and Visualization System for Medical images on Mobile devices (ISVS_M2), which originally was designed to work on workstations, but also works on a wide range of mobile devices via a mobile client-server platform. The developed ISVS_M2 basically consists of three modules: asegmentation module that is implemented on a server; commutation modules on both the server and mobile device; and interactive and visualization modules on the mobile device that not only give visualization of internal information of an organ model, but also interactively refine organ segmentation according to user experience. With interaction via a computer graphic interface on the mobile device, and communication via the mobile client-server platform, ISVS_M2 offers users a novel and efficient approach to computer-aided medicine. Keywords: segmentation, visualization system, mobile visualization
1. Introduction Medical segmentation and visualization are two important tasks in computer-aided medicine. In these research fields, two sources of medical data are commonly used: Computed tomography (CT) and magnetic resonance imaging (MRI). Due to the fact that both sources of data are limited to displaying only 2D slice images of the human body, this causes difficulty in computer-aided medicine. An alternative, 3D medical visualization, which can effectively present anatomical information onthe human body, has been extensively developed and is preferable due to its accuracy incomputer-aided medicine. In this paper, we address two major challenges in constructing a system for medical im-
96
Journal of Advanced Simulation in Science and Engineering age segmentation and visualization tasks: 1) a ubiquitous approach for both tasks, and 2) a graph cutsbased iterative approach for user experience enhancement. With respect to the first challenge, to the best of our knowledge, two systems have been successfully developed and applied. One, ITK-SNAP, is a medical software application that combined manual segmentation, semiautomatic segmentation, and visualization [1]. The other, PLUTO, isa software platform for the analysis and visualization of medical images that integratedseveral medical image processing methods such as the segmentation method, the organ modeling method, and the lesion detection method into one system for a multi-disease CAD system [2]. However, both systems functioned only on workstations, and therefore they were inaccessible outside the work environment. The prospect of providingmedical image segmentation on mobile devices is a challenge. Traditional segmentation methods for medical segmentationsuch as Graph Cuts require at least 6 GB memory to perform segmentation, and as a result it is not feasible for segmentation to be performed on mobile computational resources. As meeting this challenge would prove beneficial to medical doctors and domain expertsin performing computer-aided medicine anywhere and anytime, our aim is to design and develop a segmentation and visualization system that enhances user experience and worksnot only on workstations, but also on mobile devices. For the second challenge, we plan to utilize mobility features, e.g., using pinch and zoom, to make the system user friendly. We also provide several interactive controls on mobile devices so that users can use the proposed system in a more manageable way. Essentially, our contributions are briefly given as follows: design and develop the system that can perform interactive medical image segmentation and 3D visualization on mobile devices. To accomplish that, it provides users essential functions/controls used on mobile devices such as viewing image slices, zooming in-out, rotating, adjusting contrast, changing surface color and opacity. Moreover, it is capable of updating 3D image result every time when operating Graph Cuts segmentation (in case that the option is set). Since the system is developed in mobile devices, medical doctors, domain experts or medical students can use their mobile devices like smartphones ubiquitously to support medical education and medical analysis. The remainder of this paper is organized as follows. In Section 2, we present our system design and implementation to give an overview of our system. In Section 3, we show the segmentation of our system on a workstation. In Section 4, we show interaction and visualization on a mobile device. In Section 5, we explain data communication in ISVS_M2. Finally, in Section 6, we provide conclusions on our proposed system.
2. System overview Interactive Segmentation and Visualization System for Medical images on Mobile devices (ISVS_M2) is a visualization and segmentation system for medical images that operates re-
97
Journal of Advanced Simulation in Science and Engineering
Figure 1: Architecture of Interactive Segmenation and Visualization system for Medical images on mobile device (ISVS_M2) motely frommobile devices. The two main features that differentiate it from existing systems [1, 2] are ubiquitous access and user experience enhancement. Image segmentation on mobile devices is a challenging task, and a direct approach to performing the task on a smartphone is not feasible due to the limitation of hardware specifications, i.e., the Graph Cuts method requires at least 6 GB of memory. To address this challenge, the design of ISVS_M2 is based on mobile client/server platforms so that most of the image-processing tasks such as segmentation and the preparation of visualization information are conducted on servers, while mobile clients such as smartphones or tablets (as well as workstations) are used as visualization tools and controllers that operate ubiquitously. To enable mobile clients and servers to seamlessly operate in image segmentation, ISVS_M2 includes a data communication and transmission module via TCP and UDP; and the mobile clients are able to send commands and constraints that are further processed on the server. After finishing the segmentation, the results are transmitted back to mobile clients. Figure 1 shows the architecture of ISVS_M2. The server in ISVS_M2 consists of three main modules: database, segmentation, and data communication. Generally, the ISVS_M2 process begins when a user sets up and sends constraints remotely from a mobile deviceso thatthe server constructs a model from CT imageswith respect to the given parameters. Then, the server operates on image segmentation, and finally, it transmits the result back to be visualized on the mobile device (workstations can also be used). In addition to traditional clients such as workstations, support for mobile devices is integrated in ISVS_M2 to offer users ubiquitous access to the system. The rationale here is to serve the needs of medical doctors/students as well as patients during medical analysis, diagnosis, and/or treatment. Mobile devices play an important role in visualizing segmentation results, providing a management tool, e.g., a 3D slicer, for the visualization and parameter setting of segmentation so that users can interactively operate the results retrieved from the
98
Journal of Advanced Simulation in Science and Engineering server. In this study, we develop mobile clients onthe iOS platform that consists of two main modules: data communication, and interaction and visualization. It is noteworthy that due to limitations on computational resources, i.e., speed and memory, all complex and time-consuming processing is performed on the server and the resultsare sent to mobile devices for visualization purposes.
3. Segmentation module In the construction of the model, we use interactive segmentation to perform initial segmentation and refine the segmentation results. Segmented organs from this part are visualized in the visualization part, and we provide operations to control and visualize the results. To construct a model in ISVS_M2, we use interactive segmentation as a tool to segment organs from CT volume data. Interactive segmentation is a technique that enables users to perform segmentation several times until they get a satisfactoryresult.
3.1. Graph Cuts In ISVS_M2, the Graph Cuts method is used as the segmentation method for initial segmentation and also in refining segmentation. Graph Cuts is an efficient interactive segmentation method proposed by Boykov [3]. Graph Cuts offers interactive segmentation using a ̅, E ̅ >, where V ̅ and ̅ graph-based method that represents the image as graph G =< V E correspond to nodes p ∈ P of an image and edges. The nodes and edges are pixels, and their relationship, which is typically a 4 or 8 connected neighborhood. There are two special nodes called terminals: an "object" terminal (source S) and a "background" terminal (sink T). There ̅: n-links (neighborhood links) and t-links (terminal links). Each node has are two types of E two t-links {p, T} and {p, S} connecting it to each terminal. Each pair of neighboring nodes {p, q} in N is connected by an n-link. To perform segmentation, we assume that 𝒪 (object) and ℬ (background) denote a pixel subset. 𝒪 and ℬ are known as seed objects and use a minimum cut, or min-cut, algorithm to divide the graph into two parts: the foreground and the background (Fig. 2). In ISVS_M2, we extended the conventional Graph Cuts to 3D image segmentation, in which each voxel is used as a node. We need to give seed points to only one slice image, and then the 3D volume of an organ will be automaticallysegmented based on the given seed points [7]. Although Graph Cuts can provide more accurate segmentation than conventional segmentation methods, it is not possible to obtain perfect segmentation. To refine the segmentation result, we propose a Graph Cuts-based iterative segmentation approach to enhance the user's experience. The user can add object seed points on under-segmentation regions, and background seed points on over-segmentation regions, and then run Graph Cuts again. The user may repeat the process until satisfied with the result.
99
Journal of Advanced Simulation in Science and Engineering
(a)
(b)
Figure 2: Initial liver segmentation using Graph Cuts, (a) the set seed points via the interaction screen. Blue curve: seed points of background; red curve: seed points of object (liver), (b) the initial segmentation results of two slices using Graph Cuts, pink color is the over segmentation region that needs to be removed in refined segmentation.
(a)
(b)
Figure 3: Segmentation refinement, (a) the re-set background seed points (blue curve) on the over segmentation region, b) the refined segmentation results using Graph Cuts that removed over segmentation region from initial segmentation (shown in Fig. 2). As the Graph Cuts method requires at least 6 GB of memory, the segmentation process is conducted on a server that hasadequate memory, and the seed constraints are remotely set from mobile devices.
3.2. Segmentation results To evaluate the performance of our proposed iterative segmentation method, we applied our method to segment both a liver and a spleen from CT volumes. An example of the liver segmentation is shown in Fig. 2. As shown in the figure, the Graph Cut method on medical data is not accurate on the first iteration. The pink region is the over-segmentation region, which can be deleted or removed by adding new background seed points in the second iteration as shown in Fig. 3. The setting of seed points is based on the user's experience. By using our iterative approach, the user’s experience can be significantly enhanced to refine the segmentation results.
100
Journal of Advanced Simulation in Science and Engineering
Jaccard index
100% 90% 80% 70%
Spleen
60%
Liver
50% 1
2
3
4
Iteration
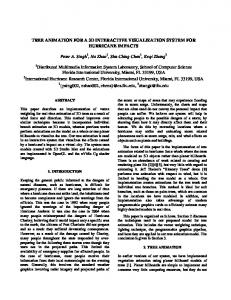
Figure4: Segmentation accuracy (Jaccard index) of Graph Cuts on CT volumes. To make a quantitative evaluation, we use a Jaccard index [4], which is defined in Eq. (1), as a measure of segmentation accuracy. This index measures the similarity between finite sample sets, and is defined as the size of the intersection divided by the size of the union of the sample sets. Figure 4 shows the performance of the Graph Cuts method. It can be seen that segmentation accuracy can be significantly improved by iterations (enhancement of user’s experience) and the average segmentation accuracy is around 90% for both liver and spleen. Our experiments showed that liver segmentation requires three iterations and that spleen segmentation requires two iterations. 𝐽(𝐴, 𝐵) =
|𝐴 ∩ 𝐵| |𝐴 ∪ 𝐵|
(1)
where A is the manual segmentation result and B is the segmentation result from Graph Cuts.
4. Interaction & visualization modulefor mobile devices To date Ubiquitous computing is an important technology in medicine that is prospected to support doctor anywhere and anytime. Mobile device can make more efficient for doctor to access the medical data than workstation or PC. However, the size of screen the main difference between PC and mobile device to visualize the medical data. To support doctors, in this section we divided visualization on mobile device into three types: visualization of DICOM data, visualization of segmentation results, and fusion of DICOM data and segmentation results.
4.1. Visualization of DICOM data 3D planes or oblique planesarea visualization technique that represents DICOM data in different 2D coordinates: the sagittal plane, the coronal plane, and the axial plane. An oblique
101
Journal of Advanced Simulation in Science and Engineering
(a)
(b)
(c)
Figure5: Visualization of raw CT data (DICOM) on mobile device, (a) the original data of oblique slicer, (b) the contrast adjustment and (c) the seed point interaction. slicer enables a user to observe an overview of the human body from DICOM data. In this visualization, we provide an interactive function by which the user can set the seed point constraints for Graph Cuts. Users can manipulate data and set the Graph Cuts constraints on mobile devices. Examples are shown in Fig. 5. Figure5 (a) shows the original data of an oblique slicer on a mobile device; Fig. 5(b) shows the result aftercontrast adjustment; Fig. 5(c) shows the seed point setting. In addition, we provide basic functionality to manipulate data such as the following: slice index changing by tapping on the plane and moving to change the index; contrast adjustment using a slice bar located below the oblique, using pinch and zoom; and tapping outside and moving an oblique area; and move to rotate.
4.2. Visualization of segmentation results Recently, most medical visualization systems have implemented 3D visualization to make easy understanding and learning about human organs. The surface-rendering technique is frequently used to construct a 3D image after organ segmentation has been completed. In our system, we use the benefits of this visualization to show the result from a Graph Cuts segmentation. This aids users in knowing the current shape of the segmentation organ results, which supports usersin making decisions on setting addition seed points. In ISVS_M2, we provide 3D visualization of the segmentation result on mobile devices with support functionality such as opacity adjustment usinga slice bar located below the oblique and surface-rendering objects, and color changing that can change the color of surface rendering by selecting the color in a color panel. ISVS_M2 supports multi-organ segmentation by providinga separate interface for each organ and the user can also place the seed points separately (Fig. 6).
102
Journal of Advanced Simulation in Science and Engineering
(a)
(b)
(c)
Figure 6: Visualization of segmentation result (3D organ model) on mobile device; the fusion visualization of raw CT slices and the 3D liver model (surface rendering) in (a), and the 3D spleen model (surface rendering) in (b); (c) 3D spleen model visualization with different color and opacity.
Figure 7: Fusion visualization of segmented Multi-organ models with rawDICOM data.
4.3. Visualization of multi-organs with DICOM data Visualization of multi-organs allows a user to clearly understand and support the evaluation of the segmentation of each individual organ. This type of visualization provided in ISVS_M2 means that we can visualize the liver, spleen, and 3D planes together (Fig. 7). ISVS_M2 also provides basic functions to manipulate them, the same as other types of visualization in the system, except for the color and opacity adjustment of surface rendering of segmentation resultsthat can directly change them on visualization of segmentation screen. The systemwill transfer the changed information to multiple organs with DICOM visualization automatically.
103
Journal of Advanced Simulation in Science and Engineering
5. Data transmissions For medical data, much memory is required to perform basic image processing such as segmentation. The Graph Cuts segmentation method requires at least 6 GB of memory. Therefore, it seems impossible to use Graph Cuts to process medical data on mobile devices, which have limited memory. To enable mobile clients and servers to seamlessly operate in image segmentation, we use a server to process segmentation and mobile devices as tools for visualization of the result. In ISVS_M2, mobile devices are not only used for visualization, but also as tools to send and receivecommands and data from the server.
5.1. Transfer data from server to mobile devices Transmission Control Protocol (TCP) is used to transfer medical data (e.g., CT data) and the segmentation results from a server to mobile devices. Due to the size of medical data, transferring medical data from the server each time a user wants to use them is not a good idea. To solve this problem, we classify data from a server into two types: 1) static data that do not need updating, and 2) dynamic data that can be updated when needed. To transfer static data (CT data) for visualizing a CT slicer on mobile devices, a cache is used in our mobile devices to store the data. We can access the CT data in our cache, or download CT data if they donot exist. After new CT data are downloaded, these are stored in the cache so that we can access them the next time the CT data are needed, without needing to download them again. With cache management, a mobile device will download CT data only on first access, and access CT data without downloading subsequent times (Fig. 8a). HTTP protocol is used for file transfer, asithas a relatively low overhead considering its huge size load [5]. For the transfer of dynamic data (segmentation results) for visualizing on mobile devices, we cannot use cache management because the segmentation results are updated every time the user updates seed points. To manage the segmentation results, the server sendsall of the segmentation data with an index to mobile devices when performing initial segmentation; after that, the server sends only the updated voxels number and the result index (Fig. 8b). JavaScript Object Notation (JSON) is an open standard format used to transmit data [6]. JSON uses human-readable text and simple syntax, which results in less "markup" overhead and makes for fast transmission. In ISVS_M2, a JSON object is generated ona server when the segmentation result is updated and sent to update the segmentation result on mobile devices. The format of an updated JSON object is as follows: {{"type": string, "index": number, "voxel_id": array}}
104
Journal of Advanced Simulation in Science and Engineering
(a)
(b)
Figure 8: Flow chart of data transfer from server to mobile devices, (a) transfer static data and (b) transfer dynamic data.
5.2. Transferringdata from mobile devices to server Data transmission from a mobile device to the server is sent using User Datagram Protocol (UDP) because all data transferred from a mobile device are commands and seed points. These data are not very important if it lost and need a faster transferwith UDP. We also use a JSON objeFct for sending commands from a mobile device, the same as when receiving an updated result from the server. The format of commands and for managing seeds for a JSON object is as follows: {"type": string, "index": number, "voxel_id": array}
5.3. Processing Time The processing time of ISVS_M2 was evaluated on five CT images with a resolution of 0.625 × 0.625 × 1.25 mm and dimensions of 512 × 512 × 159 voxels. We applied Graph Cuts to segment both the liver and the spleen. The computation times for segmentation and rendering on a mobile phone are summarized in Table 1. It can be seen that the meansegmentation time on a workstation with a 3.6GHz CPU is about 90 sec for the liver and 70 sec for the spleen. The average computation time of Graph Cuts per iteration is about 10 sec for the liver and 6 sec for the spleen, which make interaction between the system and user smooth. The mean rendering rate is about 6 frames per second for the liver, 10 frames per second for the spleen, and 5 frames per second for rendering all objects together when running on an iPhone5.
105
Journal of Advanced Simulation in Science and Engineering Table 1: The processing time of segmentation and visualization Segmentation (sec)
Iteration (sec)
Rendering on mobile (frames/sec)
Liver
Spleen
Liver
Spleen
Liver
Spleen
Planes
All
Data 1
92.8
69.48
9.102
5.791
5.702
10.102
14.421
5.055
Data 2
91.8
68.64
9.426
5.96
5.815
9.991
14.398
5.072
Data 3
83.88
71.28
9.324
6.572
6.131
9.752
14.352
5.412
Data 4
91.04
68.48
10.158
5.564
5.877
9.861
14.402
4.998
Data 5
94.76
70.68
10.772
6.193
5.599
9.734
14.520
4.843
Average
90.856
69.712
9.7564
6.016
5.825
9.888
14.419
5.076
SD
4.1416
1.2366
0.6923
0.38682
0.157
0.062
0.201
0.208
In general, the rendering speed on mobile devices is lower than the speed on workstations or personal computers, but 5 frames per second for rendering all objects on our mobile devices is enough for a user to segment and manipulate medical data on mobile devices.
6. Conclusion In the field of medical research, demand for image segmentation and visualization systems is continuously increasingly. Empowering the usage of systems with ubiquitous access will enhance the work potential of medical doctors and domain experts as well as providing flexibility in terms of working place and time. ISVS_M2 was designed and developed to support working both in a traditional way, like on workstations, and also to provide ubiquitous access via mobile platforms. Our proposed system processes time-consuming and difficult tasks such as image segmentation on servers, while the functionality is controlled on workstations or mobile devices. To provide users with a seamless operation experience, we designed and developed a data transmission protocol over TCP/UDP to support sending commands, constraints and processed visualization information between clients and servers. In addition, user experiences on mobile devices, e.g., pinch and zoom, enhance ease of use, and the usage is natural. Moreover, visualization in ISVS_M2 is on a 3D basis, which renders image data from the interactive segmentation results. Such visualization is capable of better demonstrating completehuman organs, resulting in better analysis. The development of the current version of ISVS_M2 uses Graph Cuts interactive segmentation introduced by Boykov [3] for the initial segmentation and to refine segmentation. We plan in the near future toexpand it so that the initial segmentation will be automated. In addition, we also plan to enhance visualization so that it illustrates more detail of an organ, e.g., vessels of the liver, and to extend the system to support other mobile platforms in addition to iOS.
106
Journal of Advanced Simulation in Science and Engineering
Acknowledgement This work was supported in part by Grants-in-Aid for Scientific Research from the Japanese Ministry for Education, Science, Culture, and Sports (MEXT) under Grant Nos. 24300076, 15H01130, 15K00253, 15K16031, 26289069 and 25280044; in part by the MEXT Support Program for the Strategic Research Foundation at Private Universities (2013-2017); and in part by the R-GIRO Research Fund from Ritsumeikan University.
References [1]
P. A. Yushkevich et al.: User-guided 3D active contour segmentation of anatomical structures: significantly improved efficiency and reliability, Neuroimage, 31:3 (2006), 1116-1128.
[2]
Y. Nimura et al.: PLUTO: A common platform for computer-aided diagnosis, Medical Imaging Technology, 26:3 (2008), 187-191. (in Japanese)
[3]
Y. Boykov, M. Jolly: Interactive Graph Cuts for Optimal Boundary & Region Segmentation of Object in N-D Images, Proceedings ofInternation Conference on Computer Vision, 1 (2001), 105-112.
[4]
P. Jaccard: The distribution of the flora in the alpine zone, New Phytologist, 11:2 (1912), 37-50.
[5]
V. N. Padmanabhan, J. C. Mogul: Improving HTTP Latency, Computer Network and ISDN System, 28:1 (1995), 25-35.
[6]
Introducing JSON: http://json.org/, 2013.
[7]
T. Kitrungrotsakul, C. Dong, X.-H. Han, Y.-W. Chen: Improved Interactive Medical Image Segmentation using Graph Cut and Superpixels, IEICE Technical Reports, 114:103 (2014), 17-20.
107