A plausible approach to developing such a visualization tool is to re-implement the ... within our application architecture, including classes (top- level, inner, and ...
Interactive Visualization of Java Programs Paul Gestwicki, Bharat Jayaraman Department of Computer Science and Engineering University at Buffalo (SUNY) Buffalo, NY, USA
Abstract The design and implementation of a novel visual interactive execution environment for Java is described. This system displays both the run-time object structure as well as the internal details of object and method activations. The representation of the execution state is based upon a novel yet simple representation technique which clarifies the important fact that objects are environments. All major Java features, including inheritance, inner classes, static methods, exceptions, etc., are supported. The GUI components built from Java’s Swing or AWT libraries can be visualized in juxtaposition with the underlying execution state. We also include a reverse-execution mechanism that allows a user to rollback to previous states of an execution. A notable characteristic of the visualization system is that it employs the existing Java Virtual Machine, i.e., no new Java interpreter is needed. A novel pre-processor (source-to-source transformation) is employed in conjunction with a run-time mediator written in Java, which carries out the visualization. A prototype of these ideas has been completed to validate the entire approach.
1. Introduction The object-oriented paradigm has been widely adopted by industry and academia alike. There are many integrated development environments for object-oriented programming languages, such as Forte for Java, VisualStudio .NET, and VisualWorks Smalltalk. Tools like Rational Rose allow for visual modeling using the UML, and more recently developed tools such as Rational XDE attempt to unify the design process with the development process. While software development tools have advanced and matured, tools for visualizing the execution state of objectoriented programs are still lagging behind, and the subject remains an active area of research today. The execution state of object-oriented programs differs fundamentally from that of procedural programs be-
cause an object is an environment within which method activations take place. One characteristic of the objectoriented methodology is that it encourages the use of many small methods, resulting in considerable context-switching among objects at runtime. Depicting the calling sequence of methods is not sufficient; both object-structure and callsequence should be depicted simultaneously, and method activations need to be shown in their respective object contexts. Thus, the visualization for objects cannot be textual (as in a traditional dbx style debugger for C), but must be visual/graphical in nature. For example, classic tools such as the Smalltalk inspector [8] as well as state-of-the-art tools such as IBM’s Visual Age for Java present a clear picture of the sequence of method calls and also allow inspection of the internal details of objects. However, neither the run-time object structure nor the method invocations inside these objects is depicted by these tools, and hence important relationships among objects are omitted. This paper describes a novel approach to visualizing the execution state of object-oriented programs in general and Java in particular. Our approach is incorporated into an interactive visual execution tool for Java, which serves as a sophisticated visual debugger and valuable teaching tool. It allows for interactive execution of user programs, giving a graphical display of the execution state in a clear manner. The tool supports normal execution as well as the ability to rollback and visualize previous states in the execution history. Our designs allow for incorporation of sophisticated graph-drawing techniques to produce optimal and aesthetic graphs that depict object structures. Runtime behavior can be shown in flexible ways, clarifying scope as well as patterns of methods invocations. A plausible approach to developing such a visualization tool is to re-implement the Java interpreter so that it not only executes Java code but also displays the run-time state in a visual manner. This requires substantial work, since a new compiler must be written to translate Java source code into modified JVM (Java Virtual Machine) instructions, and this modified JVM would need to be implemented. The issue of dealing with language libraries must
also be addressed, especially those libraries pertaining to graphical user-interfaces (GUIs). Either the modified interpreter would need to detect calls to library methods and delegate them to the standard Java runtime environment, or it would need to re-implement all of the functionality of these libraries itself. Since Java is an evolving language, it would be an ongoing task to keep the modified JVM current with the latest Java libraries. In this paper, we solve the visualization problem for Java without implementing a modified compiler or a modified JVM. Our solution is called the Java Interactive Visualization Environment, or JIVE. In our design, we reuse the existing Java Virtual Machine while achieving the desired visualization by employing a source-to-source transformation. Our pure Java application runs on the existing JVM, and so there is no need to implement a new Java interpreter. In the transformed program, every executable statement is followed by a call to the JIVE engine, which processes the user-defined objects and displays them. We have developed a library that allows for inspection of objects at runtime. Like Java’s Reflection package, our Inspection library allows for programmatic access to runtime objects’ declared methods and fields; in addition, we include the ability to access the local variables of a method at any point during program execution. Our experiments have shown that many features of Java can be correctly handled and appropriately visualized within our application architecture, including classes (toplevel, inner, and anonymous), inheritance, and static and instance methods. Applications that use Java’s GUI packages — Swing or AWT — can be visualized as seamlessly as console applications; the visualization application itself is not disturbed by the user application’s GUI. We have also begun to explore the possibility of using the Java Platform Debugger Architecture (JPDA) and the benefits and shortcomings of this alternate approach. Our representation of the execution state of objectoriented programs is a substantial extension of a classic notation, called the contour diagram [11]. This notation was first used for describing the execution of Algol-like languages, taking into account scoping rules, recursive behavior, and other features of the language. Contours make explicit the important fact that objects are environments. To this end, we previously showed that contour diagrams are very appropriate for object-oriented languages [9]. Further modifications have been made to support the specifics of visualizing Java. Contour diagrams have been used to visualize the state of concurrent programs — Ada tasks in particular [5]. We have also developed contour diagram semantics for use in a very different paradigm, logic programming, especially backtracking and partially-defined data objects via logic variables [9]. The remainder of this paper is structured as follows: Section 2 explains the visual semantics of our generated dia-
grams; Section 3 gives an overview of visualization tool’s design and explains its implementation; Section 4 compares our research with related projects; and Section 5 presents conclusions and directions for further work.
2. Visual Execution We have developed a graphical notation for depicting the structural relationships between objects as well as behavioral relationships between method invocations. This section provides an introduction to this graphical notation.
2.1. An object is an environment Objects are instances of abstract data types, which in object-oriented programming languages are defined by classes. When procedures are attached to an object, they must be executed in the context of the object in order that the fields of the object are correctly accessed. Thus, objects are environments, or closures in Lisp terminology. Moreover, since these object-environments could be dynamically allocated, the invocation of a procedure defined in a class must be understood in a dynamically allocated object-environment.
Tree -left: Tree -right: Tree -value: int +BST(value:int) +insert(n:int): void
if (n < value) if (left==null) left = new Tree(n); else left.insert(n); else if (n > value) if (right==null) right = new Tree(n); else right.insert(n);
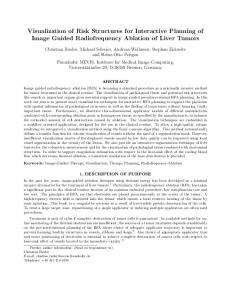
Figure 1. Binary Search Tree in Java Consider the binary search tree class shown in Figure 1. This is a deceptively simple example for a newcomer to object-oriented programming because the names value, left, and right are non-local to the procedure insert, but their meanings depend upon the object context. Figure 2 clarifies this semantics, in particular, how the procedure calls left.insert(n) and right.insert(n) are to be understood. Assume that a procedure main creates an initial Tree object with the value 50 in it, and then inserts in sequence the values 10, 500, and 250. Figure 2 shows how the value
Tree main
method
Tree:0
main.cf main:0
tr
Tree
choice
int
250
value
int
left
Tree
right
Tree
50
Tree
const
Tree.cf
rpdl
insert
method
insert.cf
: tr.insert(choice); :
print
method
print.cf
n
int
insert:0 250 Tree:2
rpdl :
value
int
500
left
Tree
value
int
10
right
Tree
null
left
Tree
null
Tree
const
Tree.cf
right
Tree
null
insert
method
insert.cf
Tree
const
Tree.cf
print
method
print.cf
insert
method
insert.cf
print
method
print.cf
n
int
Tree:1
Tree:3 value
int
250
left
Tree
null
right
Tree
null
Tree
const
Tree.cf
insert
method
insert.cf
print
method
print.cf
insert:0 250
rpdl :
Figure 2. Visual Representation of a Binary Search Tree 250 gets inserted. Notice that the two calls of the insert method are executed in two different object-contours. The environments for methods can be easily distinguished from object contour by relying on Java’s naming conventions. The dotted arrows projecting from method environment’s rpdl (return-point/dynamic-link) fields indicate where control should transfer upon method completion; solid arrows show structural links. Our tool supports the use of different visual cues such as color and line width to make this distinction.
One of the advantages of our visual notation is the simplicity with which variable scope can be determined. Given a variable name in a program, its corresponding value can be found by first searching the local environment. If the name is not found in this scope, proceed to the immediately enclosing environment and search again. This is made possible by carefully nesting environments as explained in our previous work [9]. The scope of variables in all well-formed programs can be determined in this fashion since Java uses static variable scoping. As an illustration, consider when the invocation of insert:0 in Figure 2 refers to the variable value: it is clear that it is the value field of Tree:0 that is being referenced, and this can be determined by using the simple heuristic we have outlined.
2.2. Representing inheritance In object-oriented languages, a class may be defined as a subclass of another class; the subclass inherits the properties of its superclass. Our contour diagram semantics supports an intuitive visualization of inheritence through contour nesting. Consider the example of a Tree class (a binary search tree) and its subclass, the DupTree class (a binary search tree that counts duplicate entries). As shown in Figure 3, the object contour for DupTree:0 is nested within an object contour for its superclass, Tree:0. A new field is added to each DupTree instance, super, which references the associated superclass instance. When DupTree:0 calls super.insert(n), the contour for this new execution appears within the superclass environment, thereby preserving the rules of static variable scoping. Our implementation of contour diagrams hides some of the details of an object’s type. Superclass contours are only shown for those superclasses whose source code is available. If the entire inheritance hierarchy were shown, every object would have at least one surrounding environment, the java.lang.Object environment, except for instances of Object itself. An instance of a javax.swing.JFrame would have no less than six surrounding environments, reflecting its depth in the Java library hierarchy. Our decision to skip some of these details was made for the sake of diagram simplic-
Tree:0 left
Tree
null
right
Tree
null
value
int
50
Tree
const.
Tree.cf
insert
proc
insert.cf
print
proc
print.cf DupTree:0
count
int
super
Tree
insert(int)
proc
1
insert.cf insert:0
n
int
25 ...
rpdl if (n == value) count++; else super.insert(n);
insert:0 n
int
25
rpdl if (n < value) left.insert(n); else right.insert(n);
Figure 3. Visual Semantics for Inheritance ity, but future work will explore the results of attempting to show the completely detailed runtime environment.
ecution in a static context: the main method. The interaction between static space and instance space is visualizable through our application, although the user may choose to hide either space to focus on the one of interest. While Figures 2 and 3 are conceptual diagrams for depicting the run-time object structure and method invocations, Figure 5 is an actual snapshot of such a diagram taken from our current visualization system. The source code for the application being visualized can be seen in Figure 4; the code has been slightly modified to reduce its length. It is a simple Swing application that allows a user to insert values into a binary search tree or print, in order, the values in the tree. The highlighted code, tree = new BST(1);, corresponds to the point when the Tree application program has just created a node of a binary search tree (BST) class. The figure also shows that the TreeApp:0 object contains a nested environment, TreeAppActionListener:0, which represents an inner class. (The suffix “:0” is a numeric index to distinguish different objects of a class.) This is a nonstatic inner class, which does not have a static counterpart, so there will be no TreeAppActionListener environment in static space; hence the static space is not shown in this diagram. At the bottom of Figure 5 is shown the userprogram’s GUI for interaction with the Tree application class. Values entered in the text field are inserted into the tree when “Insert” is clicked, and the contents of the tree is shown by clicking the “Print” button. The user may step through the program execution using the Step button shown at the top of the screen-shot, in the JIVE application window. After several insert operations, the visualization system would render the overall object-structure as a binary tree. We are experimenting with various options to allow the user to determine the level detail to be shown in the diagram, e.g. information for all objects and methods, information for all objects only, information for a selected object only, etc. Figure 8 gives a modified screenshot that shows one possible form of visualization using a more appropriate graph drawing algorithm.
2.3. Static space and instance space
3. Visualization System Design
The fields of a class definition in Java may be bound either to a static context or to instances of the class (an object). This implies a division of program space into static space and instance space. Every loaded class has a single static context associated with it and zero or more object contexts. When a method contour is created to reflect a method invocation, the placement of the method depends on its binding: static methods will be nested in the static space associated with the enclosing class, and instance methods will be within the object on which the method was called. Proper handling of this separation is especially important in Java due to the fact that all Java applications begin ex-
One of the major factors influencing our design is the desire to visualize applications that have graphical userinterfaces. To achieve maximum modularity, we have separated the user program’s process from the visualization tool’s process. The communication between the two is summarized in Figure 6. When there is a change in the user program space, the mediator notifies its listeners; this notification is performed using Java’s Remote Method Invocation (RMI) for interprocess communication, and the notification is accompanied by state information. The MediatorListener object extracts the pertinent information from the state information and then notifies the visualization sys-
public class TreeApp extends JFrame { private final JButton insertButton; private final JButton printButton; private final JTextField field; private final JTextArea transcript; public TreeApp() { super("TreeApp"); // GUI initialization elided } public static void main(String[] args) { TreeApp app = new TreeApp(); app.show(); } private class TreeAppActionListener implements ActionListener { public void actionPerformed(ActionEvent e) { if (e.getSource()==insertButton) {...} else if (e.getSource()==printButtOn( {...} } } class BST { private BST left, right; private int data; public BST(int data) { this.data = data; } public void insert(int value) { if (valuedata) if (right!=null) right.insert(value); else right = new BST(value); } public void print(PrintWriter pw) { if (left!=null) left.print(pw); pw.print(data + " "); if (right!=null) right.print(pw); } }
Figure 5. TreeApp source code
Figure 4. Visualization of the TreeApp
tem of the change, thereby synchronizing the visualization with the current state of the user program. In the remainder of this section, we discuss how our system is able to support this behavior. Mediator
RMI
Visualization System
public class Tree { ... public void print(PrintStream s) { if (left!=null) { left.print(s); } s.print(value); if (right!=null) { right.print(s); } } } Source transformation public class Tree { static Mediator _m = Mediator.getSingleton(); ObjectInspectable _o = new ObjectInspection(...);
User Program Runtime Environment
...
Visualization of Runtime Environment
public void print(PrintStream s) { MethodInspectable _i = new MethodInspection(_o, ...); _m.methodStarted(_i); if (left != null) { _m.blockEntered(_i); left.print(s); _m.statementFinished(_i); } s.print(value); _m.statementFinished(_i); if (right != null) { _m.blockEntered(_i); right.print(s); _m.statementFinished(_i); } _m.methodFinished(_i); }
Figure 6. Communication between Processes
3.1. Source-to-source transformation A user program must be transformed into a visualizable program prior to visualization. We have designed a sourceto-source trasformation and implemented parts of it using WebGain’s JavaCC and JJTree. A standard approach is used: the source file is read, a parse tree is built, and various visitors pass through the parse tree whereby output is generated [7]. In our case, the output is Java source code, which is then compiled using a standard Java compiler. Our implementation uses Sun’s Java 2 Platform Standard Edition 1.4.0 compiler. The code transformation process is responsible for annotating the user program so that it is fully inspectable, allowing its runtime information to be accessed through the Inspection application programming interface (API), and for adding the invocations on the Mediator that allow for interactive program execution. A fully inspectable class will contain a StaticInspectable proxy for its static space, an ObjectInspectable proxy for every instance of the class, a MethodInspectable proxy for every method, and an InnerObjectInspectable for every inner class. In addition, it will send notification to the Mediator after every statement completion, method invocation, variable update, object creation, and class loading; this ensures that the visualization is kept synchronized with the state of the user program. It is also at this stage that state information is saved via the Memento pattern [7].
}
Figure 7. Sample source transformation Figure 7 shows a sample source transformation from a partial implementation of a binary search tree. This example shows how proxies are created for the method activation context, specifically, a MethodInspectable is created to represent the method activation. Notification is sent through the Mediator singleton to the visualization application at each point where the diagram needs to be updated, as discussed above.
3.2. Inspection Java Reflection allows an application developer to access the runtime type information of a Java program, and it provides a system whereby instance and static variables’ values can be obtained. Our Inspection API provides access
to these details and also to the local variables of individual method activations. We define one interface, Inspectable, that is extended by interfaces specific to certain Java constructs; these interfaces are MethodInspectable, StaticInspectable, ObjectInspectable, and InnerObjectInspectable. Each interface has a corresponding Inspection class. The Inspection classes implement the interfaces and contain proxies for each member of the component being inspected. For example, a method that defines a local variable value would have a MethodInspection that also contains a value. Whenever a change is made to the local variable, the proxy’s corresponding value also changes. This notification is automatic and made possible during the source-to-source transformation process described in Section 3.1.
3.3. Interactive execution JIVE features interactive execution, the ability to run an application at statement-level intervals. The user program must first be transformed into a visualizable program through a source code transformation (Section 3.1). As stated earlier, we use a two-process design: the user program process and the visualization system process communicate via Java RMI. This design is necessary in order to support the visualization of user programs with graphical user interfaces (GUI). If a single process were used, both the visualization interface and the user program’s GUI would share a single AWT-Event thread. In this case, if the user decided to pause the execution of the user program while it was running the AWT-Event thread, the visualization interface itself would also necessarily be stopped, creating a deadlock condition. RMI was designed for distributed systems, but it also allows for efficient communication between processes on the same machine. Additionally, using RMI presents the possibility of incorporating distributed visualizations in future versions. When a statement is executed in the user program, notification is sent to the visualization system, along with the details of the source code to be highlighted and any object state changes. Since RMI invocations are synchronous, the user program will pause until the method returns. The visualization system receives the RMI invocation on a special thread and then locks that thread, thereby leaving the user program in its paused state. When the user chooses to step to the next statement via the visualization GUI, the thread is resumed, the remote method call returns, and the user program is free to continue to its next step. Communication between the user program and the visualization application is managed by the Mediator class. A singleton instance of this class resides in the user program space, and it is to this object that the user program sends notification of program events such as variable modifica-
tion, object creation, and statement completion, as can be seen in the modified source code of Figure 4. Following the Observer design pattern, the Mediator allows for the attachment of observer objects that implement the MediatorListener interface [7]. MediatorListener is a remote interface, that is, it extends javax.rmi.Remote. This implementation of the Observer design pattern builds a bridge between the two processes: events in the user program are serialized and sent via RMI to JIVE for processing. We represent contour digrams internally as directed graphs whose vertices are contours and whose edges represent the connectivity of the contours. Edges represent either structural relationships, such as an object referencing another in an instance variable, or behavioral relationships, such as when a method calls another method. The two graphs obtained by tracing structural and behavioral relationships share the same set of nodes; it is only the set of edges that changes. Consider Figure 2 as an example: the dotted arrows form behavioral edges while the solid arrows form the structural edges. Environments may be nested within each other, so any environment may contain within it an arbitrarily complex graph whose edges may or may not extend beyond the containing environment’s boundaries. We have currently developed only one simple strategy for drawing these graphs: vertical arrangement of contours with no edges drawn. We plan to examine more advanced graph drawing techniques as part of our future work. Figure 8 is a modified screenshot that shows how we envision the finished tool’s drawing capability. Once again, structural connections are shown with solid arrows, and method invocation paths are shown with dashed arrows.
3.4. Alternate design using JPDA The Java Platform Debugger Architecture (JPDA) can be used in an alternate design for the visualization system. Since JPDA operates on compiled class files, there is no need for a source-code transformation; however, the class files must have been compiled with debugging enabled for full JPDA support. There is an additional restriction that the user must be running a JVM that has implemented the Java Virtual Machine Debugger Interface (JVMDI), such as Sun’s J2SE VM. This design maintains the two-process approach, but since JPDA uses its own interprocess communication protocols, there is no need to use RMI for this purpose. JPDA provides interfaces for dealing with all of Java’s types and features, so we need not reimplement this, which is done in the Inspection library. An important limitation on JPDA is that new functionality cannot be added without rewriting the library interfaces and therefore the virtual machines that implement them. On the other hand, our approach of transforming the source code is modifiable to support features not present in the
Figure 8. Binary search tree visualization
JPDA. We are exploring the JPDA-based design, but we are still in the experimental stages.
4. Related Work To the best of our knowledge, there is no program visualization tool that supports the visualization of both object structure and method invocations. The other projects we have examined focus on one of two domains: coursegrained visualization of program behavior or simplified views of runtime objects. Our tool attempts to bridge the gap, being useful as a visual debugger and a pedagogic tool. The benefits of program visualization in an objectoriented environment have been discussed by Jerding and Stasko [10]. Our work builds upon theirs by providing complete visualizations with statement-level granularity, while theirs was restricted to method-level. We have taken into consideration the four visualization objectives Jerding and Stasko propose: minimizing programmer intervention, presentation of the important apsects of a program, allowing for users to quickly focus, and scalability to nontrivial applications. They also mention “rewinding” execution states, a capability that we have found to be greatly beneficial in our experimentation. While contour diagrams bear some resemblance to UML object interaction diagrams [1], there are important differences between the two. Briefly, UML object diagrams are useful during the design phase, whereas contour diagrams are useful during the execution phase. UML object interaction diagrams are used during design in order to discover which classes and methods are incorporated into the target program. Furthermore, UML methodologies, such as Catalysis [6], are all focused on the modeling process. Since the code for methods is not yet developed at this stage of design, a UML object diagram does not represent the actual execution state of a program; it can be regarded as an abstraction of the actual execution state. Contour diagrams, on the other hand, provide a complete representation of the runtime state of the actual execution of a program. They are an example of a visual operational semantics for a programming language. An ideal programming environment would support both these techniques, so that a program could be developed using UML object diagrams, and the execution of the program can visualized using Contour diagrams. BlueJ is an environment for teaching introductory objectoriented programming [13]. Its main visualization feature is the ability to program through the creation of class diagrams similar to the UML’s. A programmer designs the class diagram, and BlueJ generates skeleton code that must be completed manually. BlueJ allows for the instantiation of objects, the execution of methods on those objects, and the inspection of variables. However, it does not provide a display of the runtime object diagram — the structural
relationships between objects — nor does it provide a visualization of method activations in their appropriate object environments. BlueJ has no mechanism to visualize the superclass of an object and hence cannot clarify issues of semantics of method invocations in a general class hierarchy. Bloom is a software tool that allows a user to generate sophisticated software visualizations in order to enhance software understanding [12]. This system includes a variety of data analysis techniques, a visual query language for defining what should be visualized, and a framework containing a broad range of 2D and 3D visualizations. Their goal is to let the user rapidly create a sophisticated software visualizations. However, Bloom offers no mechanism for inspecting individual method activations. Its trace analysis techniques will be built upon with the dynamic analysis planned for the proposed research. Our incorporation of source-code transformation for interactive execution bears some similarity to the architecture described by De Pauw et al. [2]. This work is clearly motivated towards performance analysis and error detection. The view of the program is very wide; it does not attempt to show fine-grained discrete program states. Related work from IBM indicates object construction/destruction and method entry/exit as key events for program visualization [3]; our work extends this to include stepwise, statement-by-statement execution for fine-grained visualization. Our own research group has previously developed program visualization tools with similar intents. The older version was designed to deal with a language similar to C but with support for multiple parameter passing techniques (value, result, reference, name). User programs were compiled into an intermediate representation, a postfix bytecode, which was then given to a virtual machine for execution. When we decided to attempt to visualize Java, a similar approach was undertaken: we compiled user programs into an intermediate representation inspired by the Java Virtual Machine bytecode. This design required the development of a virtual machine to interpret this bytecode; the design was abandoned in favor of the current one, which runs on any existing JVM.
5. Conclusions and Further Work We have created a prototypical implementation using the approach discussed in this paper. This implementation shows that our methodology of using a source-code transformation and our Inspection system provides a sound basis for interactive visualization of Java programs. The current implementation allows the GUI built by the user program to coexist with the GUI of the visualization system (as in Figure 5), and exhibits no appreciable delays during interactive execution. The prototype does not yet contain
a fully-implemented preprocessor; all source programs are currently translated manually. We are currently developing the preprocessor, which will allow us to test larger source programs. The dynamic, structurally recursive nature of our visualizations opens the door for many related research issues. Our current JIVE prototype only supports fully-detailed contours and a simple drawing algorithm. Our current work is focused on implementing improved graph drawing algorithms using standard layered digraph drawing algorithms [4] and implementing arrow-drawing methods for clarity in visualization. Our designs also allow for usercustomizable visualizations, freeing the user to manually arrange contours or to select from alternate layout algorithms. We will also be adding support for varying level of contour details, allowing the user to elide class or object members on demand. Just as geographical maps are available at different scales and sizes, we aim to support multiple, scalable views of a contour diagram. We are investigating the open problem of optimally and dynamically determining the proximity of contours. The full implications of the Inspection API have not yet been explored. We are in the process of building support for exceptions and multithreaded applications. Since the software architecture is already making use of RMI, we are also beginning to examine the benefits of extending our visualization to distributed domains. The possibility of using the Inspection API and our state monitoring functionality for computer security research has also been proposed.
6. Acknowledgements This work was funded in part by a grant from the National Science Foundations. The authors would also like to acknowledge Eric Crahen for his influential assistance.
References [1] G. Booch, J. Rumbaugh, and I. Jacobson. The Unified Modeling Language User Guide. Addison-Wesley, 1999. [2] W. De Pauw, R. Helm, D. Kimelman, and J. Vlissides. An architecture for visualization the behavior of object-oriented systems. Technical report, IBM T.J. Watson Research Center, 1993. [3] W. De Pauw, D. Kimelman, and J. Vlissides. Modeling object-oriented program execution. Technical report, IBM T.J. Watson Research Center, 1994. [4] G. Di Battista, P. Eades, R. Tamassia, and I. G. Tollis. Graph Drawing: Algorithms for the Visualization of Graphs. Prentice Hall, 1999. [5] L. K. Dillon. A visual execution model for ada tasking. ACM Trans. on Software Engineering and Methodology, 2(4):311–345, 1993.
[6] D. D’Souza and A. C. Wills. Objects, Components, and Frameworks with UML: The Catalysis Approach. AddisonWesley, 1998. [7] E. Gamma, R. Helm, R. Johnson, and J. Vlissides. Design Patterns: Elements of Reusable Object-Oriented Software. Addison-Wesley, 1995. [8] A. Goldberg and D. Robson. Smalltalk: The Interactive Programming Environment. Addison-Wesley, 1980. [9] B. Jayaraman and C. Baltus. Visualizing program execution. Proc. IEEE Symp. on Visual Languages, pages 30–37, September 1996. [10] D. F. Jerding and J. T. Stasko. Using visualization to foster object-oriented program executions. (GIT-GVU-96-15), May 1996. [11] J. B. Johnston. The contour model of block-structured processes. Proc. ACM Symp. Data Structures in Programming Languages, pages 35–82, February 1971. SIGPLAN Notices. [12] S. R. Reiss. An Overview of BLOOM. ACM SIGPLAN – SIGSOFT workshop on Program analysis for software tools and engineering, pages 2–5, 2001. [13] J. Rosenberg and M. Kolling. BlueJ: The interactive java environment. ACM SICSE, 1999.