1. INTRODUCTION. Image interpolation methods have been known to introduce artifacts (local optima) in objective functions used for auto- matic intensity-based ...
INTERPOLATION ARTIFACTS IN BIOMEDICAL IMAGE REGISTRATION G.K. Rohde 1 , D.M. Healy, Jr.2 , C.A. Berenstein 2 , A. Aldroubi 3 1
Department of Biomedical Engineering, Carnegie Mellon University, Pittsburgh, PA. 15213 2 Department of Mathematics, University of Maryland, College Park, MD, USA. 20742. 3 Mathematics Department, Vanderbilt University, Nashville, TN, USA. 37235. ABSTRACT
Using the generic framework of B-spline image interpolation we then show that the energy of interpolated, translated, and sampled data sequences oscillates with respect to the translation parameter. We show that Monte Carlo integration methods can be used to compute objective functions without artifactual oscillations. Finally results and conclusions are offered.
We identify a cause for interpolation artifacts in objective functions by observing that the energy of interpolated and translated �2 sequences oscillates with respect to the translation parameter. Using the B-spline interpolation framework, we show that such oscillations in the energy of the signals affect the sum of squared differences, cross correlation, and mutual information objective functions. We describe several approaches that can be used to avoid interpolation artifacts (such as higher degree interpolation, as well as stochastic sampling) and explain in detail why these are effective in eliminating the artifacts.
2. THEORY
Index Terms— Image registration, interpolation, artifacts, local optima 1. INTRODUCTION Image interpolation methods have been known to introduce artifacts (local optima) in objective functions used for automatic intensity-based image registration. To date most consider such artifacts to be a feature specific to the mutual information similarity measure [1, 2, 3]. A common strategy for avoiding such artifacts has been through the introduction of a randomizing sampling operation (see [2, 4, 3] for examples), though a precise cause for the oscillatory artifacts when regular sampling is used has not been mathematically demonstrated. In [5, 6] we showed that the covariance properties of an image undergoing spatial transformations can cause artifactual oscillations, and in some cases local optima, in the sum of squared differences (SSD), cross correlation (CC), and mutual information (MI) objective functions. Our arguments, however, were entirely stochastic in that only the effects of additive noise were considered. Here we provide a more general and concise explanation for oscillation artifacts in the objective functions used above and show that even interpolation on signals or images with no noise can cause oscillation artifacts. We explain three approaches for avoiding them based on low pass filtering the image, higher degree interpolation, and Monte Carlo integration. We begin by showing that the energy of interpolated data sequences is present in all objective functions named above.
1424406722/07/$20.00 ©2007 IEEE
Let �2 denote the space of square summable infinite dimensional real valued sequences. The inner product � between two sequences a, b in �2 is defined by �a, b��2 = k∈Z a(k)b(k) while �b�2�2 = �b, b��2 . A convolution between two �2 sequences is denoted a ∗ b and thus b can be though of as a discrete operator characterized by its transfer function B(z) = � −k . If B has no zeros on the unit circle, then the k∈Z b(k)z inverse operator (b)−1 exists and is uniquely defined by: (b)−1 ←→1/B. A sequence s ∈ �2 can be translated by an arbitrary amount θ ∈ R by first fitting an interpolation (or approximation) model to s and then sampling the model at a translated set of coordinates normally organized on a regular grid. Let β 0 refer to the centered normalized rectangle. Then the B-spline function of degree n at value x is given by β n (x) = β n−1 ∗β 0 (x). Let � s˜(x) = s(k)η n (x − k). (1) �
k∈Z
n −1 where η (x) = (k)β n (x − k) and bn (k) = k∈Z (b ) n β (x)|x=k . The translated data sequence can then be represented by s˜(k + θ) = ηθn ∗ s(k) (2) n
where ηθn (k) = η n (k + θ). These operations can be extended to dimensions 2 and over via tensor products of η. 2.1. Objective functions The goal in image registration is to compute a function fθ : Rd → Rd , where θ are parameters that determine f , such
648
ISBI 2007
that two signals (images) are aligned. This procedure can be automated as an optimization problem: fθ∗ = arg max Q(s, t, fθ ), fθ
where Q(· · · ) is the objective function chosen for a specific problem. An intuitive figure of merit for quantifying how well two sequences s and t align is the squared �2 norm of its difference (SSD). Let s˜θ = {˜ s(fθ (k))}k∈Z . The SSD objective function, to be minimized in this case, is: Q(θ) = �˜ sθ − t�2�2 = �t��2 − 2 �˜ sθ , t��2 + �˜ sθ �2�2 . Another objective function often used is the cross correlation between the signals: Q(θ) =
�
� � pS θ ,T (μ, υ) log
σS2 θ =
pS θ ,T (μ, υ) pS θ (μ)pT (υ)
� dμdυ
where � � 1 IG (T, S θ ) = − log 1 − ρ2 (θ) , ρ(θ) = ξ(θ)/σT σS θ 2 ξ(θ) stands for the covariance between random variables S θ and T , and σT2 and σS2 θ represent their respective variances. R(θ) is a residual term. Assuming stationarity and ergodicity, these quantities can be estimated from a set of samples s˜(fθ (k)) and t(k), k ∈ Ω: 1 � s˜(fθ (k))t(k), N k∈Ω
σT2 =
1 � |t(k)|2 , and N k∈Ω
σS2 θ =
1 � |˜ s(fθ (k))|2 , N k∈Ω
1 1 � |˜ s(fθ (k))|2 . �˜ sθ �2�2 − N N k∈Ω /
Using the Gram-Charlier series expansion for the pdfs above, the MI between two random variables can also be written as [9]: M I(θ) = IG (θ) + R(θ)
ξ(θ) =
assuming the signals are zero mean, where Ω represents a set of predefined coordinates and N = |Ω|. Clearly, σS2 θ is related to �˜ sθ �2�2 via:
�˜ sθ , t��2 . �t��2 �˜ sθ ��2
Finally, the registration between two images can also be computed by maximizing the MI between them. Originally introduced as a similarity measure for registration problems in [7, 8], the MI between two signals s˜θ and t quantifies the amount of ‘information’ due to s˜θ is present in t. Let S θ and T represent random variables associated with the discrete signals {˜ s(fθ (k))}k∈Z and {t(k)}k∈Z , respectively, with probability density functions (pdf) pS θ (μ), pT (υ), and joint pdf pS θ ,T (μ, υ). The mutual information is defined as Q(θ) =
Fig. 1. Frequency response for cardinal B-spline translation filters for different translation values (a) and degrees (b).
2.2. Oscillation artifacts Note that the term �˜ sθ ��2 is present in all three objective functions discussed above. Using the B-spline interpolation framework defined earlier we now show that this quantity can oscillate with respect to translations fθ (k) = k + θ. Using (2) we have � π 1 �˜ sθ ��2 = |ˆ s(ω)ˆ ηθn (ω)|2 dω (3) 2π −π with ηˆθn (ω) =
∞ �
η n (k + θ)e−iωk .
k=−∞
In Figure 1 we plot |ˆ ηθn (ω)|, ω ∈ [−π, π] for different values of θ and n. It is clear that, for a fixed degree n, |ˆ ηθn | is not constant with respect to the translation parameter θ. When θ ∈ Z, |ˆ ηθn | = 1 and thus the frequency content of s is not modified and the signal’s energy remains intact. As θ approaches 0.5, ηˆθn attenuates any high frequency components in s more than when θ is close to zero. Therefore the energy of the interpolated sequence is dependent on the translation parameter θ. This dependency is elucidated in equation (3) and Figure 1. 3. AVOIDING OSCILLATION ARTIFACTS Based on the arguments above, two obvious strategies for avoiding oscillation artifacts in image registration can be used: low pass filtering the data, and high degree B-spline interpolation. For a fixed degree n, the frequency content of the signal s can be modified by low pass filtering it so that its support is located where |ˆ ηθn | ∼ 1. The drawback of this approach is that low pass filtering can also remove information (edges) which could be useful in determining the match.
649
Another option, as indicated in Figure 1, is to increase the degree of the B-spline in use so that |ˆ ηθn | ∼ 1 wherever |ˆ s| is significantly different from 0. As the degree n increases, however, so does the computational complexity of the overall procedure. We now show that Monte Carlo integration can be used together with low degree interpolation as an attractive alternative for computing all three similarity measures discussed. Expanding �˜ s(fθ )�2�2 we have �� � �˜ s(fθ )�2�2 = s(p)s(q) ϕ(k) p∈Z q∈Z
k∈Z
q). The oscillation where ϕ(k) = η n (k + θ − p)η n (k + θ −� artifacts discussed above occur because k∈Z η n (k + θ − p)η n (k + θ − q) is not independent of θ. Replacing this term with its continuous version would address the issue since � ∞ η n (x + θ − p)η n (x + θ − q)dx = −∞ � ∞ η n (x − p)η n (x − q)dx. −∞
Such continuous formulation is rarely used in image registration problems due to computational considerations. Moreover, it would be unfeasible for computing the mutual information objective function. The basic result in Monte Carlo methods states that the integral of a bounded function ϕ(a), a ∈ Ω, can be estimated by first generating a set of pseudo-random numbers ak , k = 1, · · · , M uniformly distributed in Ω and then using |Ω| M
M �
ϕ(ak ).
k=1
In the sense of expectations, the sum above approximates the value of the integral since: |Ω| � ϕ(ak ) ≈ |Ω|E{ϕ(a)} = M M
k=1
� Ω
ϕ(a)da.
Because a is a (pseudo) random variable uniformly distributed in Ω we may use another random variable a + θ where θ is a deterministic constant and a + θ is a random variable uniformly distributed in Ω (ignoring edge effects). Clearly, E{ϕ(a)} ≈ E{ϕ(a + θ)}. Therefore we have: M M 1 � 1 � ϕ(ak ) ≈ ϕ(ak + θ) and M M k=1
k=1
M �
�s, t�M C =
�
s˜(ak )t˜(ak )
k∈Z
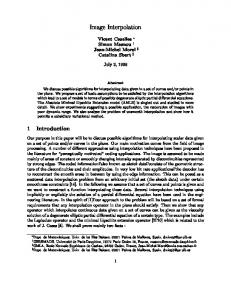
where s˜(x) and t˜(x) refer to the interpolated values defined in equation (1), and ak refers to an uniformly distributed random coordinate. As before, we define �s�2M C = �s, s�M C and henceforth whenever we speak of a similarity measure computed using Monte Carlo integration, we replace �s, t��2 with �s, t�M C where appropriate. Finally, note that all conclusions regarding stochastic integration translate without problems to dimensions 2 and higher, since we are using separable B-spline interpolation. 4. COMPUTATIONAL EXAMPLES Figure 2 contains the 2D image (microtubules of HeLa cell [10]) used to demonstrate the concepts discussed in the previous section. The image was translated with respect to itself from left to right and at each translation value the CC (Figure 3) and MI (Figure 4) objective functions were computed using several approaches. The SSD objective function figure is omitted for brevity. Results show that the linear interpolation method produces the oscillation artifacts in all cost functions as predicted by our theory. High degree interpolation (n = 5 in this case) produces objective functions without accentuated oscillations artifacts. As discussed earlier, linear interpolation used in conjunction with smooth (in this case blurred with a 3x3 constant filter) versions of the data can also be used to produce smooth versions of objective functions. Finally, linear interpolation can also be used in conjunction with Monte Carlo integration to produce registration curves without oscillation artifacts.
Previously we had shown, using stochastic arguments, that low degree interpolation on noisy images can cause artifactual oscillations in SSD, CC, and MI objective functions used in
η (ak + θ − p)η (ak + θ − q). n
We conclude that if stochastic methods are used to approximate integrals, the oscillations described above do not occur. Thus we define the stochastic sum
5. SUMMARY AND CONCLUSIONS
η n (ak − p)η n (ak − q) ≈
k=1 M �
Fig. 2. Test image used in translation experiments.
n
k=1
650
6. REFERENCES [1] J.P.W. Pluim, J.B.A. Maintz, and M.A. Viergever, “Interpolation artefacts in mutual information-based image registration,” Computer Vision and Image Understanding, vol. 77, pp. 211–232, 2000. [2] J. Tsao, “Interpolation artifacts in multimodality image registration based on maximization of mutual information,” IEEE Transactions on Medical Imaging, vol. 22, pp. 854–964, 2003. [3] P. Th´evenaz, M. Bierlaire, and M. Unser, “Halton sampling for image registration based on mutual information,” Sampling Theory in Signal and Image Processing, vol. In Press, 2006.
Fig. 3. Cross Correlation (vertical axis) w.r.t translation (horizontal axis), in pixels, using different approaches. See text for description.
[4] R. Gan, J. Wu, A.C.S. Chung, S.C.H. Yu, and W.M. Wells III, “Multiresolution image registration based on Kullback-Leibler distance,” in MICCAI, C. Barillot, D.R. Haynor, and P. Hellier, Eds., Berlin, 2004, vol. 3216 of LNCS, pp. 599–606, Springer-Verlag. [5] G.K. Rohde, C.A. Berenstein, and D.M. Healy Jr., “Measuring image similarity in the presence of noise,” in Proceedings of the SPIE Medical Imaging: Image Processing, J.M. Fitzpatrick and J.M. Reinhardt, Eds., San Diego, USA, February 2005, vol. 5747, pp. 132– 143. [6] G.K. Rohde, Jr. D.M. Healy, C.A. Berenstein, and A. Aldroubi, “Measuring image similarity to sub-pixel accuracy,” in Proceedings of the IEEE International Symposium on Biomedical Imaging (ISBI), Washington, DC, USA, April 2006, pp. 638–641.
Fig. 4. Mutual Information (vertical axis) w.r.t translation (horizontal axis), in pixels, using different approaches. See text for description.
[7] A. Collignon, F. Maes, D. Delaere, D. Vandermeulen, P. Suetens, and G. Marchal, “Automated multimodality image registration using information theory,” 1995, Information Processing in Medical Imaging, pp. 263–274, Kluwer Academic Publishers. [8] W.M. Wells III, P. Viola, H. Atsumi, S. Nakajima, and R. Kikinis, “Multi-modal volume registration by maximization of mutual information,” Medical Image Analysis, vol. 1, pp. 35–51, 1996.
registration problems [5, 6]. Here we extend the analysis presented elsewhere to include a deterministic, frequency-based, explanation for the artifacts encountered in common objective functions. We proposed and discussed several approaches for avoiding interpolation artifacts (blurring, high degree interpolation, and Monte Carlo methods). We also included here an explanation for the improvements that can be achieved with stochastic sampling. This has been corroborated, with computational experiments, elsewhere [2, 4, 3]. Computational examples using an image of microtubular structure in a cell are in good agreement with the theory we presented. Computational examples using ‘local’ translations (important for nonrigid registration problems) can also be performed [9] to demonstrate similar concepts.
[9] G.K Rohde, D.M. Healy Jr., C.A. Berensteing, and A. Aldroubi, “Interpolation artifacts in sub-pixel image registration,” Preprint, 2006. [10] M. V. Boland and R. F. Murphy, “A neural network classifier capable of recognizing the patterns of all major subcelluar structures in fluorescence microscope images of HeLa cells,” Bioinformatics, vol. 17, pp. 1213–1223, 2001.
651