Today, surface analysis methods using AES and XPS are the backbone of any ....
was the introduction of the cylindrical mirror analyzer by Palmberg, Bohn, and.
Chapter 1
Introduction and Outline
By the middle of the last century, it became obvious that the chemical composition of surfaces and interfaces in atomic dimensions determines many properties of materials. For example, corrosion and oxidation, intergranular brittle fracture, wear and friction, and electronic properties strongly depend on surface and interfacial microchemistry [1.1]. Therefore, there was a growing demand for analysis on the atomic layer scale. This fact enhanced the rapid development of surface analysis methods based on ion and electron spectroscopy. Auger electron spectroscopy (AES) was the first technique used for surface analysis of solids, followed by X-ray-induced photoelectron spectroscopy (XPS). Both techniques have outstanding features when compared with other surface and interface analysis techniques (see Chap. 10). They are characterized by a relatively small matrix effect, by the capability of easy elemental identification and the detection of chemical bonds, and they are principally nondestructive. Furthermore, particularly in AES, an outstanding spatial resolution and, in XPS, a high energy-resolution enable mapping of elements and of chemical states. AES and XPS can be easily combined with ion sputtering to obtain high-resolution compositional depth profiles in thin films. Today, surface analysis methods using AES and XPS are the backbone of any materials research laboratory. By their application, a large number of topics in materials science can be successfully treated, as compiled in Table 1.1. By this book, the reader is provided with the knowledge necessary to understand AES and XPS and to successfully apply these techniques to solve typical problems.
1.1 Historical Background Although AES and XPS have a different historical background, it is obvious that both are electron spectroscopies with a similar energy range, and, therefore, they have much in common. Over the years, there was a steady convergence with respect to instrumentation, and the use of modern hemispherical analyzers in both S. Hofmann, Auger- and X-Ray Photoelectron Spectroscopy in Materials Science, Springer Series in Surface Sciences 49, DOI 10.1007/978-3-642-27381-0 1, © Springer-Verlag Berlin Heidelberg 2013
1
2
1 Introduction and Outline
Table 1.1 Application of surface analysis methods to topics in materials science Surfaces Interfaces Thin films Direct Via fracture and/or profiling Depth profiling Segregation Diffusion Contamination Adsorption Oxidation Passivation Catalysis Friction and wear
Segregation Diffusion Embrittlement Intercrystalline corrosion Sintering Adhesion Composites
Interdiffusion Implantation Interfacial reaction layers Evaporation layers Coatings Layered nanostructures Electronic device structures
techniques has come to a point where by adding an X-ray source to an Auger spectrometer or an electron gun to an XPS instrument is practically all one needs to have a combination instrument. Historically, the foundations of XPS were laid much earlier than that of AES. Let us first have a brief look at the historical development [1.2].
1.1.1 X-Ray-Induced Photoelectron Spectroscopy (XPS) In 1887, Heinrich Hertz discovered the effect of light on the generation of electric sparks [1.3]. Hallwachs [1.4] as well as Lenard and Wolf [1.5] studied this phenomenon in more detail, and Philipp Lenard [1.6] was the first to correctly describe the light-induced electron emission on metal surfaces including the work function that could not be understood by the classical wave theory of light. After the quantum theoretical explanation of the photoelectric effect by Einstein in 1905 [1.7], it was clear that the energy of the emitted photoelectron contains information of the solid from which it is emitted. In 1914, Rutherford and coworkers [1.8, 1.9] recognized that the kinetic energy of the emitted electron is the difference between X-ray energy and electron binding energy. The following decades saw X-ray-induced photoelectron spectroscopy left far behind the development of X-ray spectroscopy, mainly because of the greater experimental difficulties of the former. A major step forward in photoelectron spectrometry was the work of Robinson [1.10] (1923) and of Robinson and Young [1.11], who in 1930 clearly observed the line shift caused by chemical bonding (“chemical shift”) that was most important for further applications of XPS. The development of precision electron spectrometers by Steinhardt and Serfass at Lehigh University [1.12] and above all in Uppsala by Kai Siegbahn led to the first XPS spectra with high resolution in the 1950s. In the subsequent decades, Siegbahn’s group investigated core level binding energies and their shifts due to chemical bonding. Siegbahn coined the acronym ESCA (electron spectroscopy for chemical analysis), that includes Auger electrons besides photoelectrons, published a famous book with that title in 1967 [1.13] and received
1.1 Historical Background
3
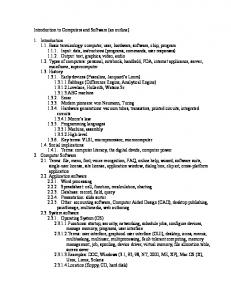
Fig. 1.1 Development of AES and XPS as monitored by publications per year. (Database Chemical Abstracts Service (CAS), with correction for AES used as an acronym for atomic emission spectrometry) (Courtesy of W. Marx, Max-Planck-Institute for Solid State Research, Stuttgart)
the Nobel Prize in physics in 1981 for his achievements in ESCA (see appraisal in Ref. [1.14]). The first commercial AES instruments for surface analysis of solids appeared by the end of the 1960s and triggered a similar development in XPS (Fig. 1.1). XPS (ESCA) became quickly popular within the large chemistry community. Furthermore, AES is more difficult to interpret and to quantify, and beam effects are more pronounced. Due to the relatively low signal-to-noise level of the firstgeneration spectrometers and the low excitation density of the X-ray source, XPS was a “slow” technique when compared to AES. This was a particular disadvantage in the time of analog instruments (the 1970s). With the development of digital instruments with multichannel detection and with higher analyzer transmission, the use of XPS in materials increased dramatically around 1985 at an accelerating pace, whereas that of AES appears to have attained a saturation already around 1995, as can be concluded from Fig. 1.1.
1.1.2 Auger Electron Spectroscopy (AES) Auger electron spectroscopy (AES) has its name from the French physicist Pierre Victor Auger (1899–1993) who first studied the respective phenomena [1.15], although there is some controversy about the possible contribution of Lise Meitner [1.16]. In 1923, while studying electron emission induced by X-ray excitation in a Wilson cloud chamber, Auger observed, besides photoelectrons, electrons emitted with constant energy independent of the X-ray energy. Further experiments and the correct theoretical explanation were summarized in 1926 in his doctoral thesis [1.15, 1.17]. For a long time, Auger electrons were considered only as a special topic in atomic physics and as an unwanted side effect in practical X-ray spectroscopy. In 1953, Lander first mentioned the possibility of performing surface analysis by determination of characteristic Auger electron peaks, which he observed
4
1 Introduction and Outline
in the secondary electron emission spectrum of electron-irradiated solids [1.18]. However, the intensity of those Auger peaks was too low to be used for practical analysis. This obstacle was overcome by the pioneering work of Harris in 1965 (published 1968 [1.19, 1.20]). Using a 127ı energy analyzer, Harris showed that the electronically differentiated energy distribution greatly enhances the signal-tonoise ratio of the Auger electron peaks. In 1967, Weber and Peria [1.21] recognized that the same techniques could be adopted for conventional LEED optics which was already in use in about a 100 laboratories working on surface research. This was the breakthrough of AES as a surface analytical tool and the onset of the rapid development of commercially available instruments. The next major step forward was the introduction of the cylindrical mirror analyzer by Palmberg, Bohn, and Tracy in 1969 [1.22]. This device increased the sensitivity toward the detection limit of typically 0.1% of an atomic monolayer. Further development in the lens system of the primary electron beam improved the lateral resolution, and by scanning the electron beam, Auger electron images of the surface became available. In 1970, MacDonald [1.23] showed the principal possibility of high spatial resolution and scanning AES, and in 1973, the first scanning Auger microprobe with 5-�m lateral resolution was on the market. Since that time, commercial instruments for practical surface analysis are of the scanning Auger microscopy (SAM) type (Sect. 2.3). By the end of the 1970s, better electron optics and the use of lanthanum hexaboride filaments improved the spatial resolution to about 50 nm. Introduction of Schottky field emitters about 10 years later finally led to spatial resolution values of about 3–10 nm that today are typical for instruments from the major manufacturers (JEOL, Kratos, Omicron, PHI, and Thermo Scientific). Along with the development of increased spatial resolution was that of more powerful energy analyzers with several detectors for parallel detection capability, and of digital data acquisition and completely computer-based spectrometer operation. Today, all this is standard equipment. Although the cylindrical mirror analyzer (CMA) has superior point transmission as compared to the concentric hemispheres analyzer (CHA) (see Sects. 2.5.1 and 2.5.2), the advantage of the latter with respect to higher energy resolution has favored its use in the majority of today’s instruments. Parallel with the development of powerful Auger spectrometers, the combination of AES with sputtering by ion bombardment revealed its capability for in-depth analysis of thin films, as proposed by Palmberg and Marcus in 1969 [1.24]. Since then, ion guns with rastered beam and differential pumping were introduced, to provide a flat sputter crater bottom and ease of operation, respectively (see Sect. 2.4). A major step forward in sputter depth profiling was the introduction of sample rotation during ion bombardment by Zalar in 1985 [1.25], in order to avoid sputtering-induced microroughening in polycrystalline materials (see Sect. 7.1.9). More recently, low-energy ion guns with high current densities even at 100 eV energy have become available (see Sect. 2.4) which strongly reduce the limitation of depth resolution by energy-dependent atomic mixing. The first commercial Auger electron spectrometers became available in 1969. This year marks the beginning of the application of Auger electron spectroscopy to surface and interface analysis of solids (Fig. 1.1), followed by a rapid development
1.2 Outline of Electron Spectroscopy
5
Fig. 1.2 Percentage of total publications referring to XPS (total of 122700) or AES (total of 27200) for the main topics in Table 1.1 (Courtesy of W. Marx and M. Noah, MPI Stuttgart)
of AES to one of the most popular and widespread method for surface analysis, particularly enhanced by the development of microelectronic industries. After 1985, XPS has become far more popular as a tool for materials research, as seen in Fig. 1.1. However, AES still has its appropriate applications, particularly when high spatial resolution is of advantage, as in surface and grain boundary segregation studies and in topics related to depth profiling, such as diffusion and interfacial reactions. This fact can be seen in Fig. 1.2, which shows the percentage of total publications referring to XPS or AES for different typical research fields. Although the interpretation of Fig. 1.2 is rather complicated, the relative comparison within XPS or AES gives an indication of the preferred research fields of each technique.
1.2 Outline of Electron Spectroscopy Chemical analysis of solid materials with electron spectroscopy is based on energy analysis of secondary electrons that are emitted as a result of excitation by photons, electrons, ions, or neutrals. Main features of the techniques are: 1. Detection of all elements except hydrogen and helium 2. Detection of chemical bonding states 3. Information depth in the nanometer region The reason for the surface specificity of electron spectroscopy is the small information depth of typically some nanometers (see Sect. 4.2.2) that is determined by the inelastic mean free path of electrons between typically 40 and 2500 eV.
6
1 Introduction and Outline
Fig. 1.3 Components of a typical AES or XPS instrument
The most important methods that are employed in commercial surface analytical instruments are X-ray-induced photoelectron spectroscopy (XPS), often used in replacement of the term “electron spectroscopy for chemical analysis” (ESCA), and Auger electron spectroscopy (AES). The basic components of a typical AES or XPS instrument are schematically shown in Fig. 1.3 and explained in more detail in Chap. 2. Common to both surface analysis methods is an ultrahigh vacuum (UHV)-based stainless steel chamber containing the sample stage, electron energy analyzer and detection system, an electron gun for AES, or an X-ray source (with or without monochromator) for XPS, and an ion gun for sample cleaning and for depth profiling. Frequently there are additional devices like a sample fracture stage (see Sects. 4.4.3 and 9.1.4), or an attached sample preparation chamber (see chap. 8, Fig. 8.1). Outside the UHV system are consoles with the electronics supply systems and the computer with the data acquisition and processing software. While qualitative analysis (Chap. 3) is fairly easy, for example, by comparison with tabulated electron level energies and handbook spectra, quantitative analysis (Chap. 4) is more complicated. Peak area analysis in XPS (see Sect. 4.1.1) is generally more accurate than Auger peak-to-peak height in AES (Sect. 4.1.2). Relative elemental sensitivity factors have to be transformed into relative matrix sensitivity factors by matrix correction factors to improve the accuracy of quantitative analysis (Sects. 4.3.2 and 4.4.2). The latter can only be performed with reliability by taking into account the in-depth distribution of composition (Chap. 7), as exemplified in atomic monolayer structures within the information depth (Sects. 4.3.3 and 4.4.3). Optimization of measured signal intensities with respect to incidence and emission angles and surface roughness (Chap. 5) is often necessary to obtain an optimum signal-to-noise ratio (Chap. 6) that determines detection limit and uncertainty. In practical surface and interface analysis (Chap. 8), sample properties, sample preparation, and artifacts caused by various beam effects determine the analytical strategy. Some typical applications (Chap. 9) illustrate the main topics in AES and XPS analysis (Table 1.1). Finally, an outlook on related techniques is presented in Chap. 10. AES and XPS are comparable in their surface sensitivity because the small attenuation length of the Auger- and photoelectrons generally restricts the chemical information to the first few atomic layers. Therefore, both techniques are principally
1.2 Outline of Electron Spectroscopy
7
not appropriate for bulk analysis. If surface contamination layers are carefully removed, for example, by argon ion sputtering, the composition of the sample surface may deviate from the bulk composition due to segregation or preferential sputtering effects (see Sect. 7.1). Since the surface of a sample is steadily reacting with the ambient gas atmosphere, constancy of the surface composition with time may hardly be achieved. To reduce this effect, AES and XPS are generally performed in a vacuum chamber at residual gas pressure of reactive gases below 10�7 Pa.� 10�9 Torr/ (see Sect. 2.1). A gas admission facility for noble gases, usually argon, and an ion gun are necessary for surface cleaning (see Sect. 8.3) and for in-depth profiling (see Sect. 7.1). Furthermore, a residual gas analyzer is useful for deciding whether a detected component originates from adsorption or from the bulk of a sample.
1.2.1 Outline of X-Ray Photoelectron Spectroscopy (XPS) In XPS, the surface of a sample is irradiated with photons of characteristic energy (usually MgK’ radiation) (Fig. 1.2) (Sect. 3.2). These photons directly interact with core electrons of the sample atoms. As a result, ionized states are created, and a photoelectron is emitted with a kinetic energy given approximately by the difference between the photon energy and the binding energy. The measured photoelectron spectrum is therefore a direct indication of the binding energies of the different atomic electron levels and is often directly calibrated in eV of binding energy: The lower the kinetic energy, the higher the binding energy (see Sect. 3.2.1). Because usually the kinetic energy is plotted on the x-axis with increasing energy to the right, the binding energy increases from right to left. The inelastic mean free path of the photoelectrons [1.26, 1.27] is determined by the probability to suffer an energy loss, and the attenuation length (taking into account inelastic and elastic scattering) [1.28] is determined by the probability to be received by the electron energy analyzer (see Sect. 4.2.2). In both cases, kinetic energy and matrix determine and limit the information depth to the nanometer region. Like AES, this fact makes XPS analysis surface specific. In contrast to AES, there are no primary electrons; therefore, the background is usually much smaller, and peaks are readily measured in the direct spectrum.
1.2.2 Outline of Auger Electron Spectroscopy (AES) In a typical AES experiment, the sample is irradiated with a focused beam of primary electrons of sufficiently high energy (l–20 keV) from the electron gun. The primary electrons penetrate the sample up to a range of the order of 0:1–1 �m, depending on their energy. As a result, different electron orbitals of the target atoms are ionized within the excitation depth, and subsequently, electrons from other shells
8
1 Introduction and Outline
can fill up the ionized states. The energy released by this process either results in a photon (X-ray emission) or is transmitted to another electron in an outer level that is emitted from the atom as a so-called Auger electron. Auger electrons possess characteristic energies which are well defined by the involved electron levels of the analyzed element. This characteristic energy can only be detected if the electrons emitted by each excited atom leave the surface without inelastic scattering in the solid. Their inelastic mean free path [1.26, 1.27] or more precisely their attenuation length (including inelastic and elastic scattering) [1.28] is strongly dependent on the Auger electron energy and typically is between 0.3 and 3 nm [1.26–1.28]. For the same kinetic energy, the attenuation lengths of AES and XPS are practically equal, and the surface specificity of both techniques is a direct result of its small value, corresponding to an information depth of a few monolayers from the surface (see Sect. 4.2.2). Auger electrons are superimposed on a large and smoothly varying background consisting of inelastically scattered primary and secondary electrons. Because of this fact, Auger spectra are usually presented in the differentiated mode. The detected energies of the main Auger peaks (conventionally of the negative peak extension in the derivative mode) are usually given as Auger energies (see Sect. 3.3.3). The newer literature generally refers to the peak maximum in the normal, direct mode. Depending on the peak width, the peak energy is about 2–5 eV lower than the derivative’s maximum negative extension (see Sect. 3.3.3). The area under the peak in the normal spectrum, after background removal, is approximately proportional to the number of atoms in a volume given by the primary beam diameter and the information depth (see Sect. 4.4.2). This is also valid for the Auger peak-to-peak height in the differentiated spectra, if the Auger peak shape is constant with varying Auger intensity (see Sect. 4.1.2).
1.3 State of the Art and Future Development High-resolution scanning Auger spectrometers are characterized by field-emission electron gun for spatial resolution around 10 nm at 10 nA beam current, with energy analyzers of cylindrical mirror or concentric hemispheres type with parallel detection of a certain energy range. The capability of the latter with respect to higher energy resolution seems to favor the concentric hemispheres analyzer in present and future instruments. Among a large number of other surface analysis methods (Chap. 10), AES and XPS have become most important because of their diverse application possibilities and highly developed commercial instruments. Already about 20 years ago, the number of AES and XPS instruments worldwide was estimated to be about 1500 [1.2]. XPS is more popular in chemistry and chemical applications, whereas the foremost feature of AES is its highly focused electron beam that allows spatially resolved investigations similar to scanning electron microscopy and is therefore
References
9
often called scanning Auger microscopy (SAM) [1.23, 2.14]. Field-emission-gunequipped SAM instruments achieve a spatial resolution of typically 10 nm. A new instrument using the ZEISS Gemini Electron gun achieves an ultimate spatial resolution of 5 nm (Omicron NanoSAM), and 3 nm will be probably achieved in the near future. High spatial resolution too is the main feature of modern XPS equipment. As a consequence, imaging XPS and XPS microscopy are available with typical spatial resolution of 3–15 �m, and new developed instruments attain 150-nm spatial resolution (see Fig. 2.17). The detectors are channel plates or multichanneltron detectors to ensure partial parallel detection of a spectrum. An interesting instrument design covers the angular emission between 20ı and 80ı by a special entrance lens system and angle-resolved detection, that is, it operates intrinsically as angleresolved XPS (Thermo Scientific). For both AES and XPS instruments, the hardware seems to be in a fairly mature state, although some development will go on considering improved lateral resolution. Future development seems to be mainly focused on software, particularly with respect to computerized routines for fast data acquisition and processing, sample drift compensation, and toward fully automated operation through expert systems [1.29, 1.30].
References 1.1. E.D. Hondros, M.P. Seah, S. Hofmann, P. Lejˇcek, Interfacial and Surface Microchemistry, in Physical Metallurgy, 4th edn., ed. by R.W. Cahn, P. Haasen (Elsevier, Amsterdam, 1996), pp. 1201–1289 1.2. D. Briggs, M.P. Seah (eds.), Practical Surface Analysis Vol. 1 (AES and XPS), 2nd edn. (Wiley, Chichester, 1990) 1.3. H. Hertz, Ann. Phys. U. Chem. (Wied. Ann.) 31, 421 (1887) 1.4. W. Hallwachs, Ann. Phys. 33, 301 (1888) 1.5. P. Lenard, M. Wolf, Ann. Phys. U. Chem. 37, 443 (1889) 1.6. P. Lenard, Ann. Phys. 8, 149 (1902) 1.7. A. Einstein, Ann. Phys. 17, 132 (1905) 1.8. E. Rutherford, Philos. Mag. 28, 305 (1914) 1.9. E. Rutherford, H. Robinson, W.F. Rawlinson, Philos. Mag. 18, 281 (1914) 1.10. H.R. Robinson, Proc. R. Soc. A 104, 455 (1923) 1.11. H.R. Robinson, C.R. Young, Philos. Mag. 10, 71 (1930) 1.12. R.G. Steinhardt, E.J. Serfass, Anal. Chem. 23, 1585 (1951) 1.13. K. Siegbahn, C.N. Nordling, A. Fahlman, R. Nordberg, K. Hamrin, J. Hedman, G. Johansson, T. Bermark, S.E. Karlsson, ESCA: Atomic, Molecular and Solid State Structure Studied by Means of Electron Spectroscopy (Almqvist & Wiksells, Uppsala, 1967) 1.14. L. K¨ov´er, Surf. Interface Anal. 39, 958 (2007) 1.15. P. Auger, Ann. Phys. (Paris) 6, 183 (1926) 1.16. O.H. Duparc, Int J. Materials Research 100, 1162 (2009) 1.17. P. Auger, Surf. Sci. 48, l (1975) 1.18. J.J. Lander, Phys. Rev. 91, 1382 (1953) 1.19. L.A. Harris, J. Appl. Phys. 39, 1419 (1968) 1.20. L.A. Harris, J. Appl. Phys. 39, 1428 (1968)
10 1.21. 1.22. 1.23. 1.24. 1.25. 1.26. 1.27. 1.28. 1.29. 1.30.
1 Introduction and Outline R.E. Weber, W.T. Peria, J. Appl. Phys. 38, 4355 (1967) P.W. Palmberg, G.K. Bohn, J.C. Tracy, Appl. Phys. Lett. 15, 254 (1969) N. MacDonald, Appl. Phys. Lett. 16, 76 (1970) P.W. Palmberg, H.L. Marcus, Trans. Am. Soc. Met. 62, 1016 (1969) A. Zalar, Thin Solid Films 124, 223 (1985) C.J. Powell, Surf. Sci. 49, 29 (1974) M.P. Seah, W.A. Dench, Surf. Interface Anal. 1, 2 (1979) A. Jablonski, C.J. Powell, Surf. Sci. Rep. 47, 33 (2003) J.E. Castle, Surf. Interface Anal. 33, 196 (2002) M. Mohai, Surf. Interface Anal. 38, 640 (2006)
http://www.springer.com/978-3-642-27380-3