Secondary Organic Aerosol Formation from the Photooxidation of Naphthalene Shouming Zhou and John Wenger
Department of Chemistry and Environmental Research Institute, University College Cork, Cork, Ireland
[email protected];
[email protected]
Introduction
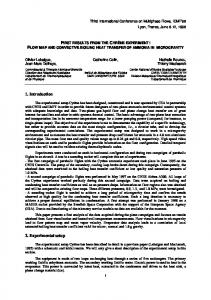
Experimental Setup All of the experiments were performed in a 6500 litre FEP Teflon chamber (Figure 1) at atmospheric pressure and temperature. The reactor is equipped with 12 Philips TL05 (40 W) visible lamps (λmax=360 nm) and 12 Philips TL12 (40 W) UV lamps (λmax=310 nm) as photolysis sources.
Polycyclic aromatic hydrocarbons (PAHs) are ubiquitous air pollutants that are released into the atmosphere as a by-product of combustion processes. The gas-phase PAHs can be chemically transformed in the lower troposphere via reaction with the hydroxyl (OH) radical to produce a range of oxidised organic compounds and other pollutants such as ozone and secondary organic aerosol (SOA). Epidemiological studies have established that exposure to this type of air pollution is associated with damaging effects on the respiratory and cardiovascular systems, and can lead to asthma, oxidative stress, health deterioration and even death (1).
The temperature, relative humidity and the water concentration were measured using a dewpoint meter (Vaisala DM70). Naphthalene was introduced through a heated impinger and its concentrations were monitored by a gas chromatography (GC Varian 3800) and a flame ionization detector (FID).
Despite their importance, relatively little is known about the atmospheric chemistry of the PAHs, mainly because of the variety and complexity of the reaction products. Indeed, although the atmospheric degradation of naphthalene, the simplest PAH, has been investigated on several occasions (2), the reported product yields are not in agreement and, on average, only around 50% of the reacted naphthalene is accounted for. Furthermore, the atmospheric degradation of naphthalene and other gas-phase PAHs is known to produce SOA, but the yield and chemical composition of the aerosol has not been determined. Therefore, the investigations into the atmospheric degradation of gas-phase PAHs are necessary.
(a)
NO, NO2 and hence NOx concentrations were measured with a chemiluminescence NOx analyzer (Thermo Model 42i). Ozone concentration was measured with a UV photometric O3 analyzer (Thermo Model 49i).
(b)
Figure 1. (a) Experimental setup for the 6500 litre FEP Teflon chamber; (b) inner view of the reactor
The formation and evolution of particles in the range 10470 nm was monitored using a scanning mobility particle sizer (SMPS, TSI Model 3034).
Results and Discussion Table 1 Experimental Conditions and Results
Effect of NOx level on SOA yields:
Expt. No.
RH (%)
Naphthalene (ppb)
NOx (ppb)
HC0/NOx (ppb/ppb)
ΔHC (μg/m3)
M0 (μg/m3)
SOA yield (%)
30/01/08
0.2
1070
520
1.95
2198
285.5
13.0
31/01/08
0.6
1040
240
4.35
1797
330
18.4
05/02/08
0.8
1084
250
4.34
2202
380
17.3
09/02/08
0.7
1081
510
2.13
2135
237.3
11.1
12/02/08
0.8
830
690
1.20
1317
136
10.3
01/05/08
0.8
602
145
4.15
1470
248.5
16.9
06/05/08
1.9
508
500
1.02
954
63.4
6.64
09/05/08
1.3
611
202
3.02
1444
230.9
16.0
12/05/08
25
585
470
1.24
1022
118.6
11.6
13/05/08
25
593
540
1.01
926
103.8
11.2
15/05/08
25
532
520
1.02
1055
97.3
9.23
19/05/08
25
611
344
1.78
1408
229.4
15.5
20/05/08
25
626
517
1.21
1168
155
13.3
21/05/08
25
699
556
1.26
1745
271.3
15.5
22/05/08
50
629
590
1.07
1276
218.5
17.1
23/05/08
50
514
496
1.04
1064
159.4
15.0
26/05/08
50
602
370
1.63
1293
206.9
16.0
27/05/08
50
705
410
1.72
1611
302.4
18.8
Table 1 summarizes the experiments on photooxidation of naphthalene. The SOA formation yield, Y, is defined as the fraction of the reactant, i.e. naphthalene, which is converted into aerosol. It is clear from experiments 30/01/08 to 09/05/08 of Table 1 that under dry conditions (RH < 2%) experiments with higher HC0/NOx ratios led to higher SOA mass yields. Such an HC0/NOx ratio dependent SOA yields were also observed in monocyclic aromatics (3-5), that was attributed to peroxide radicals/NOx chemistry. Figure 2 shows a typical time-concentration profile for the photooxidation of naphthalene from the experiment 05/02/08. It is clear from Figure 2 that the SOA nucleation started while the NO concentration was as high as around 200 ppb. This would suggest that unlike photooxidation of monocyclic aromatics, where the SOA nucleation was observed only when the NO was nearly completely decayed (3-5), the primary gas phase products from the photooxidation of naphthalene may be partitioning into the particle phase. Effect of relative humidity on SOA yields: Figure 3 gives the yield curves of the experiments by assuming single product partitioning into the aerosol phase. It is clear from Figure 3 that the data points fall into four categories. By fitting the data points to gas-particle partitioning model proposed by and Odum et al. (6), the yield parameters of αi and Ki values are listed in Table 2. It is clear that the SOA yields are higher with the higher relative humidity, the maximum SOA yields increases by a factor of 1.5 over the relative humidity of 0-50%, which is attributed to the formation of higher concentrations of HONO.
Table 2 Aerosol Yield Parameters and Steady State OH Radical Concentrations α
K
OH conc. (106 cm-3)
RH=0, HC0/NOx=1.0 ~ 2.2
0.1636
0.0113
2.1 ~ 2.4
RH=0, HC0/NOx=3.0 ~ 4.4
0.2198
0.0125
2.2 ~ 2.8
RH=25%, HC0/NOx=1.0 ~ 1.8
0.2324
0.0081
2.2 ~ 2.7
RH=50%, HC0/NOx=1.0 ~ 1.8
0.2548
0.0095
3.0 ~ 3.2
Data Group
Figure 2. Typical time-concentration profile for the phooxidation of naphthalene (Expt. 05/02/08)
A trend of the higher SOA mass yields with higher OH radicals present in the reaction chamber becomes clear (Table 2) Literature
Conclusion: NOx level and relative humidity dependent SOA yields were observed in the photooxidation of naphthalene. The former could be explained by the peroxide radicals/NOx chemistry; the latter was attributed to the formation of HONO at higher water concentrations.
αi Ki Y M0 i 1 1 M0 Ki n
By fitting the experimental data to Odum’s partitioning model the maximum SOA mass yields (α values) found to correlate with the concentrations of OH radicals present in the reaction chamber. In addition to OH radicals the role of the HO2 radical in the SOA formation from the photooxidation of naphthalene is unclear. Future Work: Identify and quantify the major gas and particle-phase degradation products from the photooxidation of napthalene; Study the photooxidation of other PAHs (acenaphthene, acenaphylene and phenanthrene);
Investigate the toxicological effects of the SOA produced from PAHs
Figure 3. Yield curve for photooxidation of naphthalene experiments
1. Dockery, D.W., Pope, C.A., Xu, X., Spengler, J.D.,Ware, J.H., Fay, M.E., Ferris, B.G., Speizer, F.E. N. Engl. J. Med. 1993, 329, 1753. 2. Calvert J.G., Atkinson R., Becker K.H., Kamens R.M., Seinfeld J.H., Wallington T.J. and Yarwood G. The Mechanisms of Atmospheric Oxidation of Aromatic Hydrocarbons, Oxford University Press, Oxford, 2000. 3. Cocker, D. R.; Mader, B. T.; Kalberer, M.; Flagan, R. C.; Seinfeld, J. H. Atmos. Environ. 2001, 35, 6073. 4. Ng, N. L.; Kroll, J. H.; Chan, A. W. H.; Chhabra, P.; Flagan, R. C.; Seinfeld, J. H. Atmos. Chem. Phys. 2007, 7, 3909. 5. Song, C.; Na, K.; Warren, B.; Malloy, Q.; Cocker, D. R. Environ. Sci. Technol. 2007, 41, 7403. 6. Odum J. R.; Hoffmann, T.; Bowman, F.; Collins, D.; Flagan, R.C.; Seinfeld, J. H. Environ. Sci. Technol. 1996, 30, 2580. Acknowledgement Financial support of this work by the Irish Environmental Protection Agency within the STRIVE Programme 20072013 is gratefully acknowledged.