poorly constructed arguments, misinterpretation and application of the law, ..... The table lists case numbers that were considered to be similar to the target case.
Investigating Graphs in Textual Case-Based Reasoning* C. M. Cunningham, R. Weber, J. M. Proctor, C. Fowler, M. Murphy College of Information Science & Technology, Drexel University, Philadelphia, PA 19104 {cmc38, rw37, jp338, clf29, mpm37}@drexel.edu
Abstract. Textual case-based reasoning (TCBR) provides the ability to reason with domain-specific knowledge when experiences exist in text. Ideally, we would like to find an inexpensive way to automatically, efficiently, and accurately represent textual documents as cases. One of the challenges, however, is that current automated methods that manipulate text are not always useful because they are either expensive (based on natural language processing) or they do not take into account word order and negation (based on statistics) when interpreting textual sources. Recently, Schenker et al. [1] introduced an algorithm to convert textual documents into graphs that conserves and conveys the order and structure of the source text in the graph representation. Unfortunately, the resulting graphs cannot be used as cases because they do not take domain knowledge into consideration. Thus, the goal of this study is to investigate the potential benefit, if any, of this new algorithm to TCBR. For this purpose, we conducted an experiment to evaluate variations of the algorithm for TCBR. We discuss the potential contribution of this algorithm to existing TCBR approaches.
1
Introduction
Textual case-based reasoning (TCBR) extracts cases from textual documents whenever knowledge is contained in texts. There are extremely critical tasks and domains where tasks could be automated if text presented recognizable patterns and clear structure. Some examples of relevant domains include help desks [2], customer support [3], intelligent tutoring [4] and law [5]. In the legal domain alone, reasoning from text provides the ability to, for example: predict the outcome of legal cases [6]; construct legal argumentation [7][8], perform jurisprudence research [9], interpret and apply the facts of one case to a new case [8][10], and sentencing [11][12]. In fact, finding legal precedents is central to how the legal system in the US operates. Given the potential issues with acting upon incomplete information (e.g. poorly constructed arguments, misinterpretation and application of the law, erroneous decisions), it would be desirable if the methods used for jurisprudence research had high recall and precision. Recall is the ratio of useful documents that are retrieved to the total number of useful documents that exist [13]. Precision is a ratio of the number of useful documents that are retrieved to the total number of documents that are retrieved [13]. The most widely used technique for finding similar documents is Information Retrieval (IR), which is based on term frequency and measured in terms of recall and precision. IR in the legal domain is not adequate because term
*In Funk, Peter; González Calero, Pedro A. (Eds.), Advanced in Case-Based Reasoning (Lecture Notes in Artificial Intelligence , Vol. 3155): Springer-Verlag.
frequencies do not take into account domain-specific knowledge, therefore they only recall approximately 25% of relevant documents [14]. Unlike either IR or clustering methods [15], case-based reasoning (CBR) replicates reasoning by analogy to retrieve relevant cases based upon domain-specific knowledge [2][16]. CBR determines similarities between a current event and a past event similar to the manner in which people reason by using analogies. Furthermore, when using domain-specific knowledge to retrieve useful cases, one would expect that recall and precision would improve [9]. One of the challenges in TCBR, however, is finding an automated method to manipulate textual knowledge that takes into consideration order and negation [17] when interpreting the text. Interestingly, recent developments in Graph Theory relate to text representation [1]. Graphs are mathematical representations that consist of vertexes (nodes) and edges (arcs), which offer a number of advantages over traditional feature vector approaches [18] - the most significant is the ability to create rich representations of cases [19]. Furthermore, unlike vector representations, the structure and word order of the original document can be retained. By definition, graph structures apply to representations that capture relationships between any two elements, as well as allowing an unlimited number of elements to be added or deleted at will [20]. This flexibility of the representation allows CBR cases to capture previously unforeseen information without the need to reconfigure the case base. When the graphs are unlabeled or their labels are not fixed, the only applicable similarity methods are ones that search for identical subgraphs. This is the wellknown subgraph isomorphism problem, which is NP-complete [21]. For this reason and for the nature of CBR similarity, we target case graphs that have fixed labels. This search is polynomial [1]. Additionally, because the fixed labels embed meaning, the similarity assessment is domain-specific. Although being polynomial, graph representations do have a significant computational cost. Fortunately, there are a number of methods and techniques aimed at reducing this problem [18]. There are promising developments in Graph Theory related not only to reduced complexity but also to text representation. In Schenker et al. [1], the authors proposed an algorithm to automatically convert textual documents (i.e. web pages) into graphs. Additionally, they have also demonstrated how to cluster the resulting graphs by using a variation of the k-means algorithm and by using the maximum common subgraph to measure similarity [22]. Given the successful use of graphs to represent web documents [1], the purpose of this paper is to examine the benefits of the algorithm presented in [1] for representing textual documents as case graphs in TCBR. Section 2 presents two algorithms to convert textual documents: the one proposed by Schenker et al. [1], to convert textual documents into graphs, henceforth referred to as Text-to-Graph (TtG); and our proposed variant that converts textual documents into case graphs, henceforth referred to as Text-to-Case-Graph (TtCG). Section 3 presents the experimental study we conducted to compare these algorithms with a feature vector CBR prototype and a human expert. We then discuss the potential impact of our findings on related work in Section 4. Finally, the conclusion and potential future work are presented in Section 5.
2
Graphs in Textual Case-Based Reasoning
Graphs are data structures that allow the easy implementation of algorithms. Therefore, it would be desirable to have textual content represented in graphs. The challenge is to determine a method for the conversion that preserves meaning while keeping graphs at a manageable size. If the goal is to compare graphs by searching for isomorphic subgraphs, this search is NP-complete. However, if the purpose is to assess distance by comparing graphs with fixed labels, then this search is polynomial [1]. In this section, we present the original algorithm presented in [1], TtG; and our proposed variant, TtCG, that represents a first attempt to convert textual documents into case graphs.
2.1
From Textual Documents to Graphs
In Schenker et al. [1], the authors introduced an algorithm to automatically convert textual web documents into graphs, Text-to-Graph (TtG). In the TtG approach, the unique words (excluding stop words) that appear in the web document are mapped to vertexes on the graph. Each vertex is then labeled with the unique word that it represents. The directed edges on the graph are drawn from the vertex that represents one word to the vertex that represented the word that immediately follows the first word. The edges are then labeled with the structural section in which the two words appeared. The TtG approach has several implied benefits to textual case-based reasoning. First, the structure and word order of the original document would be retained. Additionally, the TtG approach would reduce the amount of time required by knowledge engineers to encode representation of the textual sources. Although the TtG approach does retain the word order and structure of the original text, it does not take into account negation. Furthermore, according to Aha [23], CBR is richer when it considers the relative importance of features; however, the TtG approach neither identifies features nor their relative importance. The creators of TtG [1] used a clustering algorithm to group similar textual documents together. It does not indicate the commonalities between the documents within a cluster. The ability to identify features and their relevance on a graph would mean that textual sources could automatically be converted to cases for CBR without the added expense of the time that it would take a knowledge engineer to manually represent a text as a case.
2.2
From Textual Documents to Case Graphs
We propose a variant of the TtG, which aims at converting textual documents into case graphs. Case graphs are representation formalisms that use graphs to represent situated experiences. Given that the essence of case-based reasoning is similarity, case graphs must be amenable to have their similarity assessed against other case graphs in conformity with the CBR hypotheses. Therefore, similarity is not a domain independent process, but one whose main goal is to replicate domain-specific similarity. For these reasons, our first attempt to create an algorithm to create case graphs from unrestricted data makes use of a list of potential domain-dependent
indexes, which we call signifiers. Signifiers can be single words or expressions that we can guarantee play a role in the description of the situated experience. In cases that describe personal injury claims, for example, the occurrence of the term chiropractor is a predictive index. Consequently, our algorithm differs from the one introduced in Schenker et al. [1] in that it preserves the signifiers independent of the level of their occurrence in the source text. The use of the signifiers allows for the use of traditional graph distance techniques to be used for case-based reasoning. Without the signifiers, we could not use graph distance techniques because they are not suitable to replicate similarity assessment.
2.3
Graph Distance Algorithms
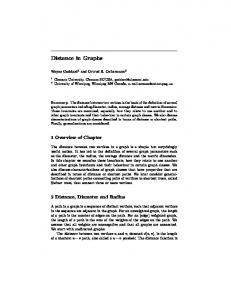
Several graph distance techniques rely on finding the maximum common subgraph (MCS) [22]. The maximum common subgraph of two graphs is the set of all linked nodes that the two have in common.
Figure 1. MCS example
In Figure 1, the nodes of the graphs are labeled A, B, C, etc.; these would be words in the graph representation of a document. The arrows indicate word order in the original text. For instance, the document represented by graph G1 in the figure has at least two occurrences of word A, one of which is followed by word C and the other by word E. Note that words B and D appear in both graphs, but they are connected differently, so are not part of the MCS. Collectively, distance techniques that use MCS are called MCS-based techniques. In [22], the authors also refer to one particular distance formula as MCS. In order to distinguish MCS-based techniques from this formula, we refer to the formula as BLG (Bunke Largest Graph). We use BLG [25] and WGU [26], which require finding the maximum common subgraph. BLG distance is determined by dividing the size (number of vertexes plus number of edges, denoted by |…| in the equations below) of the maximum common subgraph by the size of the larger of the two graphs being compared, and then subtracting the quotient from 1 as shown in Equation 1.
d BLG (G1 , G 2 ) = 1 −
mcs(G1 , G 2 ) max( G 1 , G 2 )
(1)
Unlike the BLG distance, WGU (Wallis Graph Union) distance is not sensitive to graphs of disparate sizes. The WGU distance is determined by dividing the size of the maximum common subgraph by the sum of the sizes of the two graphs being considered minus the size of the MCS (so those nodes are not counted twice), and then subtracting the quotient from 1, as shown in Equation 2.
d WGU (G 1 , G 2 ) = 1 −
mcs(G 1 , G 2 )
(2)
G 1 + G 2 − mcs(G1 , G 2 )
The range for both the BLG and WGU distances is from 0.0 (identical) to 1.0 (MCS is null – the graphs have no nodes in common). For example, referring to the graphs in Figure 1 above, |G1| = 5 vertexes + 6 edges = 11; similarly, |G2| = 12, and |mcs(G1, G2)| = 6. The BLG distance between G1 and G2 = 1 - (6/12) = 0.5, but the WGU distance is 1 - (6/17) = 0.647.
3
Experimental Study Table 1. Summary of approaches used in the experiment
Source Text
Domain Expert (DE) Claim summary documents
Representation Method
DE
Representation Formalism
Mind of DE
Similarity Assessment
DE judgment
Feature Vector CBR Claim summary documents DE chose features and identified their values Feature vectors Inferred and weighted nearest neighbor
TtG
TtCG
Claim summary documents
Claim summary documents
TtG algorithm to automatically convert texts into graphs
TtCG algorithm to automatically convert texts into graphs
Graphs
Graphs
MCS-based distance algorithms
MCS-based distance algorithms
Our hypothesis is that using an algorithm to convert textual documents into graphs is beneficial to textual case-based reasoning. We tested our hypothesis using precision and recall for four different approaches to manipulate text and retrieve relevant documents: domain expert, feature vector CBR, the TtG algorithm and the TtCG approach. The domain expert’s assessment was the baseline for the analysis. This section describes the methods that were used to manipulate and represent the textual documents as well as the techniques that were used to assess the similarity between documents; the dataset; and how our chosen metrics, precision and recall, were computed. Subsections 3.6 and 3.7 present the results and the discussion, respectively. Table 1 summarizes the methodologies.
3.1
Domain Expert Method
Text Manipulation/Representation. The domain expert was asked to read a collection of claim summary documents in order to identify the similar documents in the collection. In this case, there was not a formal representation of the documents. Similarity Assessment. Based upon experience, the domain expert manually assessed the similarity between the claim summary documents. This method represents the baseline for subsequent analysis.
3.2
Feature Vector CBR Table 2. Feature values in case 1
Question Was the incident reported? How soon was the incident reported? How old is plaintiff? How many personnel injury lawsuits has the plaintiff filed before this complaint? Was the plaintiff employed on the day of the incident? Does the plaintiff have a criminal history that includes crimes of falsehood? Did plaintiff have surgery as a result of the (alleged) incident? How much did the plaintiff spend on medical bills? Does the plaintiff have pre-existing injuries in the same area as alleged in the current lawsuit? Is there a loss of consortium or per quod claim? Was plaintiff treated exclusively by a chiropractor? Is there a permanent loss claim? Is the injury claimed soft-tissue in nature? What is the plaintiff's annual income? How many days of work did the plaintiff miss due to the incident? Are there fact witnesses (other than plaintiff)? Case number Case file
Values yes same day 76 0 no no no 4595 yes yes no no yes not available not available yes 1 case1
Text Manipulation/Representation. The domain expert reviewed the claim summary documents in order to identify the features that should be used to build the case base. Knowledge engineers then used the features that the expert identified in order to represent the documents as cases within the case base. An example of the identified features and their values for case 1 is shown in Table 2. Additionally, the knowledge engineers worked very closely with the domain expert in order to assign weights to each feature in order to capture the relative importance of each feature. This was a very challenging effort. Similarity Assessment. For the feature vector CBR, the similarity step was designed in a trial-and-error effort. We started by using the feedback feature weighting algorithm gradient descent, but the individual similarities between different values changed based on a variety of reasons. For example, a permanent injury is a
predictive index only when the plaintiff is below a certain age. Consequently, we had to use a number of rules to assign weights whenever conditions changed, and we were limited by the shell we used.
3.3
Textual Documents to Graphs
Text Manipulation/Representation. The TtG method was used to convert the claim summary documents into graphs. It was not possible to use the algorithm in its exact original form because the claim summary documents did not consistently have three structural sections that were common across all documents. We modified the TtG method of representing textual documents as graphs for the claim summary documents by defining two sections—titles and text—instead of TtG’s three (titles, text, and hypertext links), but kept other steps as similar as possible (see Section 2). Stop words were culled from the document, then the remaining ordered list of words was stemmed using Porter’s algorithm [24]. Each unique term in the resulting list was added as a vertex in the graph representation, with its occurrence count as an attribute of the vertex. Directed edges were created between the vertexes representing words that were adjacent in the document, where adjacency crosses stop words but not numerals or breaking punctuation (period, question mark, exclamation point, colon, semicolon, parentheses, brackets, and single and double quotation marks). The edges were labeled with the section (title or text) in which the adjacent vertexes appeared. As with the vertexes, the count of adjacent occurrences was an attribute. Finally, the graphs were pruned to only include vertexes which occurred with a minimum frequency (specified at run-time). Similarity Assessment. We used the techniques described in Subsection 2.3 to compute the distance between the resulting graphs.
3.4
Textual Documents to Case Graphs
Text Manipulation/Representation. As a further test of the potential benefit of a graph-based representation to TCBR, we modified the TtG method above to enhance the graphs using some domain knowledge. Based on the feature list provided by the expert, we identified ten signifier words, which represent expressions that are meaningful in the domain and thus may indicate the similarity between documents. These signifier words were never removed from the graph regardless of the frequency with which they actually occurred in the document. Dates and other numbers (usually monetary values) were also considered important to the expert, so we included monthnames in the list of feature signifiers, and modified the methods that prepare the word list not to exclude numbers. This TtCG method was a first step towards adapting the graph-based work to textual CBR. We have introduced one aspect only as a preliminary amendment. Further adjustments remain for future work. Similarity Assessment. The methods for the similarity assessment for the TtCG approach were identical to the methods used with the TtG approach. It should be noted, however, that unlike the case for the TtG representation, the features were also
taken into consideration when computing the maximum common subgraph for the TtCG representation.
3.5
Precision and Recall
The precision was computed by dividing the number of useful (i.e. relevant) documents by the total number of documents that were retrieved. We did not, therefore, explore the ordering of the retrieved documents. The recall was computed by dividing the number of useful documents by the total number of relevant documents in the collection. The average precision and average recall were then computed by taking the averages of individual precision and recall values. It should be noted that the precision and recall for cases 9, 10 and 23 were not included when computing the averages because the domain expert stated that there were no similar documents in the collection for those specific cases.
3.6
Dataset
The data consisted of twenty-six claim summary documents from a law firm handling insurance cases. Insurance companies create these documents for insurance claims where there are legal questions or where the claimant has retained legal counsel. Cases are usually loosely related because law firms tend to specialize in the types of cases they handle. However, we do not know about the specifics of the dataset except for what the methods used in the study revealed. The number of words range from 942 (case 27) to 9192 (case 17) with a mean of 3886.8, a median of 3898 (interpolated), and a standard deviation of 2151.8. Cases are numbered consecutively except for 8 and 19, which were missing. Finally, we used the same dataset for each of the methodologies discussed in the previous subsection.
3.7
Results
With respect to our hypothesis, our preliminary finding is that the use of an algorithm to convert textual documents into graphs is potentially beneficial to textual case-based reasoning. Table 3 shows the resulting precision and recall for the different approaches in our study. When comparing the different methods in our study to the baseline, we concluded that the TtG method alone can reach levels comparable to the alternative approaches tested. Besides, the performance of the TtCG method suggests that graph-based approaches can be tailored to domain specific tasks, potentially becoming significant to TCBR. Table 3. Average observed precision and recall DE
Feature Vector CBR
TtG
TtCG
BLG
WGU
BLG
WGU
Precision
100%
16.3%
21.1%
21.4%
21.6%
21.6%
Recall
100%
33.3%
42.0%
44.2%
42.8%
46.7%
For reference, we compared the precision and recall values in Table 3 with the average values that could be obtained by random selection of the same number of similar documents for each cell in Table 5. These average probability values for precision and recall are presented in Table 4. Table 4. Average probabilities for precision and recall DE
Feature Vector CBR
TtG
TtCG
BLG
WGU
BLG
WGU
Precision
n/a
.082
.089
.08.9
.08.9
.08.9
Recall
n/a
.237
.136
.130
.148
.153
The generally low values are an indication of the sparseness of the original dataset. On average, the domain expert selected 2.2 claim summary documents as being similar to any given document. When the observed values in Table 3 are compared with the random probabilities in Table 4 using paired-samples t tests, the scores for the feature vector CBR are not statistically different at p < 0.05, but the scores for all graph methods are. This disparity is primarily because the feature vector CBR selected more similar documents than the graph methods - its baseline probabilities indicated higher recall and lower precision than the graph methods. 0.45 0.4
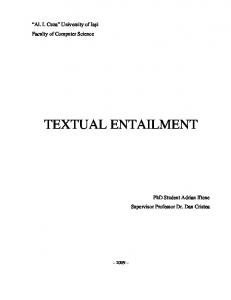
Recall
0.35 0.3 0.25 0.2 0.15 0.1 0.05 0 Feature TtG: BLG TtG: W GU TtCG: BLG Vector CBR Figure 2: Average recall obtained by the methods
TtCG: W GU
For the TtG method, the BLG and WGU distance methods produced very similar results; for N=235 pairs, Pearson’s r=0.967, p