Bioinformatics Advance Access published February 19, 2013
Application note
IRootLab: a free and open-source MATLAB toolbox for vibrational biospectroscopy data analysis a
Júlio Trevisana,b,*, Plamen P. Angelova,b, Andrew D. Scottc, Paul L. Carmichaelc and Francis L. Martinb
School of Computing and Communications, Infolab21, Lancaster University, Lancaster LA1 4WA, UK Centre for Biophotonics, Lancaster Environment Centre, Lancaster University, Lancaster LA1 4YQ, UK c Safety and Environmental Assurance Centre, Unilever Colworth Science Park, Bedfordshire, MK44 1LQ, UK b
Associate Editor: Dr. Jonathan Wren
1
INTRODUCTION
Vibrational biospectroscopy (VBS) is the application of infrared (IR) and Raman spectroscopy to biological studies and biomedical applications (Martin et al., 2010). In the past decades, vibrational spectroscopy data processing was developed on the grounds of signal processing, statistics, and pattern recognition, resulting in a large number of computational methods that are routinely applied in the field. However, the field needs further development and establishment of data analysis strategies, partially due to a continuous push from instrumental advancements, but also motivated by challenges in pre-processing, biomarker extraction and standardization of inter-experimental datasets, and inspired by the increasing power of computers (Trevisan et al., 2012). VBS data analysis is largely carried out by commercial softwares such as CytoSpec (www.cytospec.com), Neurodeveloper (www.neurodeveloper.com), Unscrambler (www.camo.com), Pirouette (www.infometrix.com), OPUS (www.bruker.com) and Wire (www.renishaw.com). Popularly used commercial MATLAB toolboxes include the Neural Network, and the Bioinformatics Toolbox. Others are free to use, but closed-source, such as PRTools (Duin et al., 2007), and GA_ORS (Nikulin et al., 1998). While these are all high-quality software, the use of closed-source software contradicts the multidisciplinary aspect of the field, since researchers looking for new analysis strategies remain dependant from the software manufacturers. On the other hand, open-source *
softwares available are largely restricted to a given task, such as LibSVM (Chang and Lin, 2011), Functional Data Analysis toolbox (Ramsay et al., 2009), and various other resources available online. IRootLab is a free/libre and open-source (FOSS) MATLAB toolbox created to fulfil the need for FOSS software encompassing every stage of VBS data analysis. It is a highly modular software that was created based on existing theory of data analysis (Kuncheva, 2004; Guyon et al., 2006; Hastie et al., 2007; Duda et al., 2001; Alpaydin, 2004; Bishop, 2006), and as such, applied to VBS (Somorjai, 2009; Griffiths and Haseth, 2007), bringing together families of methods such as outlier removal, preprocessing, feature extraction, feature selection, feature construction, classification, classifier aggregation, clustering; concepts such as cross-validation, random sub-sampling, peak detection, biomarker identification; a set of unique visualization options (Supplementary Figure S1); and a MATLAB code generator. The basic modular design is very simple, which makes IRootLab a flexible and intuitive resource for vibrational spectroscopy data analysis developers.
2
CLASS LIBRARY
The majority of IRootLab code lines are attributed to its hierarchically organized object-oriented programming (OOP) classes. The basic framework is constituted of three branches: datasets, blocks, and logs. A dataset is an object representing point spectra (with their respective classes, patient names etc), image maps, clustering data, or classifier estimations. A block is the basis of data manipulation. It is an object that allows mainly two operations: training and using. Training involves the use of training data to modify a block (according to its specific idiosyncrasy). Using consists of inputting data into a block to get various results, including output data, estimation data, figures, and HTML reports. Finally, logs represent the output of special blocks called analysis sessions, which perform complex analyses and generate output that does not fit into the usual dataset class. Additionally, there are a few complementary branches, from which the most important are sub-dataset generation specs (SGS), feature subset grader (FSG), and peak detector. SGS is an abstraction of the concept of random sub-sampling (e.g., crossvalidation, repeated random sub-sampling); FSG is used to evaluate sub-sets of features in feature selection tasks, freeing the feature selection algorithm from having to implement its own evaluation; peak detection (Coombes et al., 2003) is used in visualizations and biomarker identification.
To whom correspondence should be addressed.
1 © The Author (2013). Published by Oxford University Press. All rights reserved. For Permissions, please email:
[email protected]
Downloaded from http://bioinformatics.oxfordjournals.org/ by guest on August 28, 2015
ABSTRACT Summary: IRootLab is a free and open-source MATLAB toolbox for vibrational biospectroscopy (VBS) data analysis. It offers an objectoriented programming class library, graphical user interfaces (GUIs), and automatic MATLAB code generation. The class library contains a large number of methods, concepts and visualizations for VBS data analysis, some of which are introduced in the toolbox. The GUIs provide an interface to the class library, including a module to merge several spectral files into a dataset. Automatic code allows developers to quickly write VBS data analysis scripts, and is a unique resource among tools for VBS. Documentation includes a manual, tutorials, Doxygen-generated reference, and a demonstration showcase. IRootLab can handle some of the most popular file formats used in VBS. License: GNU-LGPL. Availability: Official website: http://irootlab.googlecode.com/. Contact:
[email protected]
Trevisan et al.
Blocks can be created and combined recursively (e.g., a special block called “block cascade” is composed of other blocks, which in turn can be used as a component of a higher-level block cascade) to build analyses as complex as desired. Many complex operations are already offered as sub-classes of a special class of block called analysis session, including grid search optimization (Hsu et al., 2010), repeated train-test using an SGS object to obtain performance estimation of a classifier, and cross-calculation of LDA scores (Riding et al., 2012).
3
GRAPHICAL USER INTERFACES (GUIs)
4
CODE GENERATION
One of the major features of IRootLab is the ability of objtool to generate MATLAB code (similar to macro recording in Microsoft Word). This is a highly efficient resource for MATLAB scripting. In fact, a significant part of IRootLab was written using this resource. Code generation also keeps developers from having to consult the library documentation too often.
5
DOCUMENTATION
IRootLab has a clear documentation project. The official documentation (available at http://bioph.lancs.ac.uk/irootlabdoc) is generated directly from the source code using Doxygen software. Apart from this, IRootLab has a manual, and a series of tutorials (available at downloads area of the official website) that together provide a friendly start for new users. The official reference can be accessed from MATLAB in two different occasions: from the command line, by using the help2 command; and from the GUIs, by pressing the F1 key (context-sensitive help). Additionally, a demonstration showcase was prepared (which can be opened by typing the command browse_demos at MATLAB command line), and a number of sample datasets are shipped with the toolbox.
6
IRootLab uses a number of 3rd-party packages, whose developers we would like to thank: Chih-Chung Chang, Chih-Jen Lin, Jacob Filik, James O. Ramsay, Michael Nasse, Paul Bassan, and Yannick Maret. We would also like to thank our colleagues Abdullah A. Ahmadzai, Imran I. Patel, Jemma G. Kerns, and Valon Llabjani for their participation in the conception. The project was partly funded by Unilever.
REFERENCES Alpaydin,E. (2004) Introduction to Machine Learning. MIT Press, Cambridge, MA, USA. Bishop,C.M. (2006) Pattern Recognition and Machine Learning. Springer, Cambridge, UK. Chang,C.-C. and Lin,C.-J. (2011) LIBSVM: a Library for Support Vector Machines. ACM TIST, 2, 27:1–27:27. Coombes,K.R. et al. (2003) Quality control and peak finding for proteomics data collected from nipple aspirate fluid by surface-enhanced laser desorption and ionization. Clin. Chem., 49, 1615–1623. Duda,R.O. et al. (2001) Pattern Classification 2nd ed. John Wiley & Sons, New York. Duin,R.P.W. et al. (2007) PRTools4 - A Matlab Toolbox for Pattern Recognition. Pattern Recognition, 1–61. Griffiths,P.R. and Haseth,J.A. (2007) Fourier Transform Infrared Spectroscopy. 2nd ed. Wiley, Hoboken, New Jersey, USA. Guyon,I. et al. (2006) Feature Extraction - Foundations and Applications. Springer, New York. Hastie,T. et al. (2007) The Elements of Statistical Learning 2nd ed. Springer, New York. Hsu,C. et al. (2010) A Practical Guide to Support Vector Classification. Bioinformatics, 1, 1–16. Kuncheva,L.I. (2004) Combining Pattern Classifiers: Methods and Algorithms. Wiley, Hoboken, New Jersey, USA. Martin,F.L. et al. (2010) Distinguishing cell types or populations based on the computational analysis of their infrared spectra. Nat. Prot., 5, 1748–1760. Nikulin,A.E. et al. (1998) Near-optimal region selection for feature space reduction: novel preprocessing methods for classifying MR spectra. NMR Biomed., 11, 209–16. Ramsay,J. et al. (2009) Functional Data Analysis with R and MATLAB. Springer, New York. Riding,M.J. et al. (2012) Concentration-dependent effects of carbon nanoparticles in gram-negative bacteria determined by infrared spectroscopy with multivariate analysis. Environ. Poll., 163C, 226–234. Somorjai,R. L. (2009) Creating robust, reliable, clinically relevant classifiers from spectroscopic data. Biophys. Rev., 1, 201–211. Trevisan,J. et al. (2012) Extracting biological information with computational analysis of Fourier-transform infrared (FTIR) biospectroscopy datasets: current practices to future perspectives. Analyst, 137, 3202–3215. Trevisan,J. et al. (2010) Syrian hamster embryo (SHE) assay (pH 6.7) coupled with infrared spectroscopy and chemometrics towards toxicological assessment. Analyst, 135, 3266–3272.
CONCLUSION
Although the most valuable contributions of IRootLab are its framework and its code generation, there are currently more than 200 implemented OOP classes representing methods, algorithms, concepts, and visualizations. However, it is not guaranteed that any user will find their desired method(s) among the existing set thereof. However, being FOSS software means that any user can expand the toolbox to contain new methods necessary to their own analysis, and then share these new additions, creating a synergic effort among the scientific community. Expansion is facilitated by IRootLab modular structure, which allows developers to target or inherit a specific OOP class. IRootLab is a unique and innovative
2
ACKNOWLEDGEMENT
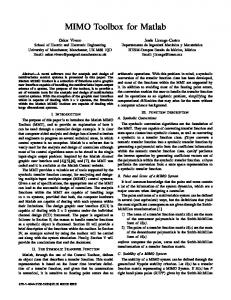
Figure 1 – IRootLab GUIs (objtool, mergetool, sheload) and their surrounding environment.
Downloaded from http://bioinformatics.oxfordjournals.org/ by guest on August 28, 2015
Figure 1 shows the interaction of IRootLab GUIs with the class library and their surrounding environment. IRootLab offers a flexible and intuitive GUI called objtool that is an interface to the class library. Objtool allows datasets and other objects present in the MATLAB workspace to be browsed and manipulated using new or existing blocks. Objtool can handle three types of TXT files; OPUS image maps; and a native IRootLab MAT format. Mergetool is another GUI that allows a collection of singlespectrum files to be merged together to form a dataset. Currently, mergetool can import three different types of single-spectrum files: Pirouette .dat, OPUS single-spectrum files, and Wire TXT files. Finally, the SHEload GUI accesses an online MySQL database that is part of a chemical database project (Trevisan et al., 2010), importing datasets from there.
contribution to the interdisciplinary research field of VBS, providing researchers with a valuable tool for the development of VBS data analysis.