Reed Hastings and Bob Joyce. Purify: Fast detection of memory leaks and access errors. Proceedings of the Winter USENIX Conference, pages 125{136, ...
J iT I :
Tracing Memory References for Data Race Detection
Michiel Ronsse � and Koen De Bosschere y Department of Electronics and Information Systems, Universiteit Gent, Sint-Pietersnieuwstraat 41, B-9000 Gent, Belgium This paper presents a methodology to combine a record/replay mechanism with data race detection. It is shown that such a combination has a lot of advantages and that it will enable the user to detect synchronisation as well as functional errors. The paper focuses on the detection of data races in general and the problem of nding all memory references issued by a program in particular. To this end, a special instrumenter, J iT I , is proposed. J iT I was designed to nd all memory references without introducing a prohibitive overhead.
1. INTRODUCTION In parallel and distributed programming, bugs can be caused by two types of errors: functional errors, i.e., programming errors that also occur in sequential programming, and synchronisation errors which are typical for parallel and distributed programs. As these executions are typically nondeterministic |consecutive program executions on the same input can result in di�erent execution paths| cyclic debugging techniques as such become unusable because the operation of a debugger can considerably perturb a program execution due to the so-called probe e�ect [1]. The classical technique used to overcome this problem is to use a record/replay method, separating the original execution of a program from its debugging session. In the record phase, the information relevant for a faithful re-execution is recorded, and this information is used during the debugging phase (Instant Replay [2]). Ideally, for parallel programs using the shared memory paradigm, we should record every shared memory reference to allow for a faithful re-execution. However, this is not feasible as it generates trace les that are too big to handle, and causes too much perturbation in the original execution. An alternative is to only record the order of the synchronisation operations (Instant Replay [2], ROLT [3,4]). By taking this order into account during re-execution, the original program run can be reconstructed, provided that there are no data races. In this context, we de ne a data race as two unsynchronised memory references by two processes to one memory location, of which at least one reference is a write access. Michiel Ronsse is supported by a grant from the Flemish Institute for the Promotion of the Scienti cTechnological Research in the Industry (IWT). y Koen De Bosschere is a research associate with the Fund for Scienti c Research { Flanders. �
Detecting data races is however not simple. The only practical technique currently available is on-the- y data race detection, i.e., searching for data races that occur in a particular execution. Unfortunately, on-the- y data race detection is very intrusive and hence not practical for being used in actual parallel executions due to the probe e�ect. Our proposal is to perform data race detection at replay time. This combines three advantages. 1. Running data race detection during replay guarantees that the original program
ow is preserved during replay. Hence, sophisticated race detection algorithms can be used without altering the program ow. 2. Running data race detection during replay ensures the correctness of the replay up to the detection of the rst data race because data races are detected as soon as they e�ect the program execution. 3. Removing detected data races generally requires the use of cyclic debugging techniques, and hence record/replay. Knowing that there is a data race on a particular memory location does indeed not automatically explain how that data race was introduced. Reference identi cation can be used to nd out which instructions are responsible for the data race. One could argue that there is a contradiction between the rst two points: the record/ replay mechanism is needed to nd data races, but record/replay does not work in the presence of data races! This is however not true: the record/replay mechanism guarantees a faithful replay until the e�ects of the rst data race occur, at which time they are immediately detected by the data race detection. Therefore, the rst data race that can a�ect the execution can be found and removed, after which the same procedure can be iterated until all the data races are found and removed. This calls for an on-the- y detection of data races: there is no need to collect trace data after the e�ects of the rst data race have occurred as replay becomes unreliable after this point and subsequent trace data become unreliable too. Hence, post mortem race detection is not practical, and in general infeasible due to the size of the trace les for real applications.
2. ON-THE-FLY DATA RACE DETECTION On-the- y data race detection consists of two steps [5]: � collecting memory reference information per sequential block between two successive synchronisation operations, � detecting con icting memory references in concurrent sequential blocks. These two steps require the knowledge of all memory references, all synchronisation operations (de ning the sequential blocks) and the concurrency between these blocks. The rst step is further explained in the next section about J iT I . The second step consists of detecting concurrent sequential blocks and checking for data races at run time. We use vector clocks to detect concurrent sequential blocks. Updating vector clocks is
time-consuming, but this is not an issue during replay.3 Once the concurrent sequential blocks are known, race detection boils down to taking the intersection of the reference information. There will be a race between sequential block i and sequential block j if the condition (R(i) [ W (i)) \ W (j ) 6= ; _ (R(j ) [ W (j )) \ W (i) 6= ; is ful lled (W (i) resp. R(i) are the write resp. read accesses in sequential block i).
3.
J iT I
: JUST IN TIME INSTRUMENTER
This section describes J iT I , a novel instrumenter developed especially for data race detection. J iT I is a part of our RecPlay system, a record/replay tool with automatic detection of data races. The underlying record/replay system is ROLT [3,4]. As explained in the previous section two types of information are needed to detect data races on-the- y: the memory accesses issued by the program and the occurrence of synchronisation operations. To detect data races, it is of paramount importance that all memory accesses are detected. This contrasts to cache simulators, pro lers, etc., where partial data such as data collected by a sampling mechanism is su�cient most of the time. As one single memory access can introduce a data race, the primary goal of J iT I is to detect all memory references. This calls for instrumentation: modifying the application by adding additional code for each memory operation. The synchronisation operations we are interested in are those provided by the Solaris operating system (mutexes, semaphores, read/write locks and condition variables). Although these synchronisation operations will issue memory accesses, we are not interested in these memory accesses. Indeed, these memory accesses will introduce data races (e.g. two P () semaphore operations trying to grab the same semaphore), but these are intended data races. As the record/replay system will force these synchronisation operations to re-execute in the original order, no non-determinism is introduced by these operations. Tracing these memory accesses would complicate the detection of data races, as accesses to semaphore variables etc. have to be ltered away. Therefore, J iT I will trace all memory accesses, except for those issued by synchronisation operations.
3.1. Collecting Memory References
Collecting memory access information (the R and W sets) implies that the memory access instructions are in some way instrumented in order to generate this information. We have chosen for an approach that requires a minimal number of assumptions, and does not depend on a particular compiler, linker, etc. Furthermore, we wanted the instrumentation to be a feature of an execution, not of the executable, just as is the case with our implementation of the ROLT method [4]. Hence, J iT I instruments the code at execution-time, and not at link-time. Instrumenting a binary le by inserting instructions (ATOM [7], EEL [8],...) is not always reliable due to the possible occurrence of data in the code, code in the data, During the record phase, we make use of more e�cient scalar Lamport clocks [6] as they are su�cient for a faithful replay.
3
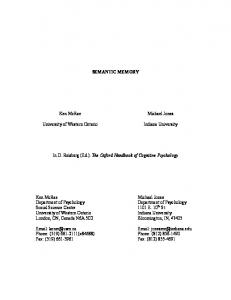
etc. In principle it requires a sophisticated analysis, and possibly information about the idioms used by a particular compiler. Hand-written assembly code can easily break the instrumentation code. In order to avoid such a sophisticated and time-consuming analysis, we start by cloning the code of the process at a given o�set (= �) in memory, and copying all the instructions from the original code to the clone while replacing memory operations by procedure calls (compare Figure 1 with Figure 2). By changing the entry point of the program, we force the clone to be executed instead of the original code. The clone executes exactly as the original code, except for the memory operations. Instead of issuing a memory access, a procedure is called. This procedure will execute the original memory instruction (found very easily in the original code, as it is placed at a constant o�set) and determine the address used. 4 Working on a copy of the code has the advantage that as we do not insert instructions, the target address of jump instructions will not change. This circumvents the problems encountered by ATOM [7], EEL [8], etc. Although J iT I only instruments the statically linked code, a simple extension would make it possible to instrument dynamically linked libraries as well. However, by leaving out these dynamically linked libraries, spatially selective instrumentation is possible: statically linked libraries are traced, dynamically linked libraries are not. As the thread library containing the synchronization operations is always linked dynamically, memory operations executed on behalf of these synchronization operations will not be traced, solving the problem mentioned in the previous section. As J iT I allows the re-instrumentation of a program, selective instrumentation in time is also possible. RecPlay uses this facility by starting with an uninstrumented clone and adding the instrumentation when the rst thread is created. This allows for a run at full speed till the rst thread is created, diminishing the overhead created by J iT I . As memory accesses performed before the rst thread is created (in the sequential part) are never concurrent with other memory operations, no harm is done.
3.2. Intercepting synchronisation operations
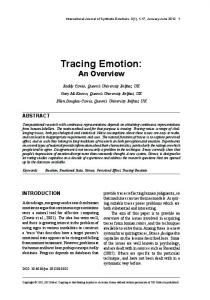
Intercepting the synchronisation operations could be done in a similar way: e.g. by changing the calls to the operations. Unfortunately, this is impossible as the thread library is always linked dynamically using a procedure linkage table containing the procedure addresses. Therefore, after the dynamic loader resolves the addresses, J iT I changes the procedure linkage table. As the procedure linkage table contains only one item for each procedure, regardless the number of times the procedure is called, the overhead is minimal. The addresses in the table are changed in order to force the parallel application to call functions provided by J iT I instead of the original Solaris procedures. These new functions will call the ROLT functions, check for data races and call the original functions.
3.3. Implementation
Our system currently runs on SPARC systems from Sun running the Solaris operating system. Porting to other systems should be straightforward.
This explanation is greatly simpli ed. For instance, memory operations in delay slots, indirect jumps, etc. need special attention. J iT I deals correctly with these problems, and even handles self-modifying code correctly.
4
Original code: ... LD [...],... ... CALL SEMA_POST ... ST ...,[...] ... CALL SEMA_POST ...
Proc. Linkage Table:
Thread library:
SEMA_POST:
SEMA_POST:
set address
original Solaris synchronisation code
JMP address
RET
Figure 1. The normal memory layout after loading a program. The dynamic linker resolves the program's calls to procedures in dynamic libraries by lling in the missing addresses in the Procedure Linkage Table.
is very easy to use: we developed a dynamic library and inform the dynamic loader (using the environment variable LD PRELOAD) to load this library each time a program is executed. The special symbol init denotes a function that is executed when the library is loaded, but before the execution of the application. It is this function that builds the clone and initializes J iT I , ROLT and RecPlay. J iT I
4. EVALUATION The system was tested on a SPARCserver 1000 with 4 processors. Table 1 shows some experimental results obtained for the test program `MLEM', a parallel implementation of the Maximum Likelihood Expectation Maximization algorithm [9]. The program uses about 600 Solaris synchronization operations and performs 374.042.071 parallel memory accesses (as the accesses during the sequential part are not traced, they are not counted). For this experiment a data race was inserted in the program. The table shows the di�erent steps one would go through in order to make the program data race free. Table 2 shows some results obtained for `pstatePAR', a recently developed parallel simulator for modeling the parallelism in an instruction window for a high performance processor. Actually, RecPlay was used during the development phase and found about ve data races. The program performs 110.211.678 parallel memory accesses.
Original code:
Clone code:
Trace routine:
...
...
set return addr.
LD [...],... ...
BA,a ... ...
set return addr.
CALL SEMA_POST ...
CALL SEMA_POST ...
JMP ...
ST ...,[...] ...
Ba,a ... ...
calculate addr.
CALL SEMA_POST ...
CALL SEMA_POST ...
exec. orig. instr.
JMP ...
trace addr. JMP next instr.
Proc. Linkage Table: SEMA_POST: set address JMP address
Thread routines: SEMA_POST: CALL ROLT-routines process memory accesses JMPL ... RET
Thread library: SEMA_POST: original Solaris synchronisation code RET
Figure 2. The memory layout after J iT I performed its modi cations. J iT I builds a clone at a constant o�set and replaces memory operations by calls to the trace routine (using trampolines). J iT I also replaces the addresses in the Procedure Linkage Table. (This gure is a greatly simpli ed view of the actual situation.)
5. RELATED WORK Although much theoretical work has been done in the eld of data race detection [10, 5,11] few implementations have been proposed. Data race detection can be implemented by either instrumenting the hardware or by instrumenting the software. Hardware instrumentation means that either extra hardware is added to observe the bus or that an architectural simulator is used to execute the program, or that single-stepping (using ptrace() or the proc-interface) is used. These techniques are however either expensive or very intrusive. Software instrumenting is cheaper and less expensive. It can be done statically or dynamically. Static instrumenting can be done on the source code (e.g., lock lint [12] for the static analysis of C-source), object code (e.g., Purify [13]), or on the executable (binary rewriting (e.g., ATOM and EEL [7,8]). Dynamic instrumentation is done after loading the program (e.g. J iT I and Paradyn [14] for tracing functions calls, not for individual instructions). The tools that come closest to RecPlay, apart from [15] for the proprietary MOSKITO distributed operating system (read and write sets are collected using features of the memory management unit for the virtual memory), is an online data-race detection mechanism for the CVM (Concurrent Virtual Machine) DSM system [16]. The tool is limited in that
Table 1 The di�erent steps in order to make MLEM data race free. execution mode time (s) comment normal 21.76 record #1 22.19 trace le=5672 bytes, slowdown=2.0% replay + data race detection 32.64 data race found replay + reference identi cation 2.35 replay + cyclic debugging 28.61 remove data race (time for replay only ) record #2 22.17 trace le=5568 bytes replay + data race detection 879.34 no data race found replay + cyclic debugging 28.61 remove bugs (time for replay only ) Table 2 The di�erent steps taken to test pstatePAR for data races. execution mode time (s) comment normal 4.16 record 4.27 trace le=2058 bytes, slowdown=2.6% replay + data race detection 221.37 no data race found replay + cyclic debugging 4.85 remove bugs (time for replay only)
it only instruments the memory references to distributed shared data (about 1% of all references). The tool does not instrument library functions and is unable to perform reference identi cation: it will return the variable that was involved in a data race, but not the instructions that are responsible for the reference. J iT I is more general: it can also instrument libraries, and it allows reference identi cation.
6. CONCLUSIONS We presented J iT I , a dynamic instrumenter that is to be used in conjunction with the ROLT record/replay mechanism to nd data races. J iT I will trace all memory references issued by a program, even the di�cult cases such as memory instructions in a delay slot, reading data contained in the code segment, executing code contained in the data segment, executing modi ed code,. . . It is easy to use as the instrumentation only happens at runtime, and there is no need to create specialised versions of the program. The combination of a record/replay system with race detection for shared memory systems creates a strong synergy and is unique as far as we know.
REFERENCES 1. J. Gait. A probe e�ect in concurrent programs. Software - Practice and Experience, 16(3):225{233, March 1986.
2. T. LeBlanc and J. Mellor-Crummey. Debugging parallel programs with Instant Replay. IEEE Transactions on Computers, C-36(4):471{482, April 1987. 3. L. Levrouw, K. Audenaert, and . Van Campenhout. A new trace and replay system for shared memory programs based on Lamport Clocks. In Proceedings of the Second Euromicro Workshop on Parallel and Distributed Processing, pages 471{478. IEEE Computer Society Press, January 1994. 4. M. Ronsse and L. Levrouw. On the implementation of a replay mechanism. In L. Bouge, P. Fraigniaud, A. Mignotte, and Y. Robert, editors, Proceedings of EuroPar `96, volume LNCS 1123, pages 70{73. Springer-Verlag, Lyon, August 1996. 5. K. Audenaert and L. Levrouw. Space e�cient data race detection for parallel programs with series-parallel task graphs. In Proceedings of the third Euromicro Workshop on Parallel and Distributed Processing, pages 508{515, San Remo, January 1995. IEEE Computer Society Press. 6. L. Lamport. Time, clocks, and the ordering of events in a distributed system. Communications of the ACM, 21(7):558{565, July 1978. 7. A. Srivastava and A. Eustace. Atom: A system for building customized program analysis tools. Research report 94/2, Digital-WRL, 1994. 8. J. Larus and E. Schnarr. Eel: Machine-independent executable editing. SIGPLAN Conference on Programming Language Design and Implementation, June 1996. 9. K. Bastiaens, I. Lemahieu, P. Desmedt, and W. Vandermeersch. An e�cient parallel implementation of the ML-EM algorithm for PET image reconstruction with a multithreaded operating system. In Proceedings of the 2nd Euromicro Workshop on Parallel and Distributed processing, pages 253{259. IEEE Computer Society Press, January 1994. 10. R. Netzer and B. Miller. Improving the accuracy of data race detection. In Proceedings of the 1991 Conference on the Principles and Practice of Parallel Programming, April 1991. 11. E. Schonberg. On-the- y detection of access anomalies. Proceedings of the SIGPLAN '89 Conference on Programming Language Design and Implementation, published in ACM SIGPLAN Notices, 24(7):285{297, July 1989. 12. SunSoft. lock lint User's Guide, 1994. 13. Reed Hastings and Bob Joyce. Purify: Fast detection of memory leaks and access errors. Proceedings of the Winter USENIX Conference, pages 125{136, January 1992. 14. J. Hollingsworth, B. Miller, and J. Cargille. Dynamic program instrumentation for scalable performance tools. Computer Sciences Department, University of WisconsinMadison, 1993. 15. A. Beranek. Data race detection based on execution replay for parallel applications. In Proceedings of CONPAR '92, pages 109{114, Lyon, France, September 1992. 16. D. Perkovic and P. Keleher. Online Data-Race Detection via Coherency Guarantees. October 1996. Second Symposium on Operating Systems Design and Implementation (OSDI '96).


![J]I - Semantic Scholar](https://m.moam.info/img/260x300/ji-semantic-scholar_5b450a54097c47cf588b45e8.jpg)