Journal of Chromatographic Science, Vol. 40, November/December 2002
Uncertainty in Quantitative Thin-Layer Chromatography Mirko Prosek*, Alenka Golc-Wondra, and Irena Vovk National Institute of Chemistry, Hajdrihova 19, SI-1000 Ljubljana, Slovenia
Abstract Globalization forces analysts to demand extended control of variability in analytical measurements. A calculation procedure named the “error budget model” following recommendations proposed more than 20 years ago by the Bureau International des Poids et Mesures (BIMP) is established as a rule for evaluating and expressing the measurement uncertainty across a broad spectrum of measurements. This metrological approach common in physical measurement is not applicable in separation techniques and cannot quantitate measurement uncertainty. Our experiments show that it can be used as a planning tool in the validation of thin-layer chromatographic (TLC) methods. A computer program that quantitates uncertainty components associated with potential sources of uncertainty in quantitative TLC is prepared and tested with experimental data. TLC plates with different qualities of stationary phases (TLC and high-performance TLC) spotted with different types of samples are measured. Application is performed manually and automatically. Plates are scanned with UV–vis scanners and a video documentation system in remission and transmission mode and fluorescence. Although the calculated values are close to the values obtained with validation procedures, the error budget approach cannot substitute validation. Calculated results can predict critical points in real quantitative TLC, but they cannot confirm the validity of a selected chromatographic procedure.
Introduction International trade, globalization, and cross-border issues force analysts not only to standardize analytical methods in chemistry but also to demand extended control of variability in analytical measurements. Measurement disagreement between countries can represent unacceptable barriers to trade. In order to overcome such problems an international infrastructure is needed upon which comparable measurements can be possible to make. One part of the solution is the International System of Units and international programs for metrology in chemistry. These activities are unfortunately performed according to the expectations of metrologists working on physical metrology, pointing out traceability, uncertainty, and a hierarchical chain of standards. These trends are accumulated in the definition, search, selection, and * Author to whom correspondence should be addressed: email
[email protected].
evaluation of primary methods of measurements (PMM), which are methods having the highest metrological qualities. The idea to search primary methods is sound from a metrological point, but it is not very important for analysts who have to select methods according to the sample origin, sponsors’ expectations, and situations in the laboratory. In these cases a metrological approach is not enough. Firstly, the correct scientifically based analytical management has to be ensured and thereafter analysts have to take care of the correct measurement itself. Since 1993, when the International Organisation for Standardisation (ISO) published Guide to the Expression of Uncertainty in Measurements (1) and especially after the second edition of the EURACHEM/CITAC guide Quantifying Uncertainty in Analytical Measurements (2), analysts were exposed to the certain pressure, mostly from accreditation bodies, needed to accept the concept of the measurement uncertainty in their work. It consists of four steps: a clear description of the measuring procedure, identification of uncertainty sources, quantitation of uncertainty components, and lastly calculation of combined uncertainty. This calculation procedure is named the “error budget model” and follows recommendations proposed more than 20 years ago by the Bureau International des Poids et Mesures (BIMP). According to our experiments this procedure is adequate only for simple stoichiometric analytical methods and is not applicable for sophisticated analytical methods, such as chromatography. It is a parameter for the quality and not for the reliability of chemical analytical measurements. The reliability means constant quality throughout the time of the experiment and is evaluated with a careful validation procedure (plan, experiment, and report); an adequate number of quality control samples; and interlaboratory comparisons. According to NIST the process of measurement uncertainty is developed for fundamental metrological research and is applicable specifically to standard reference material. It appears that a certain group of analysts tried to expand measurement uncertainty by definition without a serious test of its behavior in real applications (3).
Experimental The usefulness of the error budget model for planar chromatography has been studied on the example quantitative deter-
Reproduction (photocopying) of editorial content of this journal is prohibited without publisher’s permission.
1
Journal of Chromatographic Science, Vol. 40, November/December 2002
mination of the food additive sodium glutamate (4,5) in some food products. According to the EURACHEM/CITAC guide (2), a thin-layer chromatographic (TLC) procedure is divided into stages and in each stage the size of each identified potential source of uncertainty is evaluated. A cause-and-effect diagram is constructed, and identified sources of uncertainty are listed. By quantitating the measuring uncertainty, we found out that in quantitative TLC there were certain parameters not found during the calculation procedure that contributed more than all of the other sources identified according to the suggested error budget method (Table I). Estimation of uncertainty according to the ISO guide is based on the classic simplified mode of the evaluation of errors. The contribution of each variable is estimated by holding all other variables constant. At the end, all assessed contributions are expressed as standard uncertainty and the combined standard uncertainty is calculated using mathematically simple procedures. This procedure is good in classic stoichiometric analysis. In modern instrumental analysis uncertainty must be evaluated with a carefully planned “top-down” procedure. Holistic validation is the right way to give reliable values of measurement uncertainty; meanwhile, the error budget modular approach proTable I. Reported Variances Calculated from the Validation Experiment and Cause-and-Effect Diagram Constructing on the Equation for the Result* Variance uvol uw1 uw2 u% umol
Description
Value
Remarks
0.10% 0.03% 0.05% 0.30% 0.002%
temperature, dilution balances balances declared value > 99% calculated
nex nv
volume of H2O weight of sample weight of standard purity of standard molar mass of L-Na glutamat extraction linomat
2.5% 0.5%
nc nd
chromatography derivatization
1.2% 0.8%
ng
concentration gradient 0.4%
nm
scanning
0.3%
np
positioning
–
ni
integration
1.0%
nHP-TLC
selection of HP-TLC plate
–
validation parameter application: bands (5 mL), 6 mm validation parameter estimated (data pair techniques) estimated (data pair techniques) scanner error calculated from 10 measurements of one band application in the form of bands peak start, peak end, baseline construction depends on noise not possible to estimate, if normal TLC plate is used the total error is 4.5%
* Four HP-TLC plates with 6 samples and 6 standards on each plate were prepared. Quantitation was performed with the data pair technique. Contributions for uncertainties were taken from the EUROCHEM guide. Regarding results, the uncertainty contribution from mentioned sources was 0.32%, the total error calculated from error propagation was 3.15%, and the final combined result was 3.17%.
2
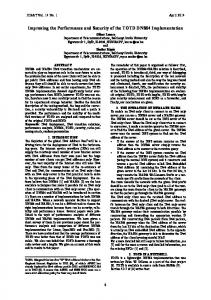
posed by ISO cannot be used in such cases. Improvements of hardware and software are so quick that it is not possible to get reliable data for the calculation of uncertainty from the published experiments. Nevertheless, we did not accept measurement uncertainty calculated according to the error budget model. Our experiments showed that this model could only be used for the identification of critical points in analytical procedures. A computer program that quantitates measurement uncertainty associated with potential sources of uncertainty in quantitative TLC was developed in our laboratory. The flow chart of the program is presented in Figure 1. The analyst selects basic parameters of TLC and the program estimates the uncertainty of his or her method using relevant associated uncertainty values obtained from literature (6–11) and our experimental work. This approach is acceptable for planar chromatography because it consists of clearly separated stages: sample (standard) preparation, application, development, and evaluation. The result of a measurement is always subject to error. The precision of each stage is quantitated in terms of variance, which is expressed as the square of the relative standard deviation (RSD). In measurements, the variance of the process is determined by the addition of the variances [standard deviation (SD)] of the individual steps: SD02 = SD12 + SD22 + SD32 + … + SDn2
Eq. 1
In order to describe the quality of a measurement (perhaps it can also be called uncertainty), we have to identify the individual variances. It is evident that one or a few sources of variance can be the major contributors to the total variance, owing to the addition of the squares. Unlike random errors, biases are added algebraically: B0 = B1 + B2 + B3 + … + Bn
Eq. 2
Whereas the effect of random error decreases as the number of measurements increases, the effect of bias is independent of the number of measurements (i.e., it is not possible to improve accuracy with a large number of measurements if biases are part of a method). In TLC the contribution of systematic errors is normally smaller than the contribution of statistical errors, because TLC is an open system without forced flow and chromatographic conditions are statistically controlled. Reliable data of each operation are obtained with modular validation. It is not necessary to use a holistic approach as it is in high-performance liquid chromatography or gas chromatography. The example presented on the flow-chart in Figure 1 shows calculated results of an experimental analysis in which 50 mg of a sample was weighed and diluted with 10 mL of solvent and 2 mg of the standard was weighed and diluted in 10 mL of solvent. Dilution was performed in one step only. The sample and standard were applied manually in the form of two tracks with 1 mL micropipettes on silica gel TLC and high-performance (HP)-TLC plates (10- ¥ 20-cm). Plates were with 2-propanol, H20 (7:3, v/v) in a normal unsaturated developing chamber, and dried on a special hot plate (Camag, Muttenz, Switzerland). This procedure is often used in TLC laboratories. Quantitative evaluation was performed
Journal of Chromatographic Science, Vol. 40, November/December 2002
with a Camag TLC Scanner II connected to a PC in UV mode with a scanning slit slightly bigger than spots. Integration in automatic mode was performed with quantitative TLC (QTLC) soft-
< 10 mg
0.5%
TLC
2.0%
manual
2.0%
> 10 mL
0.5%
< 5 mg
0.5%
< 10 mL
0.5%
Samp. (µL) 1.0 manual
Vertical
ware (IFC, Bad Duerkheim, Germany). Quantitation was performed with a single standard applied twice, and two sample replicates were used. Calculated RSD values for each stage and the
Stan. (µL) manual
1.0
2.0% Hot plate
Denzitom
1.0%
Smaller
1.0%
UV
1.0%
Remis
1.0%
Avtom.
2.08%
5.0%
Exchange 1.0% Standards 1.0% Standards manual
4
Sample manual
4
Figure 1. Template for quantitating uncertainty components in QTLC.
3
Journal of Chromatographic Science, Vol. 40, November/December 2002
final result are shown in Figure 1. A prepared program was tested with a set of experimental data. TLC plates with different qualities of stationary phases (TLC and HP-TLC) were spotted with different samples. Application was performed manually and automatically by means of a Linomat IV applicator (Camag). Plates were scanned with a Camag TLC Scanner II, Camag TLC Scanner III, and Camag Video Documentation System in remission, transmission mode, and fluorescence. Results of some of the experiments and adequate calculated values are presented in Figure 2. Nevertheless, the calculated values are close to the values obtained with the validation procedure, we cannot use them as a substitution for validated data. Our results are only a useful guideline to the better understanding of relations between the measurement procedure and expected error. They can only predict the behavior of real samples and plates but not confirm the reliability of the selected analytical procedure. Even in TLC with its recognizable modular structure it is not possible to neglect many interactions between sources of uncertainty, which cannot be evaluated. Results of some of the experiments evaluated in our laboratory are shown in Table II. The differences between predicted calculated values and measured values, expressed as RSD (%), are not very big and also trends in certain operations can be seen. These results can be used for the identification of sources of errors in TLC, but it cannot replace a real validation experiment. One weakness of our program was the relatively small amount of measuring information in TLC, because we cannot prepare enough in-house validation data. If we want to test all of the possible combinations, we will need more than 1000 years of experimental work. Seventeen selected parameters with only three free steps will give us more than 100 million combinations. This is a typical weakness of all calculation models. As simple test examples they are unbeatable; however, in reality they become too complicated because of the increasing number of combinations between the identified components. It is for this reason that they cannot be tested at all. In our calculation only seventeen stages
with measurable sources of uncertainty were identified. However, it would be interesting to determine what it is with other sources; for instance, we do not know how to evaluate the influence of solvents on the dilution and application process. It is not possible to calculate the influence of the quality of the stationary phase (for instance, homogeneity of the stationary phase) on the chromatographic process and data acquisition and how the fluctuation of temperature outside the developing chamber and movements of the scanning table at different speeds contribute to the final error. It would also be interesting to determine such things as the intensity of a light source changed during the time.
Conclusion Planar chromatography is not a candidate for PMM, but it is a simple, very informative, inexpensive analytical tool ready to give reliable information. In real analysis there are so many parameters that cannot be described and predicted, but their influence is so great that we cannot neglect and eliminate them. Therefore, it should be decided what to do to be in-line with metrological recommendations; for example, should a useful method be eliminated. The answer is no, because in an analytical laboratory we have to give answers on analytical and not metrological questions. The best solutions in a chemical analytical laboratory in routine and research work are the result of the right analytical strategy. Educated and trained analytical chemists with knowledge of analytical management are a guarantee for the future of analytical science. It does not mean that we do not need metrology and its infrastructure. Metrology should take care of future reasonable unification, calibration tracebility of analytical measuring tools, Table II. Relationship Between the Calculated and Measured Values of the RSD* Experiment No.
Figure 2. Relation between calculated and measured values of RSD (y = 0.892, R2 = 0.931). According to the prepared experiment, RSD values represent the measurement uncertainty in QTLC. Fifteen experiments with different types of plates, application mode, spot distribution, drying, and scanning were compared.
4
1 2 3 4 5 6 7 8 9 10 11 12 13 14 15 16 17 18
Calculated %RSD
Measured %RSD
4.49 4.75 4.46 3.52 3.83 3.49 7.28 7.75 7.22 2.65 3.02 2.61 2.20 2.92 2.15 1.86 2.24 1.82
4.32 5.12 3.86 3.22 3.95 3.10 5.68 6.04 5.29 3.12 4.21 2.20 2.78 3.06 2.44 1.96 2.95 1.87
* Different types of plates, application mode, pattern, drying, and scanning were used.
Journal of Chromatographic Science, Vol. 40, November/December 2002
and calibration procedures. In order to have a worldwide acceptable analytical society, we must keep in mind that an artist and not a hammer produces a sculpture. In other words, however sophisticated a tool is, it cannot replace a master.
References 1. Guide to the Expression of Uncertainty in Measurements. International Organisation for Standardisation, Geneva, Switzerland, 1995. 2. Quantifying Uncertainty in Analytical Measurement, 2nd ed. EURACHEM/CITAC, 2000. http://www.vtt.fi/ket/eurachem. 3. W. Horowitz. Uncertainty—a chemist’s view. J. AOAC Int. 81: 785–94 (1998).
4. M. Pro?ek, M. Pukl, L. Miksa, and A. Golc-Wondra. Quantitative thin layer chromatography: quality assessment in QTLC. J. Planar Chromatogr. 6: 62–65 (1993). 5. M. Pro?ek, A. Golc Wondra, and I. Vovk. Quantifying uncertainty in quantitative TLC. J. Planar Chromatogr. 14: 62–65 (2001). 6. Quantitative TLC and Its Industrial Applications. L.R.Treiber, Ed. Marcel Dekker, Inc., New York, NY, 1987. 7. Handbook of Thin-Layer Chromatography. J. Sherma and B. Fried, Eds. Marcel Dekker, Inc., New York, NY, 1991, Vol. 55. 8. H. Jork, W. Funk, W. Fischer, and H. Wimmer. TLC: Reagents and Detection Methods. VCH, New York, NY, 1994. 9. Handbook of Thin-Layer Chromatography. J. Sherma and B. Fried, Eds. Marcel Dekker, Inc., New York, NY, 1996, Vol. 72. 10. Chromatography. O. Kaiser and R.E. Kaiser, Eds. INCom Sonderband, Dusseldorf, Germany, 1997. 11. Encyclopedia of Separation Science. I.D. Wilson, E.R. Adlard, M.C. Cooke, and C.F. Poole, Eds. Academic Press, London, U.K., 2000. Manuscript accepted May 20, 2002.
5