Journal of Chromatographic Science, Vol. 47, May/June 2009
Effect of Mobile Phase pH and Organic Content on LC–MS Analysis of Nucleoside and Nucleotide HIV Reverse Transcriptase Inhibitors Zsuzsanna Kuklenyik1, Amy Martin2, Chou-Pong Pau2, J. Gerardo Garcia-Lerma2, Walid Heneine2, James L. Pirkle1, and John R. Barr1,* 1Division of Laboratory Sciences, National Center for Environmental Health, Centers for Disease Control and Prevention, Atlanta, Georgia; 2Division of HIV/AIDS Prevention, Centers for Disease Control and Prevention, Atlanta, Georgia
Abstract The HIV-1 reverse transcriptase inhibitors tenofovir (TFV), emtricitabine (FTC), and lamivudine (3TC) are widely used in the treatment of HIV-1-infected persons and are now being considered as chemoprophylactic drugs for the prevention of sexual HIV transmission. Assays that measure these drugs after either oral or topical application are critical to the understanding of the pharmacokinetic profiles of the drugs and allow a rational design of chemoprophylaxis modalities for evaluation in macaque models and human trials. We developed a high-performance liquid chromatography–tandem mass spectrometry (HPLC–MS–MS) method for sensitive measurement of FTC, 3TC, and TFV in plasma from macaques. To achieve detection limits of 10 pg on column, the plasma analytes were measured using acidic mobile phase and positive electrospray ionization MS–MS detection. However, this caused various chromatographic peak distortions, which were minimized by using mobile phase additives that induced ionpairing interactions. Chromatographic peak tailing was minimized by adjusting the organic mobile phase concentration while considering the simultaneous effect of organic content on buffer and analyte pKa. Injection solution interferences were corrected by chromatographic peak focusing using column switching. The final method provides simultaneous measurement of all three analytes with a wide linear range of 1–3000 ng/mL using 0.1 mL plasma (10 pg on column) and coefficients of variation from 5% to 15% in the high ng/mL concentration range and from 16% to 20% in the low ng/mL concentration range.
topical microbicide gels (1,2). Simian immunodeficiency virus (SIV) infection of macaques is a well-established model for HIV transmission and can provide invaluable pre-clinical information about the relative efficacy of different chemoprophylaxis strategies. Pre-clinical research in macaques or humans requires measurement of drug levels in plasma and cellular compartments to define pharmocokinetic properties, design rational PrEP modalities, and understand the correlation between drug levels and protection. The availability of robust, sensitive, and reproducible analytical methods to measure drug levels is, therefore, essential for the design of effective interventions with oral PrEP and topical microbicide gels. The most sensitive and selective method to simultaneously monitor low ng/mL internal dose levels of low molecular weight chemicals is high-performance liquid chromatography (HPLC) coupled with tandem mass spectrometry detection (MS–MS). A comparison of representative HPLC–MS–MS approaches used for FTC, TFV, and 3TC (3–8) reveals a variety of pHs, organic solvents, column types, and modes of sample preparation. Because the maximum allowable amount of blood collected from small animals is typically 5–10 times less than that collected from humans, method sensitivity is a high priority when choosing an approach for monitoring plasma levels
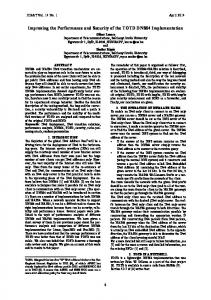
Introduction Tenofovir (TVF), emtricitabine (FTC), and lamivudine (3TC) are nucleoside/tide reverse transcriptase inhibitors (NRTI) commonly used to treat persons infected with HIV-1 (Figure 1). The potent antiviral activity, favorable safety profiles, and long intracellular half-lives of these drugs have fueled interest in evaluating their use in preventing sexual transmission of HIV-1, as either oral pre-exposure prophylaxis (PrEP) or * Author to whom correspondence should be addressed: John R. Barr, Centers for Disease Control and Prevention, 4770 Buford Highway, Mailstop F50, Atlanta, GA 30341: e-mail
[email protected].
Figure 1. Structures of FTC, TFV, and 3TC.
Reproduction (photocopying) of editorial content of this journal is prohibited without publisher’s permission.
365
Journal of Chromatographic Science, Vol. 47, May/June 2009
in macaque trials. The requirement of this method developed for our macaque study was to attain detection limits of 1–5 ng/mL from 100 µL plasma. This article describes the application of recent advancements in chromatographic science and instrumentation for monitoring internal dose levels of NRTI drugs to achieve an optimal balance between MS–MS sensitivity and analytical separation. Due to their wide range of pKas (2.7–4.6), FTC, TFV, and 3TC are a challenging group of compounds to monitor simultaneously. Because of their ionizable nature, these compounds exhibit overloading and chromatographic peak distortion effects at acidic mobile phase conditions, which is necessary for their sensitive MS–MS detection. In accordance with the prominent literature on the effect of pH and organic solvents on chromatographic behavior of ionizable compounds (8–15), we performed a series of experiments to evaluate the interaction of pKa, pH, buffer, organic solvent, and the nature of the stationary phase on the chromatographic behavior of NRTIs. The findings from this study provide valuable experimental information that may be used to guide implementing HPLC–MS–MS methods for other chemical compounds with a wide range of pKas. Understanding the retention behavior of FTC, TFV, and 3TC was essential to implement our column switching HPLC–MS–MS method for monitoring low ng/mL plasma levels. To our knowledge, this is the first HPLC–MS–MS method that simultaneously measured these three compounds. This method provides for 10–20% coefficient of variation (CV) over a wide linear range of 1–3000 ng/mL for all three analytes using 100 µL plasma.
Materials and Methods Chemicals
Methanol, glacial acetic acid, formic acid, and ammonium hydroxide were all HPLC-grade. 3TC [1-(2R,5S)-[2-(hydroxymethyl)-1,3-oxathyolan-5-yl]cytosine], FTC [5-fluoro-1(2R,5S)-[2-(hydroxymethyl)-1,3-oxathyolan-5-yl]cytosine], and TFV [(R)-9-(2-phosphonylmethoxypropyl)adenine] were donated by Gilead Sciences (Foster City, CA). Isotopically labeled emtricitabine-[2-13C, 1,3-15N2] ([13C,15N2]-FTC) and tenofovir-[adenine-13C5] ([13C5]-TFV) were purchased from Moravek Biochemicals (Brea, CA). NRTI structures are shown in Figure 1. Standard stock solutions were prepared by weighing (~ 0.1–1 mg) and dissolving solid standards in 100 mL 50% methanol–water; 0.05% ammonium hydroxide was added to dissolve the TFV stock solution. Working standard solutions containing all three analytes were prepared by serial dilutions in 50% methanol–water from the stock solutions so that a 20-µL spike added to 100 µL plasma produced final calibration range concentrations of 0.1–3000 ng/mL. Internal standard stock and working solutions were also prepared in 50% methanol–water. Human plasma was purchased from Interstate Blood Bank, Inc. (Memphis, TN). Pools were prepared from the plasma of
366
three anonymous donors. A portion of the pool was used as an analytical method blank and for preparing calibration standards. Three other pools were spiked with FTC, TFV, and 3TC to obtain quality control samples (QCs) at low (10 ng/mL), medium (350 ng/mL), and high (700 ng/mL) concentrations. The blank and spiked pools were dispensed into cryovials and stored at −20°C until used. Preparing plasma samples
300 µL methanol, 20 µL internal standard, and 100 µL plasma aliquot were added to each 1-mL well of a 96-well plate. Calibration standards were prepared in the same manner with an additional 20 µL standard spiking solution. After the samples were mixed on a vortex mixer and centrifuged, the supernatants were transferred into a 500-µL 96-well plate and evaporated in a vacuum centrifuge at 65°C for 45 min until the extract volume was reduced to 10–20 µL. The samples were diluted to ~ 50 µL with aqueous HPLC eluent (20mM formate–20mM acetate) and injected into the HPLC–MS–MS system. High-performance liquid chromatography
The HPLC system was built from Shimadzu components (Columbia, MD): one CBM-20A controller, one Sil-20AC autosampler, three LC-20AD isocratic pumps, and one FCV20AH2 two-position, six-port valve. In the final method, solvent A contained 20mM formic acid (0.8% volume of 96% formic acid), 20mM acetic acid (0.11% volume of 99% glacial acetic acid) with pH adjusted to 3.2 with ammonium hydroxide (~ 0.8% volume of 30% ammonium hydroxide) in water; solvents B and C contained the same amount of additives in 100% methanol and 15% methanol, respectively. The injection volume was 10 µL. The two-position, six-port valve was configured for trap loading (Figure 2). During the first 0.5 min of each sample run with a 0.2 mL/min flow of 3% methanol (binary pump A+B), the analytes were concentrated on a 10mm × 2.1-mm, 3.5-µm particle size SymmetryShield C18 trapping column, while the injection matrix was led to waste. With the turn of the six-port valve, the analytes were transferred from the trapping column to the analytical column with 0.2 mL/min flow of solvent C (15% methanol, isocratic) for 1.5 min. While the analytes were eluted from the analytical column in isocratic mode, the trapping column and injector lines were regenerated with a methanol gradient: 3–60% increase in 1 min, followed by a 60% hold for 4 min, then equilibrated back to 3% for the next injection in 5 min. The total sample run time was 12 min. Tandem MS
The detector was an API 4000 Q-trap triple quadrupole tandem MS (Applied Biosystems, Foster City, CA) operated in positive ion mode. The ESI settings were: curtain gas (N2) flow, 35 arbitrary units (au); high collision gas flow; heated nebulizer gas (air) flow, 45 au; nebulizing gas temperature, 500°C; and ionization voltage, –4500 V. Unit resolution was used for both Q1 and Q3 quadrupoles. For each analyte, the two most intense fragment ions were chosen in multiple reaction monitoring (MRM) as quantification ion and confirmation ion: FTC, 248/119 (248/130); TFV, 288/176 (288/159);
Journal of Chromatographic Science, Vol. 47, May/June 2009
[13C,15N2]-FTC, 251/115 (251/133); and [13C5]-TFV, 293/181 (293/164). Molecular ion declustering and product ion collision cell potentials were optimized separately for each MRM fragmentation. Experimental design for studying the effect of pH and organic content on chromatographic behavior of NRTIs
For each run, we injected 10 µL of 250 ng/mL solutions prepared in 95% buffer–methanol. The buffer pH was measured in 100% aqueous solvent: 20mM ammonium formate (pH 3.2), 20mM ammonium acetate (pH 5, 6, 7, or 8). The aqueous and organic solvents had the same acid and ammonium hydroxide content and were pumped separately in isocratic mode and mixed together in a 50-µL chamber (part of the Shimadzu system). At each pH, chromatograms were collected at five different organic solvent contents: 3%, 15%, 30%, 45%, and 60% (calculated from the ratio of flow rates). Two different HPLC columns were tested: Aquasil C18 (2.1-mm × 100-mm, 5-µm particle size, Thermo-Fisher Scientific, Waltham, MA) and SymmetryShield RP18 (2.1-mm × 150mm, 5-µm particle size, Waters, Milford, MA). After equilibration at each organic content, triplicate injections were made from the same vial on both columns. A switching valve was used to alternate automatically between columns. The first injection was regarded as an equilibration run, and only the later two injections of the triplicate were used to calculate average retention time, chromatographic peak width, and asymmetry factor. Evaluating LC–MS–MS system performance
To characterize the linearity of the chromatographic partitioning, we measured chromatographic peak asymmetry factors of each analyte chromatographic peak. The peak asymmetry factor (B/A) was calculated by the Analyst MS quantitation program (Applied Biosystems) that used the following formula:
each extract on both the SymmetryShield C18 and the Aquasil C18 analytical column (total of 96 injections at each QC concentration).
Results Effect of elution pH on MS ionization
To describe the efficiency of the chemical ionization, absolute mass spectrometry intensities were measured on continuous MRM signals during direct infusion of 250 ng/mL analyte with 20 µL/min, T-mixed with 200 µL/min flow of 15% methanol solution at varied pH. All three analytes ionized better as positive than negative ions. FTC and 3TC ionized ~ 20 and 10 times better, respectively, than TFV (Figure 3). Positive ionization was ~ 5 times better in formate than in acetate buffer. TFV ionized 3–4 times better in formate buffer at pH 3.2 than at 4.5. At pH 3.2, the positive ESI signal was somewhat weaker in 100mM than in 20mM formate buffer. Therefore, for optimal positive MS ionization, 20mM pH 3.2 formate buffer was preferred. Effect of mobile phase pH and organic content on chromatographic retention
We selected an acidic pH to enhance sensitivity, which led to chromatographic peak distortions. We had to develop a better understanding of the combined effect of mobile phase pH and organic content on the chromatographic behavior of the analytes to solve this problem. When the isocratic retention times of the three analytes were measured as a function of pH at 3%,
([Peak End Time] – [Retention Time]) B/A = ——————–––––––––––––––––––– ([Retention Time] – [Peak Start Time]) in which Peak End Time and Peak Start Time were determined after manually drawing lines from side to side at 10% of the height of each chromatographic peak. B/A < 1 indicated distortion at the peak front while B/A > 1 indicated peak tailing. Evaluating method performance
To assess the accuracy and precision of the final method, we made quintuplicate measurements of human plasma extracts spiked at known concentrations. Method accuracy (spiked concentration recovery) was calculated from average measured concentration divided by expected concentration. The limit of detection (LOD) and limit of quantitation (LOQ) were calculated from 3 times and 10 times the standard deviation extrapolated to 0 ng/mL concentration, respectively. The method precision was characterized by the intra- and inter-assay coefficient of variation (CV) calculated from 48 extractions acquired in 8 independent runs, injecting
Figure 2. Tube connection of the trap loading column switching system. Plumbing is in backward elution mode. In forward elution mode the Pump C port and the Analytical column/MS port were reversed.
367
Journal of Chromatographic Science, Vol. 47, May/June 2009
15%, and 30% methanol (Figure 4), we expected to see abrupt retention time increases near the pKa values, indicating the simultaneous presence of both protonated and neutral analyte species. The effect of pH was most evident at 3% methanol (Figure 4) over the pH range of 3.2–8. The retention time of TFV and 3TC (pKas of 3.6 and 4.6) increased significantly between pH values of 3.2 and 5, while that of FTC (pKa of 2.7) remained fairly constant. Above pH 6, TFV retention time decreased, consistent with deprotonation around its acidic pKa of 6.5.
The effect of the organic content on the protonation– deprotonation equilibrium could be observed from the different patterns of retention time (tR) vs. pH curves at 3%, 15%, and 30% methanol (Figure 4). At 3% and 15% methanol, both TFV and 3TC showed increased tR as the pH increased; at 30% methanol, only 3TC showed a change in tR. The diminishing effect of percent methanol content on the tR increases (Figure 4) proved that the organic content had a significant effect on the protonation pKa of TFV and 3TC with important consequences on sensitivity and chromatographic peak shape (see the “Discussion”). Effect of mobile phase pH and organic content on chromatographic peak symmetry
Retention time changes as a function of pH and organic content were also linked to changes in chromatographic peak symmetry. Our goal was to optimize B/A asymmetry factors to values between 1.0 and 2.0. We evaluated two HPLC columns that were designed for high aqueous conditions at which the silanol group activity and de-wetting of the silica support were suppressed by a hydrophilic water shield created by embedded polar groups (SymnmetryShield, Waters) or polar (OH) endcapping groups (Aquasil, ThermoFisher) near the silica surface. At pH 3.2, 5, 6, 7, and 8, a series of injections were made at 3%, 15%, 30%, 45%, and 60% methanol alternating between the two columns. For FTC, B/A values were in the range of 1–2 regardless of percent methanol and pH. In contrast, TFV showed wide variation in chromatographic peak symmetry, B/A = 1.5–5.5 (Figure 5). At pH 3.2 the B/A for TFV increased from 1.5 to 4, while at pH 8 it decreased from 5.5 to 1.5. At pH 5, 6, and 7, the B/A of TFV remained somewhat high (1.8–3.5) but relatively stable. 3TC chromatographic peaks showed leading-edge distortions and splitting at pH 3.2 and 3% methanol (B/A < 1), whereas the chromatographic peaks remained fairly symmetrical at 15% and 30% methanol and showed progressive tailing when the percentage of methanol was greater than 30% (B/A > 2). Chromatographic peak distortions followed similar trends with acetonitrile but were more extreme (data not shown). Figure 3. Signal intensity of fragment ions for FTC, TFV, and 3TC at different pH and ammonium formate concentrations in 15% methanol.
Effect of buffer and column type on chromatographic peak shape
In general, B/A values determined at 10% of the chromatographic peak height underestimated the actual degree of peak distortions. At B/A < 1 and B/A > 2, TFV chromatographic peak distortions were visually more extreme; tailing continued for 2–3 min after the signal returned to < 10% of the peak height. The TFV chromatographic peak tailing was not concentration dependent but was observed even at very low concentration. The 3TC chromatographic peak also showed leading-edge distortions and splitting below the 10% peak height, however, this effect was concentration dependent and less extreme Figure 4. Effect of pH on the retention time of FTC, TFV, and 3TC measured using isocratic at low 3TC concentration. mobile phase methanol concentration at 3% (left), 15% (middle), and 30% (right) on SymWhile TFV chromatographic peak tailing metryShield analytical column (150 mm × 2.1 mm, 5 µm particle size). could be minimized with pH of ~ 3 and < 30%
368
Journal of Chromatographic Science, Vol. 47, May/June 2009
methanol content, 3TC chromatographic peak distortion could only be influenced by selecting the HPLC column and buffer additives. At 3% methanol, 3TC chromatographic peak distortion was more extreme using the polar end-capped Aquasil column (B/A < 1) than using the polar-embedded SymmetryShield column. To evaluate the effect of the buffer on 3TC chromatographic peak shape, a series of analyses was carried out using the Aquasil column and gradient elution programs with varied maximum methanol concentrations (Figure 6). Three buffers were compared: 20mM formic acid (pH 2.9); 20mM ammonium formate (pH 3.2); and 20mM–20mM mixture of formate–acetate (pH set to 3.2 using ammonium hydroxide). The best chromatographic peak shape was achieved with the formate–acetate buffer mix. With the formic acid or formate buffer, the 3TC chromatographic peaks consistently showed B/A < 1 values and splitting.
switching system described earlier (Figure 2). Backward elution means that the flow eluting the analytes from the SPE column to the analytical column moves in the opposite direction relative to the flow during sample loading (in contrary to forward elution, which means elution in the same direction). Turning from forward to backward elution mode requires manual reversal of only two ports (Figure 2). The trapping column had SymmetryShield packing because it provided stronger analyte retention than the Aquasil packing. Figure 7 shows chromatograms obtained from forward and backward eluting to SymmetryShield and Aquasil analytical columns. We achieved somewhat better chromatographic peak shapes with polar-embedded SymmetryShield column than with Aquasil column.
Effect of trap loading using column switching
Discussion
The equilibrium of analyte partitioning between the stationary and mobile phases was significantly affected by the injection solution pH and organic content. To minimize this effect, the volume of the alcoholic plasma supernatants was reduced from 300 µL to 10–20 µL by evaporation followed by dilution with 100% aqueous buffer (solvent A) to 50 µL. A 10µL portion of this resulting solution was then injected for each analysis. However, adequate extract-to-extract reproducibility was still difficult to achieve, especially for long analytical runs when an entire 96-well plate with unknown plasma samples was extracted in the same batch. The chromatographic peak distortions caused by injection matrix inconsistencies were minimized further by trap loading and eluting with a backward flow to the analytical column using the column
Figure 5. Effect of isocratic mobile phase methanol content and pH on the B/A of TFV on SymmetryShield and Aquasil C18 analytical columns measured at 10% of the peak height.
Relationship between chromatographic behavior and pKa of NRTIs
In reverse-phase chromatography, ionizable compounds are expected to have longer retention times in their neutral form than in their protonated, cationic forms or deprotonated, anionic forms. There is an intermediate pH range around the pKa of the compound where the retention time versus pH curve goes through a relatively abrupt inflection point. Knowledge of this pH is important; around the inflection point, the equilibrium state of the phase partitioning is very sensitive to small changes in pH and organic content, manifests in chromatographic peak distortions, and, consequently, affects method reproducibility. FTC, 3TC, and TFV have important structural differences affecting their N3 and N7 nitrogen base protonation pKas. In aqueous media, FTC, with its fluorinated cytosine N3, has a relatively low pKa of 2.7 (16), while its nonfluorinated analog, 3TC has a cytosine N3 with a pKa of 4.6 (17). TFV is a Zwitterion with two pKas, one basic pKa of 3.7 for adenosine N7 and an acidic pKa of 6.5 for its phosphonyl group (16). Our measured tR vs. pH curves followed the patterns that were expected based on these pKas (Figure 4). In general, we expected MS–MS detection to have an orderof-magnitude better sensitivity compared to traditional detec-
Figure 6. Effect of mobile phase buffer composition on the peak asymmetry (B/A 0.05) measured at 5% of the peak height for 3TC.
369
Journal of Chromatographic Science, Vol. 47, May/June 2009
tion methods such as UV. However, for basic analytes and especially Zwitterions (such as TFV), the superior sensitivity of the MS–MS detection was only realized at acidic pH and low ionic strength of the mobile phase (12,18). Therefore, our approach to maximize MS–MS sensitivity was to use low pH and ionic strength while overcoming expected chromatographic difficulties by carefully optimizing mobile phase additives. Applying low pH was necessary also to minimize TFV chromatographic peak tailing. Because TFV has pKas at 3.6 and 6.5, it is expected to be present as a mixture of neutral and charged species at any pH between 3 and 8. We observed persistent concentration-independent tailing of TFV chromatographic peaks, even at pH 5 and 7 (Figure 5), indicating that the neutral form of TFV interacted with the stationary phase through strong secondary interactions. As reported (6), secondary interactions of TFV in its neutral form can be minimized by increasing the ionic strength of the mobile phase. Also as reported (6), TFV peak distortion was minimized with hydroxylammmonium acetate buffer at pH 7; however, this buffer and pH may have contributed to the relatively high 90-ng/mL LOQ for TFV. Secondary interactions because of the presence of the TFV neutral form can be also minimized by protonation. The TFV chromatographic peak tailing was reported here and elsewhere (3) to be less extreme at low pH. Finally, secondary interactions can be minimized by suppressing free silanol group activity, by using highly end-capped, difunctionallybonded C18 stationary phase (Atlantis dC18, Waters) (6), or with a polar-end-capped column (Sinergi, Phenomenex) (3). We also achieved good chromatographic peak shape with polarend-capped (Aquasil) and polar-embedded (SymmetryShield) C18 columns.
concentration must be considered. In general, the pKa of bases decreases while the pKa of acids increases with the addition of organic solvent. Relative to 100% aqueous solution, the pKas of acetate and formate buffers in 50% methanol are 0.62 and 0.77 units higher, respectively (19). Although the organic content does not significantly affect the pKas of nitrogen-protonated heterocyclic bases (such as NRTIs) (19), it will affect the buffer pH relative to the analyte pKa. At pH 3.2, near the basic pKa of TFV, the organic content will affect the protonation state of TFV during the 0–30% organic mobile phase gradient because the buffer pH will shift from < pKa to > pKa of TFV. Our experimental data confirmed these estimations. At < 30% methanol, significant changes occurred in the TFV retention time as a function of pH; at ≥ 30% methanol the change was negligible (Figure 4). Additional evidence of the shift in pH versus TFV pK a was the change in the TFV chromatographic peak shape (Figure 5). At pH 3.2, increasing percent methanol resulted in greater chromatographic peak tailing. We attributed this effect to the increase of the neutral form of TFV and concluded that methanol content of < 30% should be used to minimize TFV chromatographic peak tailing. Minimizing chromatographic peak distortions by increasing buffer capacity and ion pairing
While acidic pH gave optimum TFV chromatographic peak shapes, this condition distorted the chromatographic peaks of 3TC, either splitting peaks with B/A < 1 or yielding tailing peaks with B/A > 2. Such concentration-dependent peak distortions are commonly observed with fully protonated basic compounds and interpreted as signs of sample overload (9,10). These peak distortions occur because of the limited pKa of NRTIs and mobile phase pH in the number of binding sites for charged species on non-polar presence of methanol reverse phase stationary phases. At surface concentrations When basic compounds are analyzed at acidic pH, the depengreater than a critical level, charged molecules start to repel dence of both buffer and analyte pKa on the organic solvent each other. In such cases, increasing buffer capacity may provide a solution (6,9,10). Therefore, although ESI was more effective with formic acid alone, we used ammonium formate at pH 3.2 because of its higher buffer capacity. In addition to determining buffer capacity, buffer anions can also improve column capacity by forming ion-pairs with the positively charged analytes, facilitating binding to the non-polar stationary phase. The ion-pair binding effect is weak with formate buffer but can be significant with acetate (10). Solid-phase extraction of 3TC was reported to be enhanced by acetate (7). Therefore, we compared formate buffer with formate–acetate buffer at pH 3.2 and showed the positive effect of acetate ions on the chromatographic peak shape of 3TC (Figure 5). Thus, in our final method Figure 7. Comparison of chromatograms collected with forward elute and backward elute after we used a 20-mM/20-mM mix of formate– trap loading on SymmetryShield column using Aquasil (A and B) and SymmetryShield (C and acetate with the pH set to 3.2 with ammoD) as analytical columns; FTC (green), TVF (red), and 3TC (blue). nium hydroxide.
370
Journal of Chromatographic Science, Vol. 47, May/June 2009
Chromatographic peak focusing by trap loading
In spite of carefully optimizing mobile phase parameters, we saw a varying degree of chromatographic peak distortions for all three analytes if the pH and methanol content were higher in the injection matrix than in the loading mobile phase. As expected, 3TC and TFV were more sensitive to this mobile phase interference than FTC. Trap loading with backward- flow elution circumvented this problem. Trap loading is a mode of sample injection commonly used with nanoflow and lab-on-a-chip systems and can be used in a variety of ways. For this method, using a binary pump for the sample loading and an isocratic pump for the analytical elution provided stable isocratic conditions during the analytical separation while allowing regeneration of the loading column and the injector lines by a methanol gradient. Because the isocratic pump was connected so that the analytes were eluted from the trapping column to the analytical column with a backward flow, the 3TC and TFV bands that suffered irregular dispersion during sample loading were refocused during elution. Figure 7 demonstrates that trap loading with backward elution had an advantageous effect on the chromatographic peak shapes and signal-to-noise ratio of all three analytes. In addition, due to shorter migration paths on the trapping column during backward vs. forward elution, the analyte retention times were shorter allowing for higher analytical throughput. Nevertheless, removing methanol by evaporation and adjusting the pH by addition of loading buffer remained very important. Evaluation of method performance
The most important indicators of our success in finding optimal balance between MS–MS detection and chromatographic separation are method sensitivity, accuracy, and precision, as determined by the LOD, spiked concentration recovery, and CV, respectively (Table I and II). We achieved
method LODs of 1–2 ng/mL (10–20 pg on column) simultaneously for all three analytes in spite of their very different pKas. We achieved these method LODs while using only 100 µL of plasma as is typically available in macaque trials. For FTC and TFV, 90–103% calibration accuracy was maintained in a wide range of 5–2000 ng/mL (Table I). For 3TC, calibration accuracy at 5 ng/mL was in a somewhat wide percent range, which can be explained by the lack of labeled internal standard. Both intra- and inter-assay CVs were 5–15% in the high ng/mL range and 16–20% in the low ng/mL range for all three analytes (Table II). This level of precision and robustness was maintained in a high throughput 96-well sample preparation format.
Summary This article describes our efforts to implement a robust, sensitive, and reproducible HPLC–MS–MS method for simultaneously measuring three NRTIs with a wide range of pKas. The key to successfully developing this method was understanding the influence of analyte protonation–deprotonation equilibrium on chromatographic behavior with an emphasis on considering the effect of organic solvent on mobile phase pH and analyte pKa. We enhanced the reproducibility even further by using a trap-loading column switching technique with backward elution. The final method was accurate over a wide range of 1–3000 ng/mL with CVs from 5% to 21%; therefore, the method can be applied for monitoring both low and high ng/mL plasma levels for optimizing oral or alternative PreEP intervention strategies.
References
1. J.G. Garcia-Lerma, R.A. Otten, S.H. Qari, E. Jackson, M.E. Cong, S. Masciotra, W. Luo, C. Kim, D.R. Adams, M. Monsour, J. Lipscomb, J.A. Johnson, D. Delinsky, R.F. Schinazi, Accuracy, Percent (± RSD) R. Janssen, T.M. Folks, W. Heneine. Prevention of rectal SHIV transmission in macaques by daily or intermittent prophylaxis LOD* LOQ* 5 500 2000 with emtricitabine and tenofovir. Plos Med 5: 291–99 (2008). Analyte (ng/mL) (ng/mL) (ng/mL) (ng/mL) (ng/mL) 2. S. Subbarao, R.A. Otten, A. Ramos, C. Kim, E. Jackson, M. Monsour, D.R. Adams, S. Bashirian, J. Johnson, FTC 1.68 5.6 103 ± 14 90 ± 3 99 ± 5 V. Soriano, A. Rendon, M.G. Hudgens, S. Butera, R. Janssen, TFV 1.32 4.4 96 ± 13 93 ± 3 98 ± 6 L. Paxton, A.E. Greenberg, and T.M. Folks. Chemoprophylaxis with tenofovir disoproxil fumarate provided partial protection 3TC 2.10 7.0 144 ± 13 106 ± 7 89 ± 7 against infection with simian human immunodeficiency virus in * LOD = limit of detection and LOQ = limit of quantitation. macaques given multiple virus challenges. J. Infect. Dis. 194: 904–11 (2006). 3. T. Delahunty, L. Bushman, C. Fletcher. Sensitive assay for determining plasma tenofovir Table II. Percent Coefficient of Variation concentrations by LC/MS/MS. J. Chromatog.r B Analyt. Technol. Biomed. Life Sci. 830: 6–12 FTC* TFV† 3TC‡ (2006). Concentration 4. A. Volosov, C. Alexander, L. Ting, and level of Intra-assay Inter-assay Intra-assay Inter-assay Intra-assay Inter-assay S.J. Soldin. Simple rapid method for quantifiquality controls N=6 N=8 N=6 N=8 N=6 N=8 cation of antiretrovirals by liquid chromatography–tandem mass spectrometry. Clin. 10 ng/mL 18 16 16 20 18 18 Biochem. 35: 99–103 (2002). 5. C. Bennetto-Hood, M.C. Long, E.P. Acosta. 350 ng/mL 15 6 10 6 10 10 Development of a sensitive and specific liquid 700 ng/mL 10 7 11 5 11 11 chromatography/mass spectrometry method
Table I. Method Sensitivity, Accuracy, and Precision
371
Journal of Chromatographic Science, Vol. 47, May/June 2009
6.
7.
8.
9.
10.
11.
12.
372
for the determination of tenofovir in human plasma. Rapid Commun. Mass Spectrom. 21: 2087–94 (2007). V. Bezy, P. Morin, P. Couerbe, G. Leleu, and L. Agrofoglio. Simultaneous analysis of several antiretroviral nucleosides in rat-plasma by high-performance liquid chromatography with UV using acetic acid/hydroxylamine buffer Test of this new volatile medium-pH for HPLC-ESI-MS/MS. J. Chromatogr. B Analyt. Technol. Biomed. Life Sci. 821: 132–43 (2005). K.B. Kenney, S.A. Wring, R.M. Carr, G.N. Wells, and J.A. Dunn. Simultaneous determination of zidovudine and lamivudine in human serum using HPLC with tandem mass spectrometry. J. Pharm. Biomed. Anal. 22: 967–83 (2000). A.K. Gehrig, G. Mikus, W.E. Haefeli, and J. Burhenne. Electrospray tandem mass spectroscopic characterisation of 18 antiretroviral drugs and simultaneous quantification of 12 antiretrovirals in plasma. Rapid Commun. Mass Spectrom. 21: 2704–16 (2007). D.V. McCalley. Comparison of an organic polymeric column and a silica-based reversed-phase for the analysis of basic peptides by high-performance liquid chromatography. J. Chromatogr. A 1073: 137–45 (2005). D.V. McCalley. Study of overloading of basic drugs and peptides in reversed-phase high-performance liquid chromatography using pH adjustment of weak acid mobile phases suitable for mass spectrometry. J. Chromatogr. A 1075: 57–64 (2005). E. Bosch, P. Bou, H. Allemann, M. Roses. Retention of ionizable compounds on HPLC. pH scale in methanol-water and the pK and pH values of buffers. Anal. Chem. 68: 3651–57 (1996). D.V. McCalley. Comparison of peak shapes obtained with volatile
13. 14.
15.
16. 17. 18.
19.
(mass spectrometry-compatible) buffers and conventional buffers in reversed-phase high-performance liquid chromatography of bases on particulate and monolithic columns. J. Chromatogr. A 987: 17–28 (2003). J. Nawrocki. The silanol group and its role in liquid chromatography. J. Chromatogr. A 779: 29–71 (1997). M. Roses, F.Z. Oumada, and E. Bosch. Retention of ionizable compounds on high-performance liquid chromatography VII. Characterization of the retention of ionic solutes in a C-18 column by mass spectrometry with electrospray ionization. J. Chromatogr. A 910: 187–94 (2001). J.W. Dolan. LC/GC resource guide. LC troubleshooting. A five year compilation. Peak shape, and resolution problems. LC/GC: 177–213 (2007). Gilead Sciences. Truvada. Prescription information http://www. gilead.com/pdf/truvada_pi.pdf (2007). GlaxoSmithKline. Combivir. Prescription information http:// us.gsk.com/products/assets/us_combivir.pdf (2007). D.V. McCalley. Study of overloading of basic drugs and peptides in reversed-phase high-performance liquid chromatography using pH adjustment of weak acid mobile phases suitable for mass spectrometry. J. Chromatogr. A 1075: 57–64 (2005). S. Espinosa, E. Bosch, and M. Roses. Retention of ionizable compounds on HPLC. 5. pH scales and the retention of acids and bases with acetonitrile-water mobile phases. Anal. Chem. 72: 5193–5200 (2000). Manuscript received May 13, 2008; revision received July 17, 2008.