One might estimate x and the channel signal vector h from z using the MAP rule as. {x, h} = arg max x,h p(x,h|z,θ). (3.2). Instead, we jointly estimate the signal, ...
Joint Deconvolution and Classification: Classifiers for Dataset Shift Induced by Linear Systems
Hyrum S. Anderson
A dissertation submitted in partial fulfillment of the requirements for the degree of
Doctor of Philosophy
University of Washington
2010
Program Authorized to Offer Degree: Department of Electrical Engineering
University of Washington Graduate School
This is to certify that I have examined this copy of a doctoral dissertation by Hyrum S. Anderson and have found that it is complete and satisfactory in all respects, and that any and all revisions required by the final examining committee have been made.
Chair of the Supervisory Committee:
Maya R. Gupta
Reading Committee:
Les E. Atlas Maya R. Gupta John D. Sahr
Date:
In presenting this dissertation in partial fulfillment of the requirements for the doctoral degree at the University of Washington, I agree that the Library shall make its copies freely available for inspection. I further agree that extensive copying of this dissertation is allowable only for scholarly purposes, consistent with “fair use” as prescribed in the U.S. Copyright Law. Requests for copying or reproduction of this dissertation may be referred to Proquest Information and Learning, 300 North Zeeb Road, Ann Arbor, MI 48106-1346, 1-800-521-0600, to whom the author has granted “the right to reproduce and sell (a) copies of the manuscript in microform and/or (b) printed copies of the manuscript made from microform.”
Signature
Date
University of Washington Abstract
Joint Deconvolution and Classification: Classifiers for Dataset Shift Induced by Linear Systems Hyrum S. Anderson Chair of the Supervisory Committee: Professor Maya R. Gupta Department of Electrical Engineering A basic assumption underlying traditional supervised learning algorithms is that labeled examples used to train a classifier are indicative of (drawn i.i.d. from the same distribution as) the test sample. However, a common problem in signal processing violates this assumption: given clean training examples, classify a signal that has propagated through a noisy linear time-invariant system. This traditional signal processing problem is recast as a dataset shift problem for machine learning, in which training and test distributions differ. Joint deconvolution and classification is proposed as a system-optimized framework for classifying a channel-corrupted signal from clean training features. In particular, classifiers are designed to account for the convolution relationship between test and training distributions. The joint MAP classifier jointly estimates a clean signal and a class label from a multipath-corrupted signal. The joint QDA classifier probabilistically accounts for the convolution relationship, and is extended for use with subband energy features. A set of kernels are proposed that measure similarity between a clean training signal and a corrupted test signal, and their use for channel-robust SVMs is proposed. With a focus on passive acoustic classification for multipath-corrupted signals, classifiers are tested in experiments to classify simulated narrowband acoustic signals, to identify Bowhead whales from their vocalizations in shallow water, and to acoustically identify trumpeters in a reverberant environment.
TABLE OF CONTENTS Page List of Figures . . . . . . . . . . . . . . . . . . . . . . . . . . . . . . . . . . . . . . . . iii List of Tables . . . . . . . . . . . . . . . . . . . . . . . . . . . . . . . . . . . . . . . . .
v
Chapter 1:
1
Dataset Shift from Linear Time-Invariant Systems . . . . . . . . . . .
1.1
Scope of Research
. . . . . . . . . . . . . . . . . . . . . . . . . . . . . . . . .
3
1.2
Background . . . . . . . . . . . . . . . . . . . . . . . . . . . . . . . . . . . . .
6
1.3
Outline of Thesis . . . . . . . . . . . . . . . . . . . . . . . . . . . . . . . . . . 13
Chapter 2:
Related Work . . . . . . . . . . . . . . . . . . . . . . . . . . . . . . . . 15
2.1
Classifying Signals Corrupted by Multipath . . . . . . . . . . . . . . . . . . . 15
2.2
Invariant Classifiers . . . . . . . . . . . . . . . . . . . . . . . . . . . . . . . . . 17
Chapter 3:
Signal-based Joint Deconvolution and Classification . . . . . . . . . . . 20
3.1
Joint MAP Deconvolution and Classification . . . . . . . . . . . . . . . . . . . 21
3.2
Probabilistic Deconvolution and Classification Using QDA . . . . . . . . . . . 25
3.3
Experiments: Signal-based Joint QDA and Joint MAP Classification . . . . . 27
3.4
Conclusions . . . . . . . . . . . . . . . . . . . . . . . . . . . . . . . . . . . . . 30
Chapter 4:
Joint QDA for Subband Energy Features . . . . . . . . . . . . . . . . . 33
4.1
Joint QDA Using Second Order Statistics of Subband Energy . . . . . . . . . 34
4.2
Local Joint QDA . . . . . . . . . . . . . . . . . . . . . . . . . . . . . . . . . . 35
4.3
Experiments: Feature-based Classification of Simulated Signals . . . . . . . . 37
4.4
Conclusions . . . . . . . . . . . . . . . . . . . . . . . . . . . . . . . . . . . . . 41
Chapter 5:
Channel-Robust Kernels for Support Vector Machines . . . . . . . . . 43
5.1
Expected Kernels . . . . . . . . . . . . . . . . . . . . . . . . . . . . . . . . . . 47
5.2
Projected RBF Kernels . . . . . . . . . . . . . . . . . . . . . . . . . . . . . . 52
5.3
Conclusions . . . . . . . . . . . . . . . . . . . . . . . . . . . . . . . . . . . . . 58 i
Chapter 6: Classifying Sounds in Reverberant Environments . . . . . . 6.1 Experimental Details . . . . . . . . . . . . . . . . . . . . . . . . . . 6.2 Classifying Narrowband Acoustic Signals in Simulated Bathymetry 6.3 Classifying Bowhead Whale Songs in Shallow Water . . . . . . . . 6.4 Classifying Trumpeters in Reverberant Environment . . . . . . . . 6.5 Summary of Experimental Results . . . . . . . . . . . . . . . . . . 6.6 Conclusion . . . . . . . . . . . . . . . . . . . . . . . . . . . . . . .
. . . . . . .
. . . . . . .
. . . . . . .
. . . . . . .
. . . . . . .
. . . . . . .
59 60 61 65 67 72 73
Chapter 7: Extensions 7.1 Contributions . . 7.2 Limitations . . . 7.3 Future Work . .
. . . .
. . . .
. . . .
. . . .
. . . .
. . . .
75 75 77 78
and Conclusions . . . . . . . . . . . . . . . . . . . . . . . . . . . . . .
. . . .
. . . .
. . . .
. . . .
. . . .
. . . .
. . . .
. . . .
. . . .
. . . .
. . . .
. . . .
. . . .
. . . .
. . . .
. . . .
. . . .
. . . .
Bibliography . . . . . . . . . . . . . . . . . . . . . . . . . . . . . . . . . . . . . . . . . 84 Appendix A: Useful Identities . . . . . . . . . . . . . . A.1 Convolution and Hadamard Product of Vectors A.2 Convolution and Hadamard Product of Tensors A.3 Proper White Gaussian RVs . . . . . . . . . . . A.4 Product of Gaussians Identity . . . . . . . . . .
. . . . .
. . . . .
. . . . .
. . . . .
. . . . .
. . . . .
. . . . .
. . . . .
. . . . .
. . . . .
. . . . .
. . . . .
. . . . .
. . . . .
. . . . .
. . . . .
. . . . .
89 89 89 90 90
Appendix B: Derivations . . . . . . . . . . . . . . . . . . . . . . . . . . . . . . . . . 91 B.1 Derivation of Covariance of Uz . . . . . . . . . . . . . . . . . . . . . . . . . . 91 B.2 Derivation of Expected RBF for Dependent Uzi and Uzj . . . . . . . . . . . . 93
ii
LIST OF FIGURES Figure Number 1.1
1.2
1.3
Page
Typical supervised learning classification setup. The task is to classify a feature vector x extracted from the signal x[n] given labeled (+ or −) training samples {(xi , yi )}N i=1 . The test feature x and its true label are assumed to be independent and identically distributed with {(xi , yi )}N . . . . . . . . . . i=1 .
2
Depiction of problem setup for dataset shift induced by a linear time-invariant system. The task is to classify feature vector z extracted from the signal z[n]. Features x of the unknown test signal x[n] are not given, however x and its true label y ∗ are drawn i.i.d. from same distribution pXY as training pairs {(xi , yi )}N i=1 . Likewise, the unknown feature vector h of the true impulse response h[n] is independent and identically distributed with auxiliary channel samples {hi }M i=1 . . . . . . . . . . . . . . . . . . . . . . . . . . . . . . . . . . .
2
Underwater passive acoustic classification is complicated in shallow-water environments by multipath channels. Water may be considered shallow when the ocean depth is shallowed compared to the observation distance. The multipath impulse response depends on source and receiver location, surface interactions that vary with wind speed (surface) and sediment composition (bottom), and the sound speed profile of the water column. . . . . . . . . . .
7
3.1
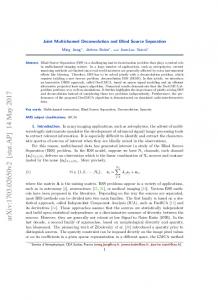
Example multipath realization from the k-sparse model (stem), and the deconvolution estimate produced by the joint MAP deconvolution/classifier (solid) at 10 dB SNR. . . . . . . . . . . . . . . . . . . . . . . . . . . . . . . . 27
3.2
Classification accuracy for four experiments using multipath generated from a Laplacian model in (a) and (b), and a k-sparse model in (c) and (d). The results are averaged over 1000 i.i.d. test signals for each SNR point. . . . . . 30
3.3
Classification accuracy for four experiments using multipath generated from a sparse model. The results are averaged over 500 i.i.d. test signals for each SNR. . . . . . . . . . . . . . . . . . . . . . . . . . . . . . . . . . . . . . . . . 31
4.1
(a) Pole-zero plot showing the mean location of the poles for class 1 (×) and class 2 (∗) for the easy case, and (b) scatter-plot of the classes in log-feature space. . . . . . . . . . . . . . . . . . . . . . . . . . . . . . . . . . . . . . . . . 38
4.2
(a) Simulated ocean bathymetry with a single receiver (marked by ) at (0, 0, −50) m, and (b) a sample channel impulse response for a source located at (460, 250, −70) m, generated by the Sonar Simulation Toolset [25]. . . . . . 40 iii
4.3
Results for feature-based classification on simulated data. . . . . . . . . . . . 42
6.1
SVM training time vs. training set size N for fixed M = 20 used in the simulation experiment. Timing results include the time required to populate the kernel matrix. . . . . . . . . . . . . . . . . . . . . . . . . . . . . . . . . . Classification accuracy of simulated signals in simulated bathymetry using subband energy features. The datasets hard, medium and easy differ in how well the classes are separated in feature space. Note that the accuracy axis for each plot is on a different scale in order to highlight the relative performance of algorithms. RBF SVM (agnostic) achieves an accuracy of 50% for all SNR in each experiment, and is not shown. . . . . . . . . . . . . . . . . . . . . . . Spectrograms of whale song-endnotes for (a) the first Bowhead whale and (b) the second Bowhead whale. The vocalizations of the second whale tend to be more variable, cover a greater dynamic range, and contain stronger harmonic components than the first whale. Notice that the vocalization in (a) contains interfering calls from a bearded seal from about 800 to 1200 Hz. . . . . . . . Classification accuracy for identifying Bowhead whales in simulated bathymetry by using subband energy features of the end-notes of their songs. RBF SVM (agnostic) achieves an accuracy of 48% ± 1% for all SNR, and is not shown. . (a) Matthew Swihart on trumpet and (b) Edward Castro on cornet in an anechoic chamber. . . . . . . . . . . . . . . . . . . . . . . . . . . . . . . . . . (a) The energy spectrum of concert F played by Ed on the cornet in the anechoic chamber; (b) the energy spectrum of a test signal generated by playing back the recorded note in an echo chamber; and (c) an impulse response estimated by probing the outdoor breezeway with a quadratic chirp. . . . . . Training (upper right) and test features (lower left)—corresponding to subband energies at fundamental and first harmonic—plotted together on a loglog plot, where Ed Cornet is denoted by - and Matt Trumpet is denoted by +. . . . . . . . . . . . . . . . . . . . . . . . . . . . . . . . . . . . . . . . . . . .
6.2
6.3
6.4
6.5 6.6
6.7
7.1
63
64
66
67 68
69
70
Depiction of the problem setup for robust x-space classifiers, in which the labeled training examples (+ and –) are used to infer the class label of a distribution over deconvolution estimates, p(x|z), represented by its mean (marked ?) and standard deviation contours. . . . . . . . . . . . . . . . . . . 80
iv
LIST OF TABLES Table Number
Page
1.1
Notation used in this thesis. . . . . . . . . . . . . . . . . . . . . . . . . . . . .
3.1
Simulation parameters for joint MAP / joint QDA experiments. Note that square[n] = sgn(sin[n]). . . . . . . . . . . . . . . . . . . . . . . . . . . . . . . . 28
4.1
Pole Magnitude Distribution for Feature-based Classification Experiments . . 39
5.1
Expected and Projected RBF Kernels for Randomly Filtered Discrete-time Signals . . . . . . . . . . . . . . . . . . . . . . . . . . . . . . . . . . . . . . . . 44 Expected and Projected RBF Kernels for Randomly Filtered Images . . . . . 45 Expected and Projected RBF Kernels for Subband Energies of Randomly Filtered Signals . . . . . . . . . . . . . . . . . . . . . . . . . . . . . . . . . . . 46
5.2 5.3 6.1
4
Trumpet Playback Results Averages. Bolded items in each column are statistically tied with 95% confidence using a one-sided Wilcoxon sign rank test. 71
v
ACKNOWLEDGMENTS
Perhaps the greatest gift a teacher can give to a student is the sense of complete enjoyment that comes from immersion in the subject being taught. Dr. Henry Eyring, chemist
The start of my studies at UW coincided with other significant changes. Nicole and I left our careers in Boston to move to Seattle. Our first son was born during midterms of my first quarter, and our second followed two-and-a-half years later. First and foremost I thank Nicole and our two sons, Scott and James, for their support in this life-changing adventure. Having my family to come home to during graduate school brought purpose to my studies and richness to my life. Additionally, I cannot discount the influence of my father and mother who have offered a lifetime of encouragement and determination to overcome challenges. Likewise, my wife’s parents and family have shown unfeigned interest and support in my studies; it’s been a great comfort to live in close proximity to them. I am thankful for the mentorship provided by my adviser, Maya Gupta. She introduced me to key concepts in this thesis, partnered in the development of the many ideas, and encouraged my exploration in others. I admire the investment she places in her students, providing us opportunities for ownership, leadership, scholarship, and friendship. Because of this, her research lab has attracted the best colleagues that a student can hope for. Additional thanks to my committee, to friends in the Information Design Lab, and to Dr. Henry Eyring—whose quotable wisdom begins each chapter—for shaping this thesis.
vi
1
Chapter 1 DATASET SHIFT FROM LINEAR TIME-INVARIANT SYSTEMS Like any other honest man, I am obliged to accept only the truth. Dr. Henry Eyring, chemist
Classification methods predict the class membership of a test feature vector x given a set of labeled training feature vectors {(xi , yi )}N i=1 (see Figure 1.1). For instance, in handwritten digit classification the vector xi may be a vector of pixel intensities of the ith example image, the label yi signifies the digit represented by the image, and a classifier must determine which digit is represented by the pixel intensities of x. For most supervised learning algorithms, the underlying assumption is that the training samples {xi }N i=1 are similar to any new test sample x that might be observed, so that an algorithm trained on {(xi , yi )}N i=1 can be used to make a reasonable prediction about the label of x. However, there are many applications in which the training samples differ significantly from the test sample. For example, automatic speech recognition systems may be trained in a certain acoustic environment, but the environment at test time is not guaranteed to match the training conditions [8, 54]. Or, consider an underwater acoustics scenario, in which training samples of target are acquired in the deep ocean water, but the classifier is deployed in a shallow-water environment, where the test samples are corrupted by multipath and interference [2, 44]. As another example, face recognition methods must sometimes account for the fact that a test image was acquired from a low-quality camera, but the database of training images is high-resolution [26]. Each of these examples violates the default assumption in supervised learning, that a test sample x and its true label y ∗ are drawn i.i.d. from the same underlying joint distribution pXY as the training pairs {(xi , yi )}N i=1 . A mismatch between the test and training distributions is known as dataset shift [53]. If the training distribution pXY differs from the test distribution arbitrarily, then one
2
training features
+ + test feature vector ++ + + + -?
- -- -
Figure 1.1: Typical supervised learning classification setup. The task is to classify a feature vector x extracted from the signal x[n] given labeled (+ or −) training samples {(xi , yi )}N i=1 . The test feature x and its true label are assumed to be independent and identically distributed with {(xi , yi )}N i=1 .
test features
?
channel features
training features
+ + ++ + + + -?
- -- - -
Figure 1.2: Depiction of problem setup for dataset shift induced by a linear time-invariant system. The task is to classify feature vector z extracted from the signal z[n]. Features x of the unknown test signal x[n] are not given, however x and its true label y ∗ are drawn i.i.d. from same distribution pXY as training pairs {(xi , yi )}N i=1 . Likewise, the unknown feature vector h of the true impulse response h[n] is independent and identically distributed with auxiliary channel samples {hi }M i=1 .
3
cannot hope to learn a classifier from training data that generalizes well to the test data. However, each of the examples above arises from a case where the training samples and test samples are related by an unknown linear time-invariant system and additive noise. This thesis addresses the dataset shift problem induced by a noisy time-invariant channel. Formally, training samples {xi }N i=1 are extracted from critically sampled time signals {xi [n]}N i=1 , and a test feature vector z is extracted from the signal z[n] = h[n] ∗ x[n] + w[n],
(1.1)
where ∗ denotes convolution, h[n] is the unknown impulse response of the unknown system, x[n] is the unknown signal of interest, and w[n] is a noise realization. Features x of the unknown test signal x[n] are not known, however, it is assumed that x and its true label y ∗ are drawn i.i.d. from the same distribution as the training pairs {(xi , yi )}N i=1 . It is assumed that the labels {yi }N i=1 represent one of two classes, yi = −1 or yi = 1. In addition, it is assumed that a finite set of unlabeled auxiliary samples {hi }M i=1 are available, and that the unknown features h of the h[n] in (1.1) are drawn i.i.d. from the same joint distribution as {hi }M i=1 . (Throughout this thesis, bold-face x denotes a vector, regular-face x denotes a scalar; random vectors and scalars are uppercase and written as X and X, respectively; refer to Table 1.1 for a summary of the key notation used in this thesis.) M The feature vectors z, {xi }N i=1 and {hi }i=1 may, for example, consist of samples of a
signal, pixel intensities, wavelet coefficients, cepstral coefficients, or the energy in selected frequency bins. No matter the choice of features, it is clear that in general pZY 6= pXY : the test distribution has shifted from the training distribution because of the noisy linear time-invariant channel. 1.1
Scope of Research
The novel aspects of this thesis lie at the fruitful intersection of signal processing and machine learning. This thesis presents a machine learning setup (see Figure 1.2) to a wellknown problem in signal processing, and therein formally defines a previously unpublished flavor of dataset shift. Then, several classifiers are presented to address the dataset shift induced by a noisy time-invariant system.
4
Table 1.1: Notation used in this thesis. x[n] x xf [k] xf ux [k]
discrete-time signal generic feature vector (discrete-time signal vector where noted) DFT of x[n] DFT signal vector subband energy |xf [k]|2
ux
subband energy vector
X
random vector
¯ X
mean of X
N
# of training samples
M
# of auxiliary channel examples
d N (x; m, A) a∗b A ∗ ∗B A·B [A] [B]
# of feature dimensions Gaussian in x with mean m and covariance A discrete convolution sum of the vectors a and b two-dimensional convolution of matrices A and B Hadamard (elementwise) multiplication: C = A · B ↔ Cij = Aij Bij Hadamard division: C =
[A] [B]
↔ Cij =
Aij Bij
5
There are four general strategies for dealing with the problem outlined in Figure 1.2. First, one may select features z and {xi }N i=1 that are invariant to the LTI channel, so that pZY = pXY . Features invariant to channel dispersion were considered for classification in ˆ from z via feature or signal deconvolution, so x ˆ [50]. A second strategy is to estimate x and its label are jointly distributed as the training distribution pXY . Since classifiers are trained on the original dataset, distributed as pXY , these methods are informally referred to as x-space classifiers. A third approach is to transform the training data (explicitly or P implicitly) using {hi }M i=1 to yield artificial training pairs {(zi , yi )}i=1 that are distributed
i.i.d. with the test distribution pZY . Methods that utilize pZY as the underlying distribution are informally referred to as z-space classifiers. Yet a fourth method is to train a classifier using pH as the underlying distribution: for each test point z, labeled channel estimates ˆ i , yi )}N are estimated from {(xi , yi )}N , and the label y ∗ is chosen by comparing test {(h i=1 i=1 ˆ i }N to {hi }M using a one-class classifier. Gupta et al. presented a 1-NN classifier points {h i=1 i=1 ˆ ` that maximized impulsiveness for multipath impulse responses that chose y ∗ = y` for h [28]. In contrast to classical approaches in signal processing that seek to deconvolve then classify in distinct operations, the methods presented in this thesis represent a system-optimized approach to the problem, and may be categorized broadly under joint deconvolution and classification. It should come as no surprise that if we are given training samples {xi }N i=1 and auxiliary samples {hi }M ˆ[n] from i=1 as shown in Fig. 1.2, one might better estimate x z[n] than by employing a blind deconvolution method that ignores the given training and auxiliary data. From the perspective of building a classifier, one may expect that better performance can be achieved if the convolution relationship between x[n] and z[n] is built into a classifier. A central conclusion of this thesis confirms this intuition: in order to estimate the class for z[n], one need not perform deconvolution explicitly; instead, better results can be achieved when a classifier is designed to account for the linear time-invariant channel. The linear-system dataset shift problem depicted in Figure 1.2 describes many applications, but the experiments in this thesis will principally address passive acoustic classification, particularly when h[n] in equation (1.1) is the impulse response of a multipath
6
channel, and w[n] is such that the SNR of the received signal is very low—between −10 and 10 dB SNR. Multipath channels exist whenever there is more than a single propagation path between a transmitter and receiver. Since the transmitted signal travels multiple paths of different propagation lengths, the resulting phase shifting and attenuation of individual paths combines constructively or destructively at the receiver. The multipath impulse response depends on the source location, receiver location and the location and acoustic impedance of all scatterers in the propagation channel, so h[n] is not a smooth function of position [39]. Since a dominant effect in multipath channels are “echoes” of various delays, h[n] is often modeled as being k-sparse, that is, h[n] contains only k nonzero elements whose location represents the phase delay and whose amplitude represents the attenuation of a given echo path. However, the location and amplitude of nonzero elements cannot be specified without accurate knowledge of the propagation environment. The difficulty of modeling multipath effects is exacerbated for ocean acoustic channels [64], depicted in Figure 1.3. First, the speed of sound is a function of temperature, salinity and pressure, so that it varies non-monotonically with depth, but as a rule of thumb is about 1560 m/s—more than four times faster than in dry air. In addition, the multipath impulse response depends on surface interactions that vary with wind speed (surface) and sediment composition (bottom). Research related to classifying acoustic signals in shallow water is cited in Chapter 2. 1.2
Background
This section provides the reader with background related to joint deconvolution and classification. It is not intended to be exhaustive, rather, it places the research presented in this thesis in proper context, and establishes basic tools and notation that subsequent chapters will draw upon. 1.2.1
Blind Deconvolution
Much research in signal and image processing, applied math and seismology has been applied to the problem of deconvolution, both blind and non-blind. Non-blind deconvolution is in general an ill-posed problem, since the convolution with impulse response h[n] may have a
7
?
Figure 1.3: Underwater passive acoustic classification is complicated in shallow-water environments by multipath channels. Water may be considered shallow when the ocean depth is shallowed compared to the observation distance. The multipath impulse response depends on source and receiver location, surface interactions that vary with wind speed (surface) and sediment composition (bottom), and the sound speed profile of the water column.
non-trivial null-space. The additive noise w[n] exacerbates the problem. Thus, even when h[n] is specified exactly, a signal x ˆ[n] estimated from z[n] and h[n] is not a unique solution to z[n] = h[n] ∗ x[n] + w[n]. ˆ Blind deconvolution methods attempt to recover x ˆ[n] (or h[n]) from z[n] without specifying h[n] (respectively, x[n]). Instead, they rely on prior information about the structure of the signal that is being recovered. There are a host of blind deconvolution algorithms for applications ranging from communications to geophysics. For example, Petropulu and Nikias presented a cepstral blind deconvolution technique that requires that there are no pole-zero cancelations between the signal x[n] and the channel impulse responses from two measurements [52]; however, the method requires multiple observations and relies on cepstral methods that are too sensitive for the low SNR regimes that we are interested in. Signal-based deconvolution methods to remove multipath have been considered in [9, 7, 67, 65]. These methods rely on the fact that h[n] may be modeled using only a few nonzero coefficients.
8
As an example of an approach applied to deconvolving multipath-corrupted signals, consider minimum entropy blind deconvolution introduced by Cabrelli in the geophysics community [9]. Cabrelli introduces the so-called D-norm that operates on a discrete impulse response (vector h): 4
D(h) =
khk∞ , khk2
(1.2)
where khk∞ = maxn |h[n]| and khk2 is the `2 norm. Since k · k∞ ≤ k · k2 , D(h) achieves a maximum of 1, which can be shown to occur when h has exactly one nonzero element. Thus, D(h) measures the “impulsiveness” of h. Let F` be the set of all nonzero vectors of fixed length `—the set F` is the set of all `-length FIR filters. Let z ∈ Rn+`−1 be the (noiseless) discrete convolution x ∈ Rn with h ∈ F` . Cabrelli’s method solves g = arg max D(f ∗ z).
(1.3)
f ∈F`
If the unknown h uniquely satisfies the minimum entropy property that D(h) > D(f ), ∀f ∈ {F` \ h}, then g = x−1 is the Fourier inverse of x. This can be verified by noting that when D(h) is the unique maximum of D(·) and since x−1 ∗ z = x−1 ∗ x ∗ h = h, then D(g ∗ z) = D(h) implies that g = x−1 . 1.2.2
Classifiers and Kernels
Supervised learning classifiers infer the class label, assumed to be either +1 or −1, of a test feature vector x from labeled training examples {(xi , yi )}N i=1 , as depicted in Figure 1.1. Classifiers in this thesis are of two general varieties: generative and discriminative. For a full review of classifiers, the reader is referred to [30]. Generative Classifiers and QDA Generative classifiers estimate from training data {(xi , yi )}N i=1 the joint distribution p(x, y), factorized as the class generating distribution and prior p(x|y)p(y). Linear discriminant analysis (LDA) and quadratic discriminant analysis (QDA) are two common generative classifiers that classify a test sample x with each class-conditional distribution p(x|y) assumed to be Gaussian N (x; my Σy ) with the same covariance matrix Σy=−1 = Σy=1 (LDA)
9
for each class y is, or allowing covariance matrices to differ (QDA). The learning task, then, is to estimate my and Σy from {(xi , yi )}N i=1 , which may be ill-posed for d > N . The decision boundaries resulting from LDA and QDA are, respectively, linear and quadratic (or any conic section), hence their names. Generative classifiers’ probabilistic nature provides straightforward extensions for handling priors and missing data, and can readily diagnose if the test sample x is ill-fitted to either class. However, a criticism of generative classifiers is that since one does not know the true distribution pXY , choosing a simple model for p(x|y) introduces model bias, while choosing a too-flexible model for p(x|y) leads to overfitting (exaggerating the importance of some data that may be noisy or irrelevant).
Discriminative Classifiers, the SVM, and Kernels Discriminative approaches eschew modeling of pXY , instead directly optimizing the decision boundary by minimizing misclassifications (empirical risk) over the training set {(xi , yi )}N i=1 . Hence, they have the perceived advantage of directly optimizing the quantity of interest (classification error via empirical risk), instead of the description of the classes through p(x|y). In practice, they have been shown to be robust, even when few training samples are available [35]. However, confidence measures are difficult to determine from discriminative classifiers, and prior knowledge is difficult to incorporate—both of which come naturally to generative classifiers. The support vector machine (SVM) is currently the most popular member of the family of discriminative classifiers. The SVM classifies a feature vector x based on the sign of a discriminant function f (x) as y ∗ = sgn(f (x)). The SVM can be motivated from the viewpoint of a maximal margin linear classifier that solves for weights v and bias b of a linear function f (x) = vT x + b as N
min
v,ξi ,b
X 1 T v v+C ξi 2
� s.t. yi vT xi + b ≥ 1 − ξi ,
ξi ≥ 0,
i = 1, . . . , N,
i=1
where C is a regularization parameter often expressed as C =
1 2λN .
When the classes are
linearly separable (all slack variables ξi = 0), the SVM finds the function f (x) so that among all linear classifiers that bisect the data via sgn(f (x)), the margin
2 kvk
is maximized.
10
Often, a linear decision boundary is too inflexible. The SVM is easily extended to nonlinear decision boundaries by introducing a nonlinear mapping φ : Rd 7→ Rp and solving the SVM on the mapped data {(φ(xi ), yi )}N i=1 . This can be accomplished implicitly by embedding φ(·) into the optimization and reformulating as N N X X 1 min cT Kc + C ξi s.t. yi cj K(xi , xj ) + b ≥ 1 − ξi , c,ξi ,b 2 i=1
ξi ≥ 0,
i = 1, . . . , N,
j=1
where K(xi , xj ) = φ(xi )T φ(xj ) is the kernel function, K is the kernel matrix whose i, jth element is K(xi , xj ), and each weight ci = αi yi is a multiple of the class label yi ∈ {−1, +1}, where 0 ≤ αi ≤ C. The fact that φ(·) appears only as an inner product K(xi , xj ) = φ(xi )T φ(xj ) is called the kernel trick : rather than specifying φ(·), one may instead specify a kernel function K(·, ·) which implies an underlying φ(·). The kernel-based discriminant function can then be expressed as f (x) = b +
N X
αi yi K(x, xi ).
(1.4)
i=1
Notably, the SVM often chooses many αi = 0, so that (1.4) depends only on a sparse subset of the training data. Hence the name of the classifier—those xi ’s for which 0 < αi < C are the support vectors of the SVM. For any support vector1 xj , the function f (xj ) exactly P predicts its label yj , so that the bias b = yj − N i=1 αi yi K(xi , xj ). The kernel function K(xi , xj ) measures the similarity of its two arguments. Since it implicitly represents the inner product φ(xi )T φ(xj ), it must be a symmetric positive definite function. The family of kernels is a convex cone, so that one may construct new kernels from existing kernels using a pleasant algebra [24]. We exploit this fact when deriving channel-robust kernels in Chapter 5. Radial basis function kernels can be written in terms of some distance between training points K(xi , xj ) = K(kxi − xj k), hence they are invariant to a global translation of the dataset. In Chapter 5, we focus on the popular Gaussian radial basis function (RBF): � Krbf (xi , xj ) = N xi ; xj , γ −1 I , 1
Those xj ’s for which αj = C are bounded support vectors, and do not satisfy b = yj −
(1.5) PN
i=1
αi yi K(xi , xj ).
11
where N (·) denotes the Gaussian function, and γ is the bandwidth parameter. Typically, the RBF is implemented without the Gaussian scaling factor so that Krbf (x, x) = 1. Every kernel is associated with a reproducing kernel Hilbert space (RKHS). This fact allows us to express the SVM objective more elegantly as minimizing regularized loss: f ∗ = arg min f ∈H
N 1 X L(f (xi ), yi ) + λkf k2K , N
(1.6)
i=1
where the hinge loss L(f (x), y) = (1 − yf (x))+ is a convex relaxation of 0/1 loss, and H is the RKHS associated with kernel K. 1.2.3
Features
The classifiers presented in this thesis may be generalized for many choices of features, but the development is restricted to two important types of features in signal processing. In some applications (e.g., image classification), it is convenient to train a classifier using the sampled signal (e.g., pixels) as features. Let x, h, w and z be vectors whose elements contain the samples of the discrete-time signals x[n], h[n], w[n] and z[n], respectively. Then, the convolution relationship in (1.1) can be expressed using the notation z = h ∗ x + w, where a ∗ b is the vector of values that results from discrete convolution of the entries in a with the entries in b. In other applications, features extracted from the discrete-time signals better discriminate the different classes. Subband energy features are a useful and frequently utilized feature choice in many signal processing applications. Let xf [k] denote the kth bin of the discrete Fourier transform of x[n], and let wf [k] be a realization of a zero-mean proper complex 2 Gaussian white noise process with known variance. The subband energy of uz [k] = z f [k] is given by n o ∗ uz [k] = uh [k]ux [k] + uw [k] + 2 Re xf [k]hf [k]wf [k] , ∗
where wf [k] is the complex conjugate of wf [k]. Consider a feature vector of subband energies at d frequency bins k = k1 , k2 , . . . , kd . The relationship of the observed vector
12
uz ∈ Rd and the (unknown) vector ux ∈ Rd can be written concisely as n o ∗ uz = uh · ux + uw + 2 Re xf · hf · wf ,
(1.7)
where · denotes the Hadamard (element-wise) product.
1.2.4
Noisy Features
˜ = x + w, If instead of a convolution relationship, we have only an additive noise model x ˜ differs from the training samples {xi }N then a test feature vector x i=1 only by additive noise. This simple noise model can be handled by the noisy features rule, which accounts for some ˜ to be noisy or missing [17, p. 55]. When all of the elements are or all of the elements of x noisy, the noisy features maximum a posteriori (noisy features MAP) rule is p(y|˜ x) ∝
Z p(x|y)p(y)p(˜ x|x) dx,
where the pdfs in the integrand are assumed to be known.
1.2.5
Dataset Shift
Dataset shift refers to the general problem in predictive modeling in which the joint distribution of inputs and outputs differs between training and test stages. As mentioned previously, if training and test distributions differ arbitrarily, there is little hope for learning a generalizable classifier. This thesis defines one particular type of dataset shift that is induced by an unknown linear time-invariant channel. However, dataset shift of other varieties are present in many other applications. For example, since spam filtering algorithms are trained under one set of criteria, successful spammers often build spamming mechanisms that change behavior over time to exploit this fact [53]. Or, consider the sample selection bias problem of training a speech recognition system using predominantly native English speakers, but in real-world test conditions, accents and drawls confuse the classifier. Despite the fact that dataset shift is present to some degree in all practical applications, it has until recently received little direct attention in machine learning.
13
Recently, algorithms have been developed to deal with a particular type of dataset shift called covariate shift. In covariate shift, only the distribution of the inputs (covariates) x changes between training and test time, but the input-output relationship remains unchanged [5]: for training, pXY = pY |X pX , but at test time, p˜XY = pY |X p˜X . Prior probability shift is another common type of dataset shift occurs when only the distributions of the outputs y changes between training and test time: for training, pXY = pX|Y pY , but at test time, p˜XY = pX|Y p˜Y . In the parlance of dataset shift, the problem addressed in this thesis occurs because of a probabilistic domain shift. Specifically, the test distribution pZY is related to the training R distribution pXY via the conditional distribution pZ|X as pZY = X pZ|X pXY . We model pZ|X using prior knowledge about the problem structure—that the underlying relationship between training and test samples is rooted in the convolution relationship in (1.1)—and by using auxiliary channel samples {hi }M i=1 . For an overview of other forms of dataset shift and algorithms to cope with them, the reader is referred to [53]. 1.3
Outline of Thesis
The thesis proceeds as follows. Chapter 2 presents related research from signal processing and machine learning that are applicable to classifying a signal corrupted by unknown multipath. Chapters 3 through 5 cover the theoretical development of classifiers. In Chapter 3, two signal-based classifiers are presented. The joint MAP algorithm jointly estimates a ˆ . The joint QDA algorithm estimates only the class label y ∗ and deconvolution estimate x class label; the convolution relationship is built into the classifier. In Chapter 4, a featurebased joint QDA algorithm is derived which utilizes subband energy features to discriminate between classes. The local joint QDA algorithm is also introduced as a means to reduce model bias. In Chapter 5, channel-robust kernels are presented which account for the dataset shift induced by linear systems, with closed form derivations given for RBF kernels with Gaussian pZ|X for discrete-time signal, image, and subband energy features. The kernels are used with SVMs in the experiments of Chapter 6.
14
The experiments in Chapter 6 compare feature-based classifiers on three datasets: the first uses simulated narrowband signals with simulated channel impulse responses, in the second, Bowhead whale vocalizations are used to identify individual whales in a simulated acoustic environment, and lastly, trumpeters are identified from recordings in an acoustically reverberant chamber. Some insights into related work in x-space classifiers that were developed in parallel with the classifiers in this thesis are presented as part of the conclusions in Chapter 7.
15
Chapter 2 RELATED WORK [Great men are those] who can catch hold of men’s minds and feelings and inspire them to do things bigger than themselves....those who stir feelings and imagination and make men struggle toward perfection. Dr. Henry Eyring, chemist
The work in this thesis builds on previous contributions from two broad fields: signal processing and machine learning. This chapter reviews relevant prior works from both communities. In Section 2.1, research from acoustics and signal processing is cited which relates to classifying signals corrupted by multipath. Then, research from the machine learning community about building invariance into classifiers is presented in Section 2.2. 2.1
Classifying Signals Corrupted by Multipath
Signal processing researchers in underwater passive acoustics have considered the problem of classifying signals corrupted by multipath for over thirty years [58]. Ehrenberg et al. demonstrated in an ocean acoustic propagation experiment that multipath generally cannot be ignored, and that simple time-gating of the received signal can discard too much of the signal information for classification [18, 19]. Multipath induced by a shallow ocean channel presents an additional challenge in that the multipath propagation is generally time-varying so that the structure of h[n] is highly sensitive to spatial location [21, 63]. A review of the literature reveals four general approaches for classifying signals corrupted with multipath. Each approach corresponds roughly to the four general strategies outlined in Section 1.1 for mitigating the dataset shift problem.
16
The first strategy is to extract features from training signals {xi [n]}N i=1 and the received signal z[n] that are invariant to multipath distortion, then classify based on the multipathinvariant features. Casting this approach into the problem setup defined in Chapter 1, classification methods of this sort seek to find features such that pXY = pZY . Shin et al. consider a number of time-frequency features for clutter rejection [59]. Strausberger et al. compare different distance measures for 1-nearest-neighbor classification of signals passed through Rician channels for over-the-horizon radar [62]. Okopal and Loughlin developed features invariant to channel dispersion and dissipation, and demonstrated superior classification performance compared to temporal and spectral moment features [49]. Other research about features invariant to propagation effects include [50, 51, 45]. In general, classification using channel invariant features can provide good results to the extent that the classes are well-separated in the designated feature space. Blind deconvolution is the basis for a second commonly-used approach for classifying z[n]: a clean signal x ˆ[n] is estimated from z[n], then a classifier is used on features of x ˆ[n]. By deconvolving, the dataset shift problem is ameliorated since both test and training samples are distributed as pXY . There are many examples of trying to remove multipath by blind deconvolution in order to classify [43, 11, 55, 38, 7, 67, 65]. Some researchers exploit the impulsiveness of the unknown h[n] to estimate x ˆ[n] via blind deconvolution [7, 67, 65]. Broadhead and Pflug reported [7] excellent correlation between true signals and signals blindly deconvolved by the minimum entropy method using the D-norm [9], but did not consider classification. Gupta et al. have shown that these blind deconvolution estimates can be highly correlated to out-of-class training signals, so that nearest neighbor classification on correlation scores performs poorly, particularly at low signal-to-noise ratios [28, 27]. A third approach is to predict the representation of the training signals {xi [n]}N i=1 using ˆ a forward model for the multipath h[n]. This has the advantage of avoiding deconvolution, and is most related to the joint QDA classifier presented in Chapter 4. A classifier is built N ˆ using virtual training signals {zi [n] = xi [n] ∗ h[n]} i=1 to classify z[n], so that both test
and training data are distributed as pZY . Researchers previously have based their forward ˆ model h[n] on geometry or physical assumptions [43, 15]. Liu et al. first proposed an inchannel classifier based on free-field training data [43]. They built a classifier by assuming
17
a finite number of multipath reflections for near-bottom target classification. Dasgupta and Carin classify after accounting for multipath via time-reversal imaging, which requires the geometry and sound speed profile of the channel [15]. In a conference paper, we (Gupta et al.) first proposed that to classify a signal corrupted by unknown multipath, jointly considering deconvolution and classification can lead to better performance than traditional approaches that deconvolve then classify in independent steps [28]. Our method leveraged training data to produce a multipath channel ˆ i [n] for each training signal xi [n] given z[n]. Then, a nearest-neighbor classifier candidate h ˆ i [n] was most multipath-like, acchose the class y ∗ = yi for which the estimated filter h cording to Cabrelli’s D-norm in (1.2). The resulting joint deconvolution and classification ˆ =h ˆ i [n] that may method yields the best signal estimate x ˆ[n] = xi [n] and filter estimate h[n] have produced z[n], as well as the optimal class label y ∗ = yi . Classification performance was markedly better than minimum entropy blind deconvolution followed by classification, particularly at low signal-to-noise ratios. However, the performance of that joint deconvolution/classifier relied on several conditions [28]. First, it required a good criterion for ˆ evaluating how well a given h[n] represented a multipath filter. Although the D-norm criterion is a convenient choice, multipath impulse responses in underwater acoustics violate the minimum entropy property [43]. Secondly, the proposed nearest-neighbor approach required that the training signals {xi [n]}N i=1 be plentiful and that the true x[n] be close to a training sample of the correct class in terms of kx[n] − xi [n]k. Thirdly, the deconvolution estimate x ˆ[n] was always restricted to be a member of the set {xi [n]}N i=1 . Lastly, it is not straightforward to incorporate features in classification. 2.2
Invariant Classifiers
In the machine learning community, researchers have addressed the fact that the training samples {xi }N i=1 may not encapsulate all of the manifestations of a test sample. And, similar to the dataset shift problem outlined in Chapter 1 in which we know a priori that test and training data are related by convolution, machine learning researchers have proposed methods to incorporate prior knowledge into classifiers, albeit for different applications. The various methods boil down to two general strategies: creating virtual examples that
18
model the conditions at test time, and designing classifiers that are invariant to the various manifestations of a test sample.
2.2.1
Virtual Examples
The idea of augmenting a training set with “virtual examples” (VEs) dates back to at least 1990 [1]. For example, to build a handwritten digit classifier that is robust to various rotations, one can augment the original training set with artificial examples of rotated digits [16]. The transformed VEs are included with the original training examples to form an expanded training set. The choice of transformation applied to generate the VEs is based on prior knowledge about the perturbations that may be expected in the test features. Typically, the VEs are generated from a discrete and deterministic set of transformations, for example, single pixel translations in the four principal directions of the image plane. Lorens et al. have employed virtual examples to train SVMs to classify targets from their acoustic signatures [44]. High quality recorded signatures are artificially corrupted by simulating their propagation through an acoustic channel to produce virtual examples that better represent the test distribution pZY . Since the original training features are not representative of the test distribution, they are discarded. In Chapter 5, we implement the VE method by propagating each of the N training signals through M example channels, resulting in a training data set size of M × N . This approach has the disadvantage of � O M 3 N 3 complexity in training an SVM. A variant of VEs is the method of virtual support vectors, which trains an SVM on an uncorrupted training set, then generates virtual examples from only the support vectors (and bounded support vectors) [56]. The VSV method has been shown to reduce the overall cost of training an SVM. However, in preliminary results on the datasets used in this thesis, the author found that at least for the RBF kernel—which is known to select many training points as support vectors—the VSV method did not substantially decrease training time, and often exhibited worse performance.
19
2.2.2
Invariant Classifiers via Kernels
Classifiers can be designed to be invariant to conditions one would expect at test time. Sch¨olkopf et al. showed how to engineer kernel functions that allow SVMs to be invariant under transformations forming a Lie group [57]. They showed that the modified kernel is equivalent to preprocessing the data with a whitening matrix. An approach that is a hybrid of creating virtual examples and engineering a kernel is jittering kernels, in which a set of transformations T (e.g., single pixel translations of an image an any direction) of a training sample xi is considered in the kernel definition [16]. Given a positive definite kernel K(·, ·) with K(x, x) = C is a constant for any x, the jittering kernel solves Kjitter (x, xi ) = max K(t(x), t˜(xi )), t,t˜∈T
so that the jittering kernel measures the maximum similarity over all transformations (jitters) that one might expect at test time. Jittering kernels for SVMs have the advantage over VEs for SVMs in that the jittering kernel SVM scales linearly with the number of transformations |T |, whereas the VE SVM is cubic in the number of transformations. Decoste and Sch¨ olkopf employed jittering kernels in an SVM to build a classifier robust to slight translations and rotations of handwritten digits and showed previously unmatched error rates on the MNIST benchmark dataset of handwritten digits [16]. Invariant kernels have been further studied by Haasdonk and Burkhardt [29].
20
Chapter 3 SIGNAL-BASED JOINT DECONVOLUTION AND CLASSIFICATION A good model is best, but a bad model is better than nothing. Dr. Henry Eyring, chemist
This chapter expands on the intuitive idea that by jointly considering the task of deconvolution and classification, better performance may be achieved than if dealing with each task serially. Two classifiers are introduced: the joint MAP classifier, and the joint QDA classifier. Each classifier takes as features the samples of a discrete-time signal features: N M M training samples {xi }N i=1 = {xi [n]}i=1 , auxiliary channel features {hi }i=1 = {hi [n]}i=1 and
test feature vector z = z[n], where the notation x[n] is overloaded to denote the entire discrete-time signal, not just the signal at the nth location. The contents of this chapter have been published in a journal paper [2] and a conference paper [27]. The framework developed in this chapter will apply to any problem where test and training data are related by the convolution relationship in (1.1), but the applications emphasize the case in which h[n] is the impulse response of an acoustic multipath channel, and where the additive noise w[n] gives rise to low signal-to-noise ratios (SNRs). For passive sonar, z[n] represents the in-channel received signal, h[n] represents the multipath and x[n] is the free-field signal. Underwater multipath channels are generally time-varying and are highly sensitive to spatial location, making them difficult to model effectively [21, 63]. To capture the variability of the channel, the impulse response h[n] will be modeled as a draw of a random process. In Section 3.1, we unify deconvolution and classification in a joint maximum a posteriori (MAP) framework. This method jointly estimates a clean signal x ˆ[n], a channel estimate ˆ h[n] and a class label y. In Section 3.2, we argue that if signal estimate x ˆ[n] is not needed, better classification performance can be achieved by not committing to a particular signal
21
or channel estimate. We show how a quadratic discriminant analysis (QDA) classifier can be designed to incorporate the effects of uncertain h[n]. The algorithms are compared to a deconvolve-then-classify strategy in experiments using simulated multipath channels and signals. A feature-based and a more flexible joint QDA classifier will be presented in Chapter 4. The chapter concludes with a discussion about the methods in Section 3.4.
3.1
Joint MAP Deconvolution and Classification
Let vectors z, x, h and w denote the discrete-time test signal, source signal, channel and noise, respectively. In this section, we assume that x, h and w are realizations of random 2 I), where I is the identity matrix. vectors X, H and W, respectively. Let W ∼ N (w; 0, σw
It is assumed that X conditioned on class label y is Gaussian distributed with mean mx|y and covariance Σx|y . Real signals are generally non-Gaussian, but the Gaussian assumption is critical to keeping an otherwise formidable deconvolution problem tractable. The distributions of X, H and W are mutually independent. Model H using a multivariate Laplacian distribution with independent dimensions, so that the ith element of the random multipath has mean mh [i] and scale parameter b[i]. The Laplacian distribution is an appropriate 2} prior model for multipath since it yields sparse realizations. Let θ = {mx|y , Σx|y , mh , b, σw
be the set of parameters for these three distributions, where θ is assumed to have been estimated a priori from the training and auxiliary data. If the clean signal vector x were given, the MAP classification rule would select the class label y ∗ such that y ∗ = arg max p(y|x, θ). y
(3.1)
However, x is unknown. One might estimate x and the channel signal vector h from z using the MAP rule as ˆ = arg max p(x, h|z, θ). {ˆ x, h} x,h
(3.2)
Instead, we jointly estimate the signal, filter, and class label by combining Equations (3.1) and (3.2) into a single MAP criterion. The proposed joint MAP classifier estimates y ∗
22
as y
∗
� � = arg max max p(x, h, y|z, θ) y x,h � � b = arg max max p(z|x, h, y, θ)p(h|θ)p(x|y, θ) p(y) y x,h " a
c
= arg min min kz − h ∗ xk + 2
y
x,h
2 σw kx
−
mx|y k2Σ−1 x|y
(3.3)
+
2 2σw
X |h[i] − mh [i]|
!#
b[i]
i
2 2 + σw log |Σx|y | − 2σw log p(y),
(3.4)
where (b) follows from (a) using Bayes’ rule, the chain rule and independence assumptions; and (c) follows from (b) by taking the negative logarithm of the pdfs, removing constants 2 . Throughout that do not depend on x, h or y from the arg min, and scaling each term by 2σw
the thesis, the notation kxk denotes the `2 norm and kxk2A denotes xT Ax. The kz − h ∗ xk2 term in (3.4) drives the estimated filter h and test signal x to be consistent with the received signal z in terms of squared error. The next two terms in (3.4) drive x to match the a priori expected signal via the `2 norm, and drive h to match the a priori expected filter via the `1 norm. Note that these latter two terms are regularized by the noise variance—the greater the noise power, the more the estimate relies on the a priori expectations and less on matching the received signal z. The fourth term penalizes classes that exhibit high variance, and the fifth term is the class membership prior. Since the noise determines the degree of regularization, a curious behavior of this approach is 2 goes to zero, and that it performs poorly for high SNR: the first term will dominate as σw
solutions for x and h will no longer depend on mx|y and mh , respectively. The objective function in (3.4) is not convex since it involves a product of variables in the convolution sum h ∗ x. However, the problem is jointly convex in x and h in the limit as σw → ∞, and is marginally convex in x or h for all σw . Therefore, we opt to solve the (3.4) using an alternating minimization approach as a heuristic for finding the true solution. Using h[1] · · · h[n] 0 ··· 0 h[1] · · · h[n] · · · H = convmtx(h) = .. .. .. . . . 0
···
0
h[1] · · ·
0
h[n] 0 .. .
23
for the Toeplitz matrix representation of discrete convolution with fixed h [33], and for fixed y, the objective as a function of x can be written in the form of generalized Tikhonov 2 kh − m k2 regularization kHx − zk2 + σw h Σ−1 . The solution [40] is h
2 −1 −1 2 −1 ˆ = (H T H + σw x Σx|y ) (H T z + σw Σx|y mx|y ).
Next, solve (3.4) for those terms depending on h by fixing x and rewriting as ˆ = arg min kXh − zk2 + σ 2 kD−1 (h − mh )k1 , h 2 w h
(3.5)
where X = convmtx(x) is the Toeplitz matrix representation of discrete convolution of x, D is a diagonal matrix with entries
b[i] 2 ,
and k · k1 is the `1 norm. Equation (3.5) can
reformulated as 2 ˜ ˜ ∗ = arg min kX ˜ −z ˜h ˜k22 + σw h khk1 , ˜ h
(3.6)
˜ = D−1 (h − mh ), X ˜ = XD, and z ˜ = z − Xmh . Equation (3.6) is solved naturally where h as a quadratic program with linear constraints, for which efficient algorithms exist [6]. Since the optimization problem in (3.4) is non-convex, the alternating minimizations strategy is not guaranteed to converge to the global minimum [66]. A common approach is to optimize starting from several initial points, then choose the overall minimizer. The initial guesses could be drawn i.i.d. from the class-conditional distribution N (mx|y , Σx|y ). We use a slightly different approach to take advantage of the fact that we have examples from each class: convex combinations of the training signals as initial guesses. A depiction of the alternating minimizations algorithm is shown in Algorithm 1. Experiments and results for the joint MAP classifier are presented in Section 3.2. 3.1.1
A Related MAP Deconvolution Approach
MAP deconvolution has been explored previously by Lam and Goodman for blind image deblurring (without classification) [42]. In that work, Lam and Goodman estimate the point spread function h and the image covariance Σx by maximizing p(z|h, Σx )p(h)p(Σx ). The prior p(Σx ) is replaced with a heuristic smoothness constraint on the covariance, and the prior p(h) is replaced with the hard constraint h ∈ H for some convex set G. They proposed
24
Input: z ˆ x ˆ , y∗ Output: h, foreach class y do initialize(hy ); while !converged do foreach class y do H = convmtx(hy ); � �−1 � � 2 Σ−1 T z + σ 2 Σ−1 m xy = H T H + σ w H ; x|y w x|y x|y X = convmtx(xy );
2 D −1 (h − m ) ; hy = arg minh kXh − zk22 + σw h 1 2 2 2 2 kh − m k2 scorey = kz − h ∗ xk2 + σw h Σ−1 + σw kx − mx|y kΣ−1 + σw log |Σx|y |; h
x|y
end end y ∗ = arg miny scorey ; ˆ = hy∗ ; h ˆ = xy ∗ ; x Algorithm 1: Joint MAP deconvolution and classification implemented using alternating minimizations. We use X = convmtx(x) to denote the Toeplitz convolution matrix .
an expectation-maximization (EM) algorithm implementation that alternates between estimating Σx (the E-step) and h (the M-step) in the Fourier domain. The image is finally estimated by Wiener deconvolution using the estimated h and Σx . The algorithm results in high-quality deblurred image estimates [42]. The Lam and Goodman MAP blind deconvolution may be extended to the multipath problem by applying a Laplacian prior for p(h) as we have done in (3.4) instead of their hard constraint h ∈ G. However, their approach cannot be extended to fit in the joint deconvolution/classification paradigm by simply conditioning on the class label y and adding the prior p(y) in the optimization. First, Lam and Goodman assume that the image x (and therefore, z) is a realization of a zero-mean Gaussian distribution. In our framework, the class-conditional mean is an important discriminating feature of the class. Secondly, their
25
method must estimate Σx , but in our framework the class conditional covariance Σx|y is estimated a priori from training pairs. Naively replacing Σx with Σx|y renders their Estep useless so that iterating does not improve the initial guess. Thus, the training pairs {xi , yi }N i=1 offer little advantage to their MAP blind deconvolution technique. 3.2
Probabilistic Deconvolution and Classification Using QDA
Estimating the true signal is difficult and unnecessary if only a class label is required. In this section, we explore classifying signals jointly with probabilistic deconvolution, in which a statistical characterization of x[n] and h[n] are used without ever choosing a particular, deterministic signal or channel estimate. Specifically, we consider the maximum likelihood classifier that solves y ∗ = arg max p(z|y) y ZZ = arg max p(z|x, h, y)p(x|y)p(h)p(y) dx dh.
(3.7)
y
Assuming a uniform prior, the classifier in (3.7) differs from the joint MAP classifier in (3.3) in that the max operator in (3.3) is replaced by expectation over p(x|y) and p(h) x,h
in (3.7). For the remainder of the chapter, we will assume uniform prior p(y) such that arg min p(y|z) = arg min p(z|y). y
y
Quadratic discriminant analysis (QDA) is a popular classification rule that models each class-conditional distribution in (3.7) as Gaussian [30, 22, 60]. This model can be motivated by the central limit theorem and the fact that the Gaussian is the maximum entropy (least assumptive) distribution given first and second moments. Here, we build a QDA classifier by assuming p(z|y) in (3.7) is Gaussian, and we show that one can calculate the sufficient statistics mz|y and Σz|y of p(z|y) from the estimated mean and covariance of the auxiliary channel features {hi }M i=1 and the estimated means and covariances of the training signals {(xi , yi )}N i=1 from each class. Note that we do not make any assumptions on the distributions of H or X given y other than that they have finite first and second moments; in fact the result of the convolution H ∗ X would not be Gaussian if H and X were assumed to be Gaussian random processes.
26
3.2.1
QDA Classification of Signals Corrupted by LTI Filtering
Let X be a random vector with finite class-conditional mean mx|y and finite covariance 2 I; and let H be a Σx|y ; let the noise be a zero-mean random vector W with covariance σw
random vector with mean mh and covariance Σh . Let the observed signal model be given by Z = X ∗ H + W.
(3.8)
For Gaussian p(z|y), compute the class-conditional mean mz|y and covariance Σz|y of (3.8) as follows: mz|y = E [X ∗ H + W|y] = E [X|y] ∗ E [H] + E [W] = mx|y ∗ mh ,
(3.9)
and h i a Σz|y = E (X ∗ H + W) (X ∗ H + W)T − mz|y mTz|y h i � � b = E (X ∗ H) (X ∗ H)T + E WWT − mz|y mTz|y � � � � � � c = E XXT ∗ ∗ E HHT + E WWT − mz|y mTz|y 2 I − mz|y mTz|y , = (Σx|y + mx|y mTx|y ) ∗ ∗(Σh + mh mTh ) + σw
(3.10)
where ∗∗ denotes two-dimensional discrete convolution. Line (b) follows from (a) since � � E (X ∗ H) WT = 0; line (c) follows from (b) by property (A.1) and independence assumptions; and the expression reduces to (3.10). The classification rule in (3.7) can be reduced to y ∗ = arg max z − mz|y y
�T
� Σz|y , Σ−1 z − m + log z|y z|y
where the determinant and inverse can both be computed from a single LU factorization of Σz|y . This classification approach requires the second-order statistics of X (conditioned on M y) and H which can be estimated from {(xi , yi )}N i=1 and {hi }i=1 , respectively. Most blind
deconvolution algorithms also require some information or assumptions about either x or h or both [42, 7].
27
3.3
Experiments: Signal-based Joint QDA and Joint MAP Classification
The proposed methods were tested in two experiments that differ in how simulated multipath is generated. In the first, a Laplacian random process was used to generate realizations of multipath channels. In the second, a random k-sparse model was used. In both experiments the clean training signals were drawn from class-conditional Gaussian distributions; using this model, the test signal z[n] is not Gaussian distributed. 3.3.1
Signal Classification Experiment: Laplacian Multipath
Each coefficient of a multipath filter was drawn independently from a Laplacian random process with parameters mh [n], b[n]: p(h[n] | mh [n], b[n]) =
� � 1 |h − mh [n]| exp − , 2b[n] b[n]
for n = 0, . . . , 99, where we set the mh to be mh [n] = δ[n] − 0.6δ[n − 49] + 0.1δ[n − 99], and the scale parameter b[n] decays as n grows: b[n] = 0.2e−0.024n . The decay parameter coefficients for this experiment were chosen to model oceanic multipath filtering of sonar signals. 1.5 1 0.5 0 −0.5 −1
0
10
20
30
40
50
60
70
80
90
100
Figure 3.1: Example multipath realization from the k-sparse model (stem), and the deconvolution estimate produced by the joint MAP deconvolution/classifier (solid) at 10 dB SNR.
Test and training signals were drawn i.i.d. from a Gaussian distribution N (mx|y , Σx|y ) where the class y was drawn uniformly between two classes. Two classification scenarios
28
were considered to test performance: (i) classes that were well-separated by their mean vectors, and (ii) classes whose mean vectors were similar. The mean signals were composed of square and sine waves, and the covariance matrices were Toeplitz with smooth covariance structure. The specific values of mx|y and Σx|y for each experiment are shown in Table 3.1. Each test signal z was created by convolving a randomly drawn signal x with randomly drawn multipath h, and adding a Gaussian white noise realization w to achieve SNR between -10 and 10 dB, where the SNR is with respect to the multipath signal, 10 log10
kx∗hk2 . 2 σw
Table 3.1: Simulation parameters for joint MAP / joint QDA experiments. Note that square[n] = sgn(sin[n]). parameter
mx|y [n] Σx|y [m, n]
class 1
Well-separated means � 6πn � � 12πn � 1 1 4 square 100 4 square 100 � � �� � � �� |m−n| (m−n)2 1 1 δ[m − n] + exp − δ[m − n] + exp − 100 20 100 10
mx|y [n] Σx|y [m, n]
class 2
1 4 1 100
�
square
Close means � 6πn �
1 4
100
δ [m − n] + exp
�
− |m−n| 20
��
1 100
�
sin
� 6πn � 100
� �� 2 δ[m − n] + exp − (m−n) 10
The joint QDA classifier was compared to a matched filter that ignores multipath. For the matched filter, the received signal z is tested against mx|y for each class. The joint MAP classifier in (3.4) is compared to a matched filter on a blind deconvolution signal estimate. ˆ For blind deconvolution, the received signal z is first denoised by Wiener filtering, then h is estimated using Cabrelli’s blind deconvolution method for signals that have undergone ˆ is then computed via deconvolution in the unknown multipath filtering [9]. The estimate x Fourier domain. The true signal length was used as a required input to Cabrelli’s method. Each of the methods used the true signal and channel statistics, and the true SNR where needed.
29
3.3.2
Signal Classification Experiment: k-sparse Multipath
The k-sparse experiments are the same as described in the previous subsection, except the multipath filters were generated using a sparse model h[n] =
k X
αi δ[n − di ],
i=1
with k = 15 nonzero coefficients, delays di drawn uniformly on [0, 99], αi = ±e−βdi with randomly chosen sign and decay parameter β = 0.0240 chosen to mimic real underwater acoustic channels. An example realization of a filter h drawn from this model is shown in Fig. 3.1. The diagonal covariance matrix Σh is estimated from 1000 samples of the impulse response. 3.3.3
Signal-based Joint QDA and Joint MAP Results
Figure 3.1 shows a reconstructed multipath estimate produced by the joint MAP deconvolution/classifier corresponding to the well-separated means experiment at 10 dB SNR. In this case joint MAP correctly identified the class label. The recovered filter is a reasonable reconstruction of the true filter, but generally underestimates the amplitude of the first coefficients, and does not reliably reconstruct the tail of h. The gross errors can be ascribed to the fact that the optimization problem in (3.4) is not convex, and to the mismatch between the Laplacian prior and k-sparse model. Classification results in Fig. 3.2 show that the proposed joint QDA classifier dominates the matched filter for both Laplacian multipath in (a) and (b), and for k-sparse multipath in (c) and (d). The means for each class used for (a) and (c) are orthogonal, so the matched filter performs well despite ignoring the multipath. With similar means in (b) and (d), however, the matched filter performs poorly compared to joint QDA. The joint MAP classifier performs well at low SNR, but as predicted, degrades at high SNR. For truly sparse multipath in (c) and (d), the joint MAP approach is unaffected for well-separated means in (c), and mildly affected at high SNR for close means in (d) when compared to results for Laplacian multipath. The `1 norm is an appropriate heuristic for the k-sparse multipath model, and has been employed elsewhere to recover sparse solutions [10].
30
100
90 80 70 60 50
Joint QDA Matched Filter Joint MAP Blind Deconv + MF
−10 −8 −6 −4 −2 0 2 SNR (dB)
4
6
Correct classification (%)
Correct classification (%)
100
8 10
80 70 60 50 −10 −8 −6 −4 −2 0 2 SNR (dB)
4
6
well-separated means (Laplacian)
close means (Laplacian)
(a)
(b)
8 10
100 Correct classification (%)
100 Correct classification (%)
90
90 80 70 60 50 −10 −8 −6 −4 −2 0 2 SNR (dB)
4
6
8 10
90 80 70 60 50 −10 −8 −6 −4 −2 0 2 SNR (dB)
4
6
well-separated means (k-sparse)
close means (k-sparse)
(c)
(d)
8 10
Figure 3.2: Classification accuracy for four experiments using multipath generated from a Laplacian model in (a) and (b), and a k-sparse model in (c) and (d). The results are averaged over 1000 i.i.d. test signals for each SNR point.
3.4
Conclusions
Classification methods were proposed that jointly consider the effects of multipath distortion with classification. In particular, a joint MAP deconvolution/classifier was derived that incorporates first and order statistics of the channel and yields a MAP solution for the ˆ and the class label y ∗ . Two drawbacks of the joint ˆ , the recovered filter h recovered signal x
31
100
90 80 70 60 50
Joint QDA Matched Filter Joint MAP Blind Deconv + MF
−10 −8 −6 −4 −2 0 2 SNR (dB)
4
6
Correct classification (%)
Correct classification (%)
100
8 10
80 70 60 50 −10 −8 −6 −4 −2 0 2 SNR (dB)
4
6
8 10
well-separated means, same cov.
well-separated means, different cov.
(a)
(b) 100 Correct classification (%)
100 Correct classification (%)
90
90 80 70 60 50 −10 −8 −6 −4 −2 0 2 SNR (dB)
4
6
8 10
90 80 70 60 50 −10 −8 −6 −4 −2 0 2 SNR (dB)
4
6
8 10
close means, same covariances
close means, different covariances
(c)
(d)
Figure 3.3: Classification accuracy for four experiments using multipath generated from a sparse model. The results are averaged over 500 i.i.d. test signals for each SNR.
MAP algorithm is that it is not convex, and that it theoretically performs poorly at high SNR. The first problem might be addressed by maximizing the marginal p(h, y|z) which yields a convex expression, but requires more complicated optimization approaches (e.g., an EM algorithm similar to Goodman and Lam [42]). The second problem arises since 2 , which may be replaced by a fixed penalty regularization scales with the noise power σw
that can be chosen via cross-validation.
32
It was hypothesized that better classification performance could be gained by marginalizing over x and h. To that end, a joint QDA classifier was presented that accounts for the LTI corruption probabilistically. Experiments showed that the joint QDA classifier outperformed the joint MAP classifier and a classifier based on blind deconvolution. The joint MAP and joint QDA classifiers presented in this chapter utilize discrete-time signals as feature vectors. In practice, the length of the signals of interest may be very large, so that estimating covariance matrices may be ill-posed and inverting the matrices may be computationally intractable. Therefore, in the next chapter, a feature-based joint QDA classifier is developed.
33
Chapter 4 JOINT QDA FOR SUBBAND ENERGY FEATURES It’s less of a sin to be simple and wrong than to be complicated and wrong. Dr. Henry Eyring, chemist
Signal-based deconvolution and classification methods—including blind deconvolution, joint MAP deconvolution and classification and the joint QDA classifier—are computationally prohibitive for signals captured at high sample rates. For L-length sampled signals, Cabrelli’s blind deconvolution method requires the inversion of an L × L Toeplitz matrix, which can be solved in O(L log L) operations. The joint MAP deconvolution and classification requires more iterations to converge as L increases, and requires (as does joint QDA) inversion of an L × L covariance matrix, which in general is complexity O(L3 ). To decrease the computational burden and possibly increase classification performance, an alternative is to classify based on features that represent important characteristics of the signals and provide good class discrimination [17]. The hope is that classes can be well-discriminated by features of significantly smaller dimensionality d � L. Unless channel-invariant features are used, a classifier trained on features of {xi [n]}N i=1 will not generally be applicable to classify the features of z(t) directly. However, if a functional relationship can be found that relates the training samples {xi }N i=1 to the test sample z, then a suitable classifier may be constructed. In this chapter, the functional relationship between subband energies of x[n] and z[n] is used to derive a feature-based joint QDA classifier. Subband energy features are a useful and frequently utilized feature choice in many signal processing applications. The joint QDA classifier is compared to other classifiers in simulated underwater passive acoustic experiments. Portions of this chapter are published in [2].
34
4.1
Joint QDA Using Second Order Statistics of Subband Energy
It is assumed that to classify a subband energy feature vector uz , training pairs {(uxi , yi )}N i=1 , auxiliary channel samples {uhi }M i=1 , and the noise power are provided; however, the phase of the training signals (e.g., provided by xfi ) and channel impulse responses is not assumed to be provided. It will be shown that a robust classifier can be derived without the need to model the phase of the signal, channel or noise. Model Hf , Xf and Wf as mutually independent random vectors, and Ux = Xf · Xf
∗
so that o n ∗ Uz = Uh · Ux + Uw + 2 Re Xf · Hf · Wf .
(4.1)
� � We assume that Wf ∈ Cd is a proper complex Gaussian random vector with E Wf = 0 � � 2 I. and Cov Wf = σw To derive the joint QDA classifier for subband energy features we need only compute ¯ z|y = E [Uz | y] and Σu = Cov [Uz | y]. The mean is given by U z|y o i h n ∗ a E [Uz |y] = E Uh · Ux + Uw + 2 Re Xf · Hf · Wf | y n h i h i h i∗ o b = E [Uh ] · E [Ux | y] + E [Uw ] + 2 Re E Xf | y · E Hf · E Wf ¯h ·U ¯ x|y + σ 2 I, =U w c
(4.2)
where the independence assumptions and the fact that Re { E [·]} = E [ Re {·}] have been � � used to reduce (a) to (b); and (b) reduces to (c) since E Wf = 0. The covariance Σuz|y is derived from Equation (B.23) in the appendix by conditioning on the class y: � � ¯ hU ¯ T · Σu + Σ u · U ¯ x|y U ¯ T + σ 4 I + 2σ 2 diag U ¯h ·U ¯ x|y . Σuz|y = Σuh + U w w h h x|y x|y
(4.3)
Using (4.2) and (4.3), the joint QDA classifier for subband energy features is given by ¯ z|y y ∗ = arg max uz − U y
�T
� ¯ z|y + log Σu . Σ−1 u − U z uz|y z|y
¯ x|y and Σu can be estimated from the training pairs {(ux , yi )}N , It is assumed that U i i=1 x|y ¯ h and Σu can be estimated from the auxiliary channel data {uh }M , and that σ 2 that U w i i=1 h is known.
35
4.1.1
Modeling Subband Energies Uz as Gaussian
The vector of subband energies uz is in fact non-negative, but modeling Uz as Gaussian permits uz < 0 with nonzero probability. The Gaussian assumption is motivated by computational convenience and by the fact that the Gaussian distribution is the maximum entropy distribution over Rd given only E [Uz |y] and Cov [Uz |y]. It may be more suitable to relax the Gaussian assumption, and instead consider the maximum entropy distribution over the positive orthant Rd+ . However, the maximum entropy distribution over Rd+ is the multivariate truncated normal distribution which requires cumbersome multi-dimensional lookup tables of the cumulative distribution function [37]. Similarly, using a multivariate Rayleigh model is analytically cumbersome and computationally challenging. In practice, the Gaussian model may not be in gross violation of the constraint uz > 0. Commonly, and as in the experiments in this chapter, a frequency bin k is selected so that the features uxi [k] � 0 and exhibit low variance for a given class. The resulting Gaussian model is concentrated around the features in the positive orthant, and the area under the distribution’s tail for uz < 0 is quite small. However, in general, the assumption that Uz is Gaussian admits model bias into the joint QDA classifier. 4.2
Local Joint QDA
In this section, the model bias of joint QDA is reduced by relaxing the assumption that p(uz |y) is globally Gaussian. A standard approach to model an arbitrary distribution is the Gaussian mixture model (GMM). By properly choosing the appropriate number of Gaussian components, GMMs can be very flexible [30], but can have high estimation variance due to local minima of the expectation-maximization algorithm required to learn the parameters of the GMM. Instead, another approach is used that has recently been shown to work well, which is to apply the Gaussian model locally to the nearest-neighbors of the test sample, an approach aptly termed local QDA [23]. A local joint QDA classifier is proposed in which, given an observation z, the Gaussian distribution is fitted to only the training pairs that correspond to the expected nearest neighbors for each class. Expected nearest neighbors are defined as follows.
36
Definition 1. Expected Nearest Neighbor. Model random training vector Zi as Gaussian ¯ i and covariance Σz . Given a test sample z, the expected nearest neighbor of with mean Z i z is the random vector Z` , where � � 4 ` = arg min E kz − Zi k2 i
� � = arg min zT z − 2zT E [Zi ] + E ZTi Zi i
¯ i + tr Σz + Z ¯T Z ¯ = arg min zT z − 2zT Z i i i i
¯ i k2 + tr Σz . = arg min kz − Z i i
(4.4)
Note that the nearest neighbor in Definition 1 depends on both Z¯i and Σzi of a random training vector Zi . The second nearest neighbor is found in similar fashion, after Z` has been excluded from the set of candidate neighbors, and so on for the subsequent nearest neighbors. Let Xy = {xi : yi = y} for each class y. Given observation z, let Ky be the set of training samples in Xy that correspond to the ky expected nearest neighbors of z. For discrete-time features Z` = H ∗ x` + W is the expected nearest neighbor to z by ¯i = H ¯ ∗ xi and Σz = Σh ∗ ∗xi xT + σ 2 . Then, the mean and covariance Definition 1 with Z w i i of Gaussian likelihood p(z|y) is calculated as the sample mean and covariance, respectively, ¯ k , Σzk ) where of Xy . The local class-conditional distribution p(z|y) = N (z; Z y y ¯k = H ¯ ∗X ¯k , Z y y
2 Σzky = Σh ∗ ∗Σxky + σw I,
¯ k and Σxk are taken as the sample mean and covariance of the ky elements of Ky . where X y y For subband energy features, Definition 1 is applied for a test signal uz and random n o ∗ variable Uzi = Uh · uxi + Uw + 2 Re Hf · xfi · Wf which has mean and covariance ¯z = U ¯ h · ux + σ 2 U w i i � 4 2 ¯ h · ux . Σuzi = Σuh · uxi uTxi + σw I + 2σw diag U i ¯ x = ux and The covariance Σuzi is derived from (B.23) in the appendix by substituting U i
37
¯ zk , Σu k ) is specified by parameters Σux = 0. Then, the distribution p(uz |y) = N (uz ; U y z y ¯ zk = U ¯h ·U ¯ xk + σ 2 1, U w y y � � ¯h ·U ¯ xk , ¯ xk U ¯ T + σ 4 I + 2σ 2 diag U ¯ hU ¯ T · Σu k + Σ u · U Σuz ky = Σuh + U w w y y x y xky h h ¯ xk and Σu k are estimated from the ky elements of Ky , and U ¯ h and Σu are where U y x y h estimated from auxiliary set {uhi }M i=1 . The neighborhood size ky for each class y is a parameter of local joint QDA that must be chosen based on prior knowledge or via crossvalidation. Local joint QDA generalized joint QDA since one may choose ky = |Xy |. Experiments to test local joint QDA are presented in Chapter 6.
4.3
Experiments: Feature-based Classification of Simulated Signals
The proposed joint QDA using subband energy features is compared to two alternate classification approaches that use subband energy features. First, a “deconvolution” approach 2 to form an removes the mean effect of the channel using E [Uh ] and the noise energy σw [uz −σw2 ] [a] ˆx = estimate u ¯ h ] , where [b] denotes Hadamard (elementwise) division of vectors a [U ˆ x is then compared to training pairs {(uxi , yi )}N and b. The estimate u i=1 using a standard
classifier (e.g., QDA, SVM, or k-NN). This approach utilizes the sample mean (but not the sample covariance) of the auxiliary channel samples. Second, a “normalization” classifier approach ignores the auxiliary samples {uhi }M i=1 altogether. Training signals {x[n]i }N i=1 are first normalized by their total energy before ˆ z is also formed by first normalizing extracting training samples {ˆ uxi }N i=1 . A test vector u the signal z[n] by its total energy. This approach corrects for the gross attenuation of the test signal caused by the channel, but not the spectral shaping. Joint QDA is compared to both the normalization and deconvolution approaches for QDA, 1-NN, and a support vector machine (SVM) [30]. The task of classifying narrow-band signals is considered, where the signals are corrupted by unknown multipath due to propagation in a shallow ocean channel. To simulate narrow-
38
3
10
0.5 power at θ2
Imaginary Part
1
0
2
10
−0.5 −1 −1
−0.5
0 0.5 Real Part
(a)
1 1
10 1 10
2
10 power at θ1
(b)
Figure 4.1: (a) Pole-zero plot showing the mean location of the poles for class 1 (×) and class 2 (∗) for the easy case, and (b) scatter-plot of the classes in log-feature space.
band signals, training and test signals are generated i.i.d. using the z-transform model Xy [z] =
(z − 1)(z + 1) for class y = 1, 2, (z − py,1 )(z − p∗y,1 )(z − py,2 )(z − p∗y,2 )
where X[z] denotes the z-transform of the discrete-time signal x[n]. The location of each class-conditional pole py,` , ` ∈ {1, 2} is drawn randomly from the model ay,` exp(jθ` ), where θ` is fixed, and ay = [ay,1 , ay,2 ]T is multivariate Gaussian distributed with mean ma|y and covariance matrix Σa|y . Although the vector ay for each class y is Gaussian distributed, the signals in feature space are not. Three instances of the experiment are considered for different choices of ma|y that result in different class separation: easy, medium and hard. The parameters ma|y and Σa|y for each instance of the experiment are shown in Table 4.1, and we set θ1 =
1 50
3
10
and θ2 = 15 . Figure 4.1 shows an example pole-zero plot and
corresponding log-feature space scatterplot for a well-separated (easy) case. Note that since all poles and zeros lie within the unit circle, for each case the selected parameters correspond to a realization of a minimum phase signal, which could be produced from natural sources.
39
Table 4.1: Pole Magnitude Distribution for Feature-based Classification Experiments
Parameter Σa|y
Class 1 1.00 0.99 × 10⁻⁶ 0.99 9.00
Class 2 6.00 −0.80 × 10⁻⁴ −0.80 1.00
hard ma|y
h iT 0.945 0.905
ma|y
h iT 0.945 0.875
ma|y
h iT 0.965 0.875
h medium h
iT 0.909 0.948 iT 0.879 0.948
easy h
iT 0.875 0.948
Test and training signals were generated by taking i.i.d. draws of poles as described above, and taking 5000 evenly-spaced samples around the unit circle in the z-transform domain, so that the length of each signal corresponds to 1.25 seconds, sampled at 4 kHz. The subband energy at frequencies θ1 and θ2 are extracted from each signal and used as classification features. The parameters in Table 4.1 were chosen such that the generated test and training signals were linearly separable in the subband energy feature space. Channel impulse responses were drawn i.i.d. in the following manner. A receiver is placed at a depth of 50m in a simulated shallow water channel, as shown in Fig. 4.2. Source locations were drawn uniformly from the cube 2 km across north and east and 150 m deep; locations falling below the ocean floor are discarded and redrawn. Channel impulse responses were generated by propagating an impulsive source from the random source locations to the receiver using the CASS Eignenray routine provided in the Sonar Simulation Toolset [25]. Impulse responses were sampled at 4 kHz. The ocean environment is set up to be fairly extreme, but static. A nominal sound speed profile was imposed, and modeled the ocean bottom to contain sandy gravel with mean grain size 2mm. Surface roughness is governed by the wind speed, which is set to 15 km/hr. The channel geometry
40
(a) −3
x 10 1
amplitude
0.5 0 −0.5 −1 0
0.2
0.4 0.6 time (s)
0.8
1
(b) Figure 4.2: (a) Simulated ocean bathymetry with a single receiver (marked by ) at (0, 0, −50) m, and (b) a sample channel impulse response for a source located at (460, 250, −70) m, generated by the Sonar Simulation Toolset [25].
and a sample channel impulse response are shown in Fig. 4.2. ¯ x|y and Σu were computed from N=1000 training Maximum likelihood estimates of U x|y ¯ h and Σu were computed from feature vectors, and maximum likelihood estimates of U h M=1000 auxiliary channel samples. The test signals were corrupted with randomly drawn multipath, and then i.i.d. white noise was added so that the multipath-corrupted-signal to
41
noise ratio was varied between −10 and 10 dB. Classification results were averaged over 10000 trials for each SNR. The proposed joint QDA classifier was compared with ky = |Xy | (experiments with local joint QDA will be given in Chapter 6) to traditional QDA, support vector machine (SVM) with a linear kernel, and 1-NN classifiers using both the “deconvolution” and “normalization” approaches described in Section 4.3. Although the 1-NN, QDA and SVM classifiers produce a non-linear, quadratic, and linear decision boundary, respectively, in each of the three simulations, the training and test data were linearly separable. Using this as prior information, the regularization term C in the linear SVM was set to a large value, C = 107 [20]. With this setup, none of the classifiers require cross-validation. 4.3.1
Simulation Results
Results for each experiment are shown in Fig. 4.3. Joint QDA performs markedly better than the other approaches when the classes are difficult to separate. The normalization QDA performs poorly in all datasets, and deconvolution QDA only exhibits utility for high SNR when classes are well separated. In general, the deconvolution methods outperformed the normalization methods, which comes at no surprise, since the deconvolution methods actually utilize the auxiliary features {uhi }M i=1 . As class separation increases, the performance of deconvolution SVM and deconvolution 1-NN is similar to joint QDA. 4.4
Conclusions
A joint QDA classifier was derived for subband energie features. In underwater acoustic simulations involving narrowband data, the joint QDA classifier compared favorably to QDA, SVM and 1-NN classifiers that employ deconvolution and normalization. The SVM and 1-NN classification methods presented in this chapter represent a naive approach to utilizing the auxiliary training samples. In the case of deconvolution SVM and deconvolution 1-NN, only the sample mean of {uhi }M i=1 is used. In the case of normalization SVM and normalization 1-NN, the auxiliary training samples are discarded in favor of simple energy normalization. The following chapter presents kernels for SVM classifiers that better incorporate the auxiliary training samples {uhi }M i=1 .
42
100 Joint QDA Accuracy (%)
90 80
Deconvolution QDA Normalization QDA
Deconvolution SVM Normalization SVM Deconvolution 1−NN Normalization 1−NN
70 60 50 −10
−5
0 SNR (dB)
5
10
5
10
5
10
hard 100
Accuracy (%)
90 80 70 60 50 −10
−5
0 SNR (dB)
medium 100
Accuracy (%)
90 80 70 60 50 −10
−5
0 SNR (dB)
easy Figure 4.3: Results for feature-based classification on simulated data.
43
Chapter 5 CHANNEL-ROBUST KERNELS FOR SUPPORT VECTOR MACHINES To develop a suitable model, I ask myself, “How would I act if I were an atom or molecule and found myself in this situation?” Dr. Henry Eyring, chemist
Built into the joint QDA classifier is the convolution relationship between the unknown signal x[n] and the true signal z[n] via the class-conditional distribution p(z|y). In this chapter, the convolution relationship is also built into a support vector machine (SVM) by constructing appropriate kernel functions. Although the focus is on SVMs, the resulting kernels are applicable to any kernel method. As reviewed in Chapter 2, methods have been proposed for learning invariant classifiers. One flexible approach—the method of virtual examples (VEs)—can be used to train any M classifier by creating a large artificial training set from {(xi , yi )}N i=1 and {hi }i=1 . However,
training an SVM using the VE method has a complexity of O(M 3 × N 3 ). Rather than increase the dataset by a factor of M , two alternative approaches are introduced—the expected kernel and the projected RBF kernel —that incorporate the stochastic channel into the kernel definition. For both approaches, the ith training sample xi is mapped to a probability distribution pZi |xi over the domain of noisy channel-corrupted signals. Then a kernel is defined that acts on two probability distributions in the noisy domain. The two approaches differ in how the samples are mapped to probability distributions, and (relatedly) how the kernels are defined. Closed-form solutions are derived for the proposed kernels for discrete-time features, images, and for subband energy features, summarized in Tables 5.1, 5.2 and 5.3, respectively.
44
Table 5.1: Expected and Projected RBF Kernels for Randomly Filtered Discrete-time Signals
Training Kernel Expected RBF Clean-train Expected RBF Projected RBF Clean-train Projected RBF
¯ i; Z ¯ j , Σz + Σz + γ −1 I N Z i j � −1 ¯i; x ¯j , γ I N x � ¯ i; Z ¯ j , Rz + Rz N Z i j � ¯i; x ¯ j , γ −1 I N x
where, ¯ i = xi ∗ H ¯ and Σz = Σh ∗ ∗ xi xT + σ 2 I Z i w i � γ −1 T ¯H ¯ Rzi = I ∗ ∗ Σh + H + Σ zi 2 −1 � 2 ¯H ¯ T + Σh ∗ ∗ x ˜ z = γ I ∗ ∗ Σh + H ˆx ˆ T + σw I R 2 ¯ ∗x ˆ z=H
Test Kernel
�
¯ i , Σz + γ −1 I N z; Z i
�
¯ i , Σz + γ −1 I N z; Z i � � ¯ i , Rz + R ˜z N z; Z i � � ¯ ˜z N z; Zi , Rzi + R
�
45
Table 5.2: Expected and Projected RBF Kernels for Randomly Filtered Images
Training Kernel Expected RBF Clean-train Expected RBF Projected RBF Clean-train Projected RBF
¯ i; Z ¯ j , Σz + Σz + γ −1 I N Z i j � ¯i; x ¯ j , γ −1 I N x � ¯ i; Z ¯ j , Rz + Rz N Z i j � ¯i; x ¯ j , γ −1 I N x
Test Kernel
�
¯ i , Σz + γ −1 I N z; Z i
�
¯ i , Σz + γ −1 I N z; Z i � � ¯ ˜z N z; Zi , Rzi + R � � ¯ i , Rz + R ˜z N z; Z i
�
where, ¯ i ) = fold (xi ) ∗ ∗ fold H ¯ fold(Z
�
2 fold(Σzi ) = fold (Σh ) ∗ ∗ ∗ ∗ (fold (xi ) ◦ fold (xi )) + σw I
Rzi = Ch + Σzi 2 ˜ z ) = fold(Ch ) + fold (Σh ) ∗ ∗ ∗ ∗ (fold (ˆ fold(R x) ◦ fold (ˆ x)) + σw I � −1 � � �� γ ¯ ◦ fold H ¯ I ∗ ∗ ∗ ∗ fold (Σh ) + fold H fold(Ch ) = fold 2 � ¯ ∗ ∗ fold (ˆ fold(z) = fold H x)
46
Table 5.3: Expected and Projected RBF Kernels for Subband Energies of Randomly Filtered Signals
Expected RBF Clean-train Expected RBF Projected RBF Clean-train Projected RBF
Training Kernel
Test Kernel
� � ¯z ;U ¯ z , Σu + Σu + γ −1 I N U i j zi zj � ¯ xi ; u ¯ xj , γ −1 I N u � � ¯z ;U ¯ z , Ru + Ru N U i j zi zj � ¯ xi ; u ¯ xj , γ −1 I N u
¯ z , Σu + γ −1 I N uz ; U i zi
�
� ¯ z , Σu + γ −1 I N uz ; U i zi � � ¯ z , Ru + R ˜u N uz ; U i zi z � � ¯ z , Ru + R ˜u N uz ; U
where, � ¯ z = ux · U ¯ h + σ 2 1 and Σu = Σu · ux uT + σ 4 I + 2σ 2 diag U ¯ h · ux U w w w i i zi i xi i h � γ −1 ¯ hU ¯ T + Σu Ruzi = diag Σuh + U h zi 2 −1 � � γ 4 2 2 ¯ hU ¯ T + Σu · u ˜u = ˆ xu ˆ Tx + σw R diag Σuh + U I + 2σw diag uz − σw 1 h z h � 2 � 2 uz − σw 1 � � ˆx = u ¯h U
i
zi
z
47
5.1
Expected Kernels
A preliminary version of the expected kernel was presented at a recent conference [34]. Consider the random signal resulting from propagating the features xi of the ith training signal through a random noisy channel, and let the feature vector computed from that random signal be the random feature vector Zi ∼ pZi |xi . Then the channel can be taken into account by training an SVM with a kernel that acts on the random feature vectors {Zi }N i=1 corresponding to the training signals. To that end, given any kernel K : Rd × Rd → R, define the expected kernel Kexp to be the following function of two distributions: 4
Kexp (pZi , pZj ) = EZi ,Zj |xi ,xj [K (Zi , Zj )] , ZZ = pZi |xi (zi )pZj |xj (zj )K(zi , zj )dzi dzj .
(5.1)
The expected training kernel can be interpreted as averaging the similarity of all possible channel corruptions of xi and xj weighted by their probability density. To compute the kernel between a training sample and a test sample, let the probability distribution of the test sample be a Dirac delta distribution with all of its support on the feature vector z computed from the test signal z[n], that is, pZ (z0 ) = δ(z0 − z). The expected kernel given in (5.1) is a legitimate kernel because it is an inner product between its two inputs, where the inner product is weighted by the positive definite function K(·, ·), analogous to a discrete inner product of the form < a, b >K = aT Kb for some positive definite matrix K. Since the distribution pZi |xi is a function of the training point xi , for notational simplicity, we write Kexp (xi , xj ) for (5.1), and Kexp (z, xi ) for the corresponding kernel between δ(z0 −z) and pZi |xi . 5.1.1
Expected Kernel SVM Compared to Virtual Examples SVM
The expected kernel used with an SVM results in a different objective than the VE method used with an SVM. Let {(zij , yij )}N,M i,j=1 be virtual examples training pairs generated from M the powerset of {(xi , yi )}N i=1 and {hj }j=1 . Let L(f (x), y) = (1 − yf (x))+ be the hinge loss,
and λ be a regularization parameter. In the noiseless case (so that EH [·] = EZ|x [·]), and ignoring the bias b, take the limit of the SVM objective function in Equation (1.6) as the
48
number of auxiliary channel features M increases: N M N M 1 X X X X L lim arg min αjm0 yjm0 K(zim , zjm0 ), yi + M →∞ {αij } M N 0 i=1 m=1
λ
j=1 m =1
N X M X N X M X i=1 m=1 j=1
αim yim αjm0 yjm0 K(zim , zjm0 ),
m0 =1
which converges in probability (by the law of large numbers) to N N X M X X 1 p EZi |xi L → lim arg min αjm0 yjm0 K(Zi , zjm0 ), yi + M →∞ {αij } N 0 i=1
λ
j=1 m =1
N X M X N X M X
αim yim αjm0 yjm0 K(zim , zjm0 ).
i=1 m=1 j=1 m0 =1
However, the expected kernel SVM solves the objective function N N X X 1 L αj yj EZi ,Zj |xi ,xj [K(Zi , Zj )] , yi + arg min N {αi } i=1
λ
j=1
N X N X
αi yi αj yj EZi ,Zj |xi ,xj [K(Zi , Zj )] .
i=1 j=1
Thus, the VE SVM (asymptotically) minimizes expected loss, while the expected kernel SVM minimizes the loss with respect to the expected similarities. 5.1.2
Expected RBF Kernel for Discrete-time Signals
¯ Model the impulse response of the stochastic channel as the random vector H with mean H 2 I. Then, and covariance Σh , and model random vector W as zero mean with covariance σw
a deterministic vector x propagated through the stochastic channel results in a random observation Z = H ∗ x + W. ¯ and covariance Σz : Model Z ∼ pZ|x (z|x) as Gaussian distributed with mean Z ¯ =H ¯ ∗ x, Z � 2 Σz = Σh ∗∗ xxT + σw I.
(5.2) (5.3)
49
To derive the expected RBF training kernel, map xi and xj to Zi and Zj , which are modeled as independent Gaussians with means and covariances as prescribed in (5.2) and (5.3). Then, evaluate the integral in (5.1) for the RBF kernel in (1.5) using the product-ofGaussians rule given in (A.9) twice to produce � ¯ i; Z ¯ j , Σz + Σz + γ −1 I . Kexp (xi , xj ) = N Z i j Similarly, the expected RBF test kernel is also derived using the product-of-Gaussians rule in (A.9): Kexp (z, xi ) =
Z
p(zi |xi )K(z, zi ) dzi
� ¯ i , Σz + γ −1 I . = N z; Z i 5.1.3
Expected RBF Kernel for Randomly Filtered Images
Let H = vec (H) be a random column-stacked vector of a random 2-d point spread function (filter) H, and let x be a column-stacked image. Then a randomly filtered image can be represented by the random vector Z where fold(Z) = fold(H) ∗ ∗ fold(x) + fold(W), where fold unstacks an M N × 1 column vector into an M × N matrix (image), and ∗ ∗ ¯ and covariance Σz of Z represents two-dimensional convolution. Using (A.4), the mean Z may be expressed as ¯ = fold(H) ¯ ∗ ∗ fold(x), fold(Z)
and
2 fold(Σz ) = fold(Σh ) ∗ ∗ ∗ ∗ (fold(x) ◦ fold(x)) + σw I,
(5.4)
where the tensor outer product A ◦ B of matrices A and B yields a 4th order tensor [41, 4], fold(Σh ) folds the M N × M N covariance of column-scanned point spread function into a 4-tensor with dimensions M × N × M × N , and ∗ ∗ ∗ ∗ is 4-dimensional discrete convolution. Modeling pZi |xi as a Gaussian with mean and covariance in (5.4) conditioned on x = xi , and substituting pZi |xi into (5.1) yields the expected RBF kernel, given in Table 5.2.
50
5.1.4
Expected RBF Kernel with Subband Energy Features
Model the subband energy feature vector ux after propagation through a stochastic channel as a Gaussian random vector Uz , where, from (1.7) n o ∗ Uz = Uh · ux + Uw + 2 Re xf · Hf · Wf . � 2 I , and Model Wf as a proper Gaussian complex random vector with p(wf ) = N 0, σw ¯ h and covariance Σu (no additional random subband energy vector Uh as having mean U h assumptions are needed about the distribution of Hf ). The expected RBF kernel for subband energy features (with test kernel as a special case) is given by: � � ¯z ;U ¯ z , Σuz + Σuz + γ −1 I , Kexp (uxi , uxj ) = N U i j i j ¯ z , Σuz + γ −1 I Kexp (uz , uxi ) = N uz ; U i i
�
where ¯ z = ux · U ¯ h + σ 2 1, U w i i � 4 2 ¯ h · ux . Σuzi = Σuh · uxi uTxi + σw I + 2σw diag U i ¯ x = ux and The covariance Σuzi is derived from (B.23) in the appendix by substituting U i Σux = 0, since we condition on Ux = uxi . 5.1.5
Unscaled Expected RBF Kernel
Commonly, the standard RBF kernel is implemented without the Gaussian normalization � factor, as Krbf (xi , xj ) = exp − 21 γkxi − xj k2 so that Krbf (x, x) = 1. The inclusion of the γ �d/2 Gaussian normalization factor 2π is arbitrary, since it represents a global scaling of the similarity measure. Expected RBF kernels, however, have a bandwidth and scaling that are data-dependent, so that it is necessary to include the scaling factor. In preliminary experiments, the author found that the normalization factor was especially sensitive to choices of γ and estimated statistics of pZ|X . In fact, the resulting kernel matrices were often poorly conditioned, and in some cases the SVM solver did not converge.
51
To mitigate these problems the unscaled expected RBF kernel Kuexp is defined to be the expected RBF kernel without its Gaussian normalization. Then Kuexp (x, x) = 1, and the resulting kernel matrices are better conditioned and did not lead to computational problems. In addition, there are significant computational savings since it is no longer required to compute the matrix determinant. The unscaled expected RBF kernel can be expressed Kuexp (xi , xj ) =
1 S(xi ,xj ) Kexp (xi , xj ),
where S(xi , xj ) is the Gaussian scale factor. We prove that this is still a legitimate kernel. First, note that the Gaussian scale factor S(·, ·) is positive definite, since it can be written 4
4
as the inner product in (5.1) with pZi |xi (zi ) = N (zi ; 0, Σzi ) and pZj |xj (zj ) = N (zj ; 0, Σzj ), resulting in S(xi , xj ) =
1 d 2
1
(2π) |Σzi + Σzj + γ −1 I| 2
,
where Σzi depends on xi and Σzj depends on xj . For a set of any N samples, let S be the N × N positive definite matrix produced by evaluating the kernel S(·, ·) for all pairs h i of the N samples. Since S is positive definite, the Hadamard inverse S ◦−1 = S1ij is also positive definite [31, p. 397]. The positive definite matrix S ◦−1 is the kernel matrix formed by
1 S(xi ,xj ) .
Then, we conclude that since the Hadamard product A · B of two positive
definite matrices is also positive definite [31], the unscaled expected RBF kernel matrix Kuexp = S ◦−1 · Kexp is positive definite. 5.1.6
Modeling Channel Dependency
The definition (5.1) assumes that the random feature vectors Zi and Zj are independent, which implies that xi and xj were corrupted by different random draws of the channel and noise. A better model is to treat them as being corrupted by the same draw of the random channel and noise, which produces a joint distribution pZi ,Zj |xi ,xj (zi , zj ), and then the expectation in (5.1) becomes ZZ
pZi ,Zj |xi ,xj (zi , zj )K(zi , zj ) dzi dzj .
(5.5)
Unfortunately, it is not clear under what conditions (5.5) will be a legitimate kernel. A closed-form solution to (5.5) for subband energy features is derived in Section B.2. We
52
compared the resulting classifier with the expected kernel classifier for the experiments detailed in Chapter 6 and found no statistically significant differences between the two in any of the experiments.
5.2
Projected RBF Kernels
We propose another channel-robust kernel that is motivated by a recent interpretation of the RBF kernel. Jebara et al. introduced the probability product kernel, which essentially replaces training samples with random variables, xi 7→ X0 ∼ p(x0 |xi ), and defines a positive definite kernel as the inner product of these distributions [36]: 4
Kprob (xi , xj ) =
Z
p(x0 |xi )p(x0 |xj ) dx0 .
(5.6)
Jebara et al. noted that the standard RBF kernel with bandwidth parameter γ in (1.5) can � � −1 be derived as a special case of (5.6) by letting p(x0 |xi ) = N x0 ; xi , γ 2 I and p(x0 |xj ) = � � −1 N x0 ; xj , γ 2 I , and applying the product of Gaussians identity in (A.9). In order for the RBF kernel to have have same bandwidth parameter γ at test time, the test feature vector � � −1 x must also be replaced with a random variable with density p(x0 |x) = N x0 ; x, γ 2 I . To extend (5.6) to our dataset shift problem, we also consider xi to be mapped to a Gaussian random feature vector X0 , and then propagate X0 through the stochastic channel, resulting in the random vector Z0 . The resulting distribution p(z0 |xi ) of Z0 is not necessarily Gaussian; however, for mathematical tractability we project p(z0 |xi ) to the nearest Gaussian using Lemma 1. Lemma 1. Let random vector Z ∈ Rd be drawn from a distribution that has a prob¯ ∈ Rd and covariance Σ ∈ Sd . Then, the ability density function pZ , finite mean Z ++ Gaussian distribution that uniquely minimizes KL-divergence with respect to pZ is given ¯ Σ). by N (z; Z, Proof. Let f (m, R) = KL (pZ ||N (m, R)) for m ∈ Rd and R ∈ Sd++ . By definition, KL (p||q) = EZ [log p(Z)] − EZ [log q(Z)], and thus the mean m∗ and covariance R∗ we seek
53
solve arg min f (m, R) = arg min − EZ [log N (Z; m, R)] R�0,m R�0,m h i = arg min log |R| + EZ (Z − m)T R−1 (Z − m) R�0,m h i = arg min log |R| + tr EZ (Z − m) (Z − m)T R−1 . R�0,m
Since f (m, R) is convex in R, the minimizer m∗ is found by solving ∇m f (m∗ , R) = −2R−1 EZ [(Z − m∗ )] = 0, ¯ is the unique global minimizer since m∗ does not depend on R. and therefore m∗ = Z ¯ However, f (m, R) is not convex in m, but for fixed m = Z i h arg min log |R| + tr EZ (Z − m) (Z − m)T R−1 R�0
= arg min − log |R−1 | + tr ΣR−1 R�0
= arg min − log |Y | + tr ΣY, Y �0
since the change of variables Y = R−1 is a bijection from Sd++ onto Sd++ . The function g(Y ) = − log |Y | + tr ΣY is strictly convex [6], so that the unique global minimizer is found by solving ∇Y g(Y ∗ ) = −Y ∗ −1 + Σ = 0, ¯ and R∗ = Σ uniquely minimize f (m, R). � so that Y ∗ = Σ−1 . We conclude that m∗ = Z Let N (z|xi ) be the projection of p(z|xi ) to the nearest Gaussian distribution using Lemma 1. Then, analogous to (5.6), we define the projected RBF kernel as Z 4 Kproj (·, xj ) = N (z0 |·)N (z0 |xj ) dz0 .
(5.7)
When evaluating the kernel between a test sample and training sample Kproj (z, xj ), we define the distribution N (z0 |z) needed for (5.7) to be the projection of a random variable ¯ 0 , σ I) through Z0 to the nearest Gaussian, where Z0 results from propagating X0 ∼ N (X 2 −1
¯ 0 is chosen such that the mean E [Z0 ] = z is the observed test the stochastic channel, and X sample (see Sections 5.2.1 and 5.2.3 for examples). The kernel Kproj is a legitimate kernel because it is always an inner product of two distributions in z0 .
54
We next present the analytic forms of the projected RBF test and training kernels for the same two cases as the expected RBF kernel: discrete-time signal features, image pixel features, and subband energy features. 5.2.1
Projected RBF Kernel for Discrete-Time Signals −1
Model the random vector X0 ∼ N (x, γ 2 I), then Z0 = H ∗ X0 + W has mean and covariance given by ¯0 = H ¯ ∗ x, Z Σz 0 =
γ −1 2
and
� ¯H ¯ T + Σh ∗∗ xxT + σ 2 I. I ∗∗ Σh + H w
(5.8)
Then by Lemma 1, the projection p(z0 |xi ) to the nearest Gaussian distribution N (z0 |xi ) yields ¯ ∗ xi , γ N (z0 ; H
−1
2
� ¯H ¯ T + Σh ∗∗ xi xT + σ 2 I). I ∗∗ Σh + H i w
Substituting into (5.7), and simplifying with the product of Gaussians rule given in (A.9) yields � � � ¯ ∗ xi ; H ¯ ∗ xj , γ −1 I ∗∗ Σh + H ¯H ¯ T + Σh ∗∗ xi xT + xj xT + 2σ 2 I . Kproj (xi , xj ) = N H i j w To construct N (z0 |z), we assume that a test sample is the mean of the distribution, z = E [Z0 ], where the random variable Z0 is the projection through the stochastic channel of a random variable X0 with covariance
γ −1 2 I.
Therefore, N (z0 |z) has covariance given by
¯ −1 ∗ z. Then, the projected (5.8) with x substituted with Fourier deconvolution x−1 = H RBF test kernel given by (5.7) simplifies to the form in Table 5.1. 5.2.2
Projected RBF Kernel for Image Pixel Features
Let H be a random column-stacked vector of a random 2-d point spread function, and let X be a random column-stacked image with mean x and covariance vector Z0 ∼ N (z0 |x) as fold(Z0 ) = fold(H) ∗ ∗ fold(X) + fold(W).
γ −1 2 I.
Model random
55
The mean Z¯0 and covariance R of Z0 may be expressed as ¯ 0 ) = fold(H) ¯ ∗ ∗ fold(x), and fold(Z � −1 � � �� γ ¯ ◦ fold H ¯ I ∗ ∗ ∗ ∗ fold (Σh ) + fold H fold(Rz ) = fold 2 2 + fold(Σh ) ∗ ∗ ∗ ∗ (fold(x) ◦ fold(x)) + σw I,
Conditioning on x = xi , and substituting into (5.7) yields the projected RBF kernel for column-stacked images xi and xj : � ¯0; Z ¯ 0 , Rz + Rz , Kproj (xi , xj ) = N Z i j i j ˜ z = Rz also shown in Table 5.2. The covariance term for a test image is taken to be R , x=ˆ x ¯ ∗ ∗ fold(ˆ ˆ solves fold(z) = fold(H) where x x). 5.2.3
Projected RBF Kernel for Subband Energy Features −1
For subband energy features, let U0x ∼ N (uxi , γ 2 I). Then project the distribution of the n o 0 ∗ random variable U0zi = Uh · U0x + Uw + 2 Re Xf · Hf · Wf to the nearest Gaussian ¯ 0 , Ruz ), where N (u0z |uxi ) = N (u0z ; U zi i ¯0 = U ¯ h · ux + σ 2 1, U zi w i � � γ −1 ¯ hU ¯ T + Σu · ux uT + σ 4 I + 2σ 2 diag U ¯ h · ux , diag Σuh + U w w h i i xi h 2 −1 ¯ x = ux . which follows from (B.23) in the appendix with Σux = γ 2 I and U i Ruzi =
(5.9) (5.10)
Then, solving the integral in (5.7), the projected RBF training kernel takes the form � � � ¯z ;U ¯ z , Ruz + Ruz . Kproj uxi , uxj = N U i j i j � � ˜ uz , where At test time, given an observation uz , the distribution p(u0z |uz ) = N uz , R ¯ h + σ 2 1: ˜ uz is Ruz in (5.10) with u ˆ x substituted for uxi ; u ˆ x satisfies uz = u ˆx · U R w i � � 21 uz − σ w � � , ˆx = u ¯h U where
[a] [b]
denotes Hadamard (element-wise) division of a and b. Then, solving the integral
in (5.7), the projected RBF test kernel for subband energy features is � � ¯ z , Ruz + R ˜ uz . Kproj (uz , uxi ) = N uz ; U i i
56
5.2.4
Unscaled Projected RBF Kernel
Similar to the discussion of the unscaled expected RBF kernel in 5.1.5, we found that the unscaled version of the projected RBF kernel was computationally more efficient and more robust to parameter choices and estimated statistics. Thus, we used the unscaled projected RBF kernel in our experiments in Chapter 6 and unless specifically stated, when referring to the “projected RBF kernel” we mean specifically the unscaled version. Using the same arguments given in 5.1.5, one can show that the unscaled projected RBF kernel is positive definite.
5.2.5
Projected RBF vs. Expected RBF Kernels
The projected RBF and expected RBF kernels differ in the way that the statistics of the channel samples are incorporated, and in the way that the bandwidth parameter γ is used. Comparing the covariance terms in Tables 5.1, 5.2 and 5.3, we observe that the covariance of the expected RBF kernel has the form Σzi + Σzj + γ −1 I, whereas the covariance of the projected RBF kernel is given by � ¯H ¯ T , or Rzi + Rzj = Σzi + Σzj + γ −1 I ∗ ∗ Σh + H � ¯ jU ¯T . Ruz + Ruz = Σuz + Σuz + γ −1 diag Σu + U i
j
i
j
h
h
Therefore, the training kernels differ only by the matrix weighted by γ −1 ; they are identical as γ → ∞. Since for the projected RBF SVM, γ −1 acts as a weight on the statistics of the random impulse response, we expect that the projected SVM may be more sensitive to errors in estimating the probabilistic transformation pZ|X when γ −1 is large. Another key difference between the two kernels is that the projected RBF kernel treats the test vector z as a realization of a random vector with nonzero covariance. Conversely, the definition of the expected RBF kernel treats the test point as deterministic.
57
5.2.6
Adapting SVMs Trained on Clean Data to Corrupted Test Features
The presented expected and projected RBF kernels require that statistics (e.g., sample mean and covariance) of the auxiliary channel samples {hi }M i=1 are available to train the SVM. For each new environment, the SVM must be re-trained using the statistics of the stochastic channel. While we believe that it is optimal to train the SVM for the particular environment, as a practical question we considered whether we could train an SVM without knowing the environment, and only adapt the SVM for the environment at test time. When training an SVM, one solves for coefficients {αi }N i=1 which determine the contribution of each training sample as shown in (1.4). Notably, some αi ’s are set to zero in the training process, removing certain training samples from influencing the classifier. Suppose that a kernel function K(·, ·) is selected for SVM classification. For cases in which re-training the SVM for each new environment is undesirable, we propose the following approach: N 1. Train an SVM on the dataset {(xi , yi )}N i=1 with kernel K to obtain the weights {αi }i=1
and bias b in Eq. (1.4); 2. For a new propagation environment, collect auxiliary channel samples {hi }M i=1 and compute relevant statistics; 3. Calculate a bias term for the new environment using the KKT conditions of the SVM [30, p. 374]: N N 1 X 1 − ξi X − αj yj Kte (xi , xj ), b = N yi 0
i=1
j=1
where ξi are the SVM slack variables, and Kte (·, ·) is the channel-robust test kernel function. The new bias b0 minimizes the average label prediction error over all support vectors. 4. Classify the test sample as the sign of f (z) = b0 +
N X i=1
αi yi Kte (z, xi ).
58
This approach is theoretically sub-optimal, since the weights {αi }N i=1 that minimized empirical risk using the kernel K are not optimally suited to the test kernel Kte . Note that the role of the {αi }N i=1 is to weight how important each training sample is in determining a decision boundary, and these relative importance may not change much for the test conditions. Further, re-calculation of the bias term b0 grossly adjusts the decision boundary so that at least the label of the support vectors are, on average, predicted accurately. 5.3
Conclusions
In this chapter, the expected and projected RBF kernels were presented as an alternative to the VE methods. The expected RBF and projected RBF kernels were derived for discretetime signal, images, and subband energy features. The kernels account for the channel or blur that separate training data {(xi , yi )}N i=1 from the test sample z by using a stochastic channel model, where statistics are inferred from the auxiliary channel features {hi }M i=1 . The expected RBF and projected RBF kernels include a Gaussian normalization term that, in the case of subband energy features, depends on the samples being evaluated. In preliminary experiments, it was found that the Gaussian scaling term was sensitive to channel estimation and lead to poorly conditioned kernel matrices. Therefore, the unscaled expected RBF and projected RBF kernels were proposed and shown to be positive definite functions. Lastly, an engineering shortcut was proposed in which an SVM is trained on clean training data using a standard RBF kernel, but at test time, the expected RBF or projected RBF kernel is used in an SVM with an updated bias term. Although suboptimal, the shortcut allows one to train an SVM once, and only update the bias term of the discriminant function for each new propagation environment. Experiments comparing the (unscaled) expected RBF SVM, projected RBF SVM, and the clean-training engineering shortcut for both classifiers are presented in the next chapter.
59
Chapter 6 CLASSIFYING SOUNDS IN REVERBERANT ENVIRONMENTS
As [Henry Eyring and Albert Einstein, colleagues at Princeton] walked together they noted an unusual plant growing along a garden walk. Dr. Eyring asked Dr. Einstein if he knew what the plant was. Einstein did not, and together they consulted a gardener. The gardener indicated the plant was green beans and forever afterwards Eyring said Einstein didn’t know beans. S. K. Franz about Dr. Henry Eyring
This chapter presents three experiments to test the accuracy of the subband energy feature-based classifiers developed in this thesis. First, a controlled experiment is presented, in which simulated narrowband signals are injected into an artificial shallow-water bathymetry using audio-realistic propagation software. The second experiment demonstrates that the algorithms can identify individual Bowhead whales by their vocalizations in a noisy, shallow water environment; data were acquired from whale recordings, but by necessity, they are injected into a shallow-water bathymetry using audio-realistic acoustic propagation software. The third experiment involves real recordings in an outdoor reverberant environment. The aim is to identify trumpeters by the sound of their trumpets; this is a particularly challenging problem, since the trumpeters are playing precisely the same note for precisely the same duration.
60
6.1
Experimental Details
We compare the expected RBF SVM, the expected RBF SVM (clean) trained on uncorrupted training pairs {(uxi , yi }N i=1 , projected RBF SVM, projected RBF SVM (clean) trained on {(uxi , yi }N i=1 and local joint QDA to VE RBF SVM, VE k-NN and to a channel agnostic RBF SVM. All RBF kernels are unscaled. M Given N subband energy feature vectors {uxi }N i=1 and M auxiliary samples {uhi }i=1 ,
we generate VEs for VE RBF SVM and VE k-NN as follows. For each uxi , we generate M VEs by taking uxi with every element of {uhj }M j=1 to form 2 1, j = 1 . . . P. uzij = uhj · uxi + σw
(6.1)
For VE RBF SVM, an SVM is then trained from the M × N VEs; for VE k-NN, k nearest 2 in (6.1) instead neighbors are chosen among the VEs. We chose to use the noise power σw
of generating Gaussian noise draws, since to incorporate a noise draw wf , the VE method would also require the Fourier coefficients xfi and hfj as in (1.7), which are not assumed to be provided for any of the classifiers we compare. M The agnostic RBF SVM is trained on {uxi }N i=1 ; auxiliary channel feature vectors {uhi }i=1
are ignored. For the standard machine learning problem, the training and test data are normalized using the sample means and standard deviations of the training samples. However, in this research the training and test features are related by the expression in (1.7), so that normalizing would not properly center and scale the test data. If m and s are the mean and ˜x = scale, respectively, of the training data, and U
[Ux −m] [s]
is the random variable describing
the normalized training data, then scaling the test data and taking the expectation over Wf and Uh yields � � ¯h ·m Uz − U ˜ Uz = [s]
¯ h + σ2 1 − U ¯h ·m Ux · U w → [s] � 2 � ˜x ·U ¯ h + σw 1 =U [s] expectation
�
˜x ·U ¯ h + σ 2 1, 6= U w
�
61
so that data normalization distorts the relationship between the test and training data when the noise power is non-negligible. Though we cannot normalize the data, we can achieve a similar effect by adjusting the RBF kernel bandwidth parameter. For each dataset, the RBF bandwidth parameter γ is cross-validated over a range of length-scales that are related to the inter-sample distances between points. As a heuristic to choosing reasonable values for γ, we introduce a parameter β that chooses γ −1 as a multiple of the minimum inter-neighbor distance according to a logarithmic scale: γ
−1
=
�
dmax dmin
�β dmin ,
where dmin and dmax are respectively the minimum and maximum inter-sample distances of the training set. Thus, for β = 0, γ −1 = dmin , for β = 1, γ −1 = dmax , and so on. For crossvalidation, we cross-validate β over the set β ∈ {−1.5, −1.25, . . . , 2.25, 2.5}. We allow γ −1 to be greater than the maximum inter-neighbor distance (for β > 1) or less than the minimum inter-neighbor distance (for β < 0) since γ −1 plays the role of a regularization parameter in (5.10), and these larger and smaller values are sometimes chosen. The SVM margin penalty C is cross-validated over the set {1, 101 , 102 , 103 , 104 }. The k-NN classifier cross-validates over a single parameter k ∈ {1, 3, 5, 9, 17, 33, N } (goes like 2n + 1). Since local joint QDA estimates a class-conditional mean and covariance from ky training samples per class, the role of ky differs from that of k. For local joint QDA, we cross-validated over the number of class-specific neighbors ky ∈ {5, 9, 17, 33, |Xy |} and whether to use the maximum-likelihood estimate of the full covariance or assume a diagonal covariance. For each of the classifiers, a tie for the parameter pairs (or single parameter for kNN) that achieved the best cross-validation score was settled by choosing among the best performing parameter pairs randomly with equal probability. 6.2
Classifying Narrowband Acoustic Signals in Simulated Bathymetry
The methodology for creating these data is described in Section 4.3. The dataset consists of subband energies of narrowband signals propagating in a shallow water sonar environment. The training data {(uxi , yi )}N i=1 for each are linearly separable, but were created so that the
62
classes class separation can be altered, resulting in three datasets of varying class separation: easy, medium and hard. Realistic sonar channel impulse responses were generated from the bathymetry in Figure 4.2 by using audio-realistic acoustic propagation software provided in the Sonar Simulation Toolset (SST) [25]. The experiment is set up as follows. There are N = 200 narrowband training signals from two classes. In addition, M = 20 channel impulse responses are provided as part of the training data, from which we compute channel subband energy feature vectors {uhi }M i=1 . The 1800 test signals were formed by convolving an i.i.d. source signal with a randomly drawn channel impulse responses, generated i.i.d. with the training channel impulse responses. Each of the channel impulse responses was generated by first randomly picking a source location in a simulated bathymetry, then simulating with the Sonar Simulation Toolset (SST, see [25]) the propagation of an impulse from that random source location to a fixed receiver location. White Gaussian noise is added to the propagated signal so that the SNR ranges from -10 to 10 dB. Results for easy, medium and hard are shown in Fig. 6.2. The experimental setup differs slightly from Section 4.3 and other publications ([2, 34]). Jamieson et al. [34] compared performance of classifiers for a fixed training time, which necessitated utilizing a smaller number M of auxiliary samples for VE than for expected RBF SVM. In this paper, the experiment is set up to compare performance of algorithms when the same data is available to each, regardless of training time. In addition, in [34], leave-one-out-crossvalidation was performed for each combination of M auxiliary features and N training features. We employ ten-fold cross-validation to determine the values of both γ and C (for SVM) over a classifier-agnostic set of values.
6.2.1
Training Time
� The expected and projected RBF SVM classifiers incur a training cost of O N 3 . However, there is a hidden cost in populating the N × N kernel matrix, since each entry requires computing the inverse of a d × d non-diagonal matrix (see Table 5.3), so that populating the matrix incurs a cost of O(N d d3 ). As noted previously, the VE RBF SVM incurs a training � cost of O M 3 N 3 since the dataset has been increased to a factor of M . Populating
63
120
Seconds to Train
100
expected / projected RBF SVM VE RBF SVM RBF SVM (trained clean)
80 60 40 20 0 0
200 400 600 800 Number of Training Samples
1000
Figure 6.1: SVM training time vs. training set size N for fixed M = 20 used in the simulation experiment. Timing results include the time required to populate the kernel matrix.
the M N × M N RBF kernel is computationally trivial, but if the kernel matrix is precomputed, the expanded dataset places memory restrictions on the usable number M of channel features when the size N of the dataset is large. A plot comparing the training times of expected / projected RBF SVM, VE RBF SVM, and RBF SVM (trained clean) versus the number of training samples is shown in Fig. 6.1—the SVMs were trained using libsvm [12] on a 3.2 GHz Intel Core i7 CPU.
6.2.2
Results
Classification results for simulated data in the synthetic bathymetry are shown in Fig. 6.2. For hard, clean-train expected SVM is the best overall performer with 95% confidence, followed closely by expected SVM and projected SVM, which are statistically tied. VE SVM gives slightly better performance than local joint QDA. A similar trend holds for medium: clean-train expected SVM clean is the best overall performer, followed by projected SVM and VE k-NN (statistically tied overall). For easy, VE SVM is the best overall performer, followed closely by expected SVM clean, then VE k-NN and local joint QDA. In all of these
64
70
accuracy (%)
68 66 64 62 60 58 −10
−5
0 SNR (dB)
5
10
hard 80
accuracy (%)
78 76
Expected RBF SVM
74
Expected RBF SVM (clean)
72
Projected RBF SVM
70
Projected RBF SVM (clean)
68
Local Joint QDA
66
VE RBF SVM VE k-NN
64 −10
−5
0 SNR (dB)
5
10
5
10
medium 85
accuracy (%)
80
75
70
65 −10
−5
0 SNR (dB)
easy
Figure 6.2: Classification accuracy of simulated signals in simulated bathymetry using subband energy features. The datasets hard, medium and easy differ in how well the classes are separated in feature space. Note that the accuracy axis for each plot is on a different scale in order to highlight the relative performance of algorithms. RBF SVM (agnostic) achieves an accuracy of 50% for all SNR in each experiment, and is not shown.
65
experiments, the agnostic SVM, which treats the corrupted test data as though it were not corrupted, produces almost exactly a 50% classification rate, which is as poor as randomly guessing the class label. 6.3
Classifying Bowhead Whale Songs in Shallow Water
Several end notes of Bowhead whale vocalizations for two individuals were extracted from the MobySound archive [46]. Fifteen vocalizations are available for whale 1, and nine vocalizations are available for whale 2. According to the metadata, the end notes of Bowhead whale songs are relatively stable from year to year. Therefore, we hope to be able to acoustically discriminate between two individuals based on previously recorded vocalizations. Our experimental setup simulates a shallow ocean channel (in comparison to the observation distance) at low SNR. Each of the signals has non-negligible interfering noise from bearded seals, sea ice and banging hydrophone cables [46]. The training signals were recorded in April 1988 near the coast of Point Barrow, Alaska. In our experiments, we inject a holdout set of test signals into randomly drawn locations in the simulated bathymetry shown in Fig. 4.2(a). Example vocalizations for each whale are shown in Fig. 6.3. Four frequencies are selected for subband energy features: the two largest amplitude peaks averaged over signals in class 1 (163 and 258 Hz) and the two largest amplitude peaks for class 2 (588 and 207 Hz). The features do not correspond to strong interfering noise. The 24 whale calls are randomly partition into N = 10 training signals (5 from each class), and 14 signals from which to generate multipath-corrupted test signals. For the test signals, Gaussian white noise is added so that the SNR of the multipath signal ranges between −10 and 10 dB. Results in Fig. 6.4 were averaged over 1000 i.i.d. training/test partitions. 6.3.1
Results
Classification results for the whale endnotes experiment are shown in Fig. 6.4. Local joint QDA is clearly the best performer over all SNR with statistical significance. It is noteworthy the local joint QDA is less sensitive to the additive noise, than the other classifiers: at -10 dB SNR, it beats the second best performer by 10%. Though close, VE SVM is a slightly better
66
2000
Frequency (Hz)
1500
1000
500
0
0
1
Time (s)
2
3
2
3
(a) 2000
Frequency (Hz)
1500
1000
500
0
0
1
Time (s)
(b) Figure 6.3: Spectrograms of whale song-endnotes for (a) the first Bowhead whale and (b) the second Bowhead whale. The vocalizations of the second whale tend to be more variable, cover a greater dynamic range, and contain stronger harmonic components than the first whale. Notice that the vocalization in (a) contains interfering calls from a bearded seal from about 800 to 1200 Hz.
67
80 accuracy (%)
Expected RBF SVM
75
Expected RBF SVM (clean) Projected RBF SVM
70
Projected RBF SVM (clean) Local Joint QDA
65
VE RBF SVM VE k-NN
60 −10
−5
0 SNR (dB)
5
10
Figure 6.4: Classification accuracy for identifying Bowhead whales in simulated bathymetry by using subband energy features of the end-notes of their songs. RBF SVM (agnostic) achieves an accuracy of 48% ± 1% for all SNR, and is not shown.
overall performer for this case than clean-train expected SVM with statistical significance greater than 95%. We note that the experimental setup for simulated and Bowhead data is different than in [34] and [2]. In [34], the objective was to compare performance for fixed algorithm training time, which necessitated utilizing a smaller number M of auxiliary features for VE than for expected SVM. Here the experiment is set up to compare performance of algorithms when the same data is available to each, regardless of training time. In addition, in [34], leaveone-out-crossvalidation was performed for each combination of M auxiliary features and N training features. In our experiments, we perform ten-fold cross-validation over the N training features, and auxiliary features are drawn randomly from the available M samples as needed. In [2], we note a mislabeling of SNR in the results, so that in comparing results in this paper to results in [2], it erroneously appears that joint QDA outperforms local joint QDA.
6.4
Classifying Trumpeters in Reverberant Environment
The final experiment uses real signals with real multipath corruption. The classifier must discriminate between professional musicians playing the same note on either a trumpet
68
(a)
(b)
Figure 6.5: (a) Matthew Swihart on trumpet and (b) Edward Castro on cornet in an anechoic chamber.
or cornet in a reverberant environment. The training dataset consists of subband energy features extracted from recordings of two different professional trumpet players. Recordings of Matthew Swihart (Matt) and Edward Castro (Ed) playing concert F in an anechoic chamber (Fig. 6.5) on their own trumpet and cornet yield four classes: Matt Trumpet, Matt Cornet, Ed Trumpet, Ed Cornet. Each of the recordings was clipped to be precisely 1 second in duration. Using the four classes we constructed six different classification problems: Ed Cornet vs Ed Trumpet, Matt Cornet vs Matt Trumpet, Matt Trumpet vs Ed Trumpet, Matt Cornet vs Ed Cornet, Matt Trumpet vs Ed Cornet, and Matt Cornet vs Ed Trumpet. Test signals were recorded in an outdoor semi-enclosed breezeway with a reverberation length of about 1 second. For a controlled experiment, each anechoic signal was played back in the breezeway through high-quality speakers in a fixed location, as well as quadratic chirps to estimate the channel’s impulse response. These signals were recorded at four locations with the same recorder, in stereo at a 48kHz sample rate and 16 bits per sample for exactly 2 seconds. When classifying z[n] that corresponds to an anechoic signal x[n], features of x[n] and its stereo pair were excluded from the training set. An example training signal, test signal and an estimated impulse response are shown in Figure 6.6. Figure 6.7 shows a scatterplot of the training and test data on logarithmic axes; the dataset shift is obvious.
69
energy (dB)
100 50 0 −50 −100
0
500
1000 1500 frequency (Hz)
2000
(a)
energy (dB)
100
50
0
−50
0
500
1000 1500 frequency (Hz)
2000
(b) 0.01 0.005 0 −0.005 −0.01
0
0.2
0.4 0.6 time (s)
0.8
1
(c) Figure 6.6: (a) The energy spectrum of concert F played by Ed on the cornet in the anechoic chamber; (b) the energy spectrum of a test signal generated by playing back the recorded note in an echo chamber; and (c) an impulse response estimated by probing the outdoor breezeway with a quadratic chirp.
70
++++++ + + + ++ − + + + + + + ++ ++++ +−− + − −− + −− − −−− −− −
7
10
6
10
++ + + + ++++ + + + + +++ + + − + + + − − + + + + + ++ + ++−−+−++ +++ + + + + + + + + − − − + + + − − + + + − − + + + −+−−−−−+ −−−−− +− 5 − +− + − + + + + − − 10 + −−−−− − ++ −−+ +−−− − − − − + −−+−−− − −−− −−−− − − − − 4 10
6
10
Figure 6.7: Training (upper right) and test features (lower left)—corresponding to subband energies at fundamental and first harmonic—plotted together on a log-log plot, where Ed Cornet is denoted by - and Matt Trumpet is denoted by +.
Features were taken to be the subband energies at the frequencies h iT f = 349 698 1048 1397 1746 347 351 (Hz), corresponding to the fundamental frequency f0 = 349 Hz, the first four harmonics, and 2 was taken to be f0 − 2 and f0 + 2 to capture the width of the fundamental. Noise energy σw
the median energy level across all frequency bins. Results in Table 6.1 were averaged over the four different locations. 6.4.1
Results
Table 6.1 shows that in all datasets except Matt Trumpet v. Ed Cornet, expected SVM is the best performer or statistically tied with the best performer, and in Matt Trumpet v. Ed Cornet, it is the second best performer. Likewise, local joint QDA is the best (or tied for best) performer in all tests—including Matt Trumpet vs. Ed Cornet, which apparently was the most challenging comparison—except Matt Cornet v. Matt Trumpet, for which it is the second best classifier. VE SVM is tied with expected SVM as the best performer in Matt Cornet v. Ed Cornet. Projected SVM and clean-train projected SVM—which yield similar results in most experiments—perform better than VE SVM in 3 experiments. The cleantrain expected SVM classifier does not perform well on the trumpet/cornet experiments.
74.8 68.6 57.6 55.2 73.2 73.0 71.0 51.2
Expected RBF SVM (clean)
Projected RBF SVM
Projected RBF SVM (clean)
Joint QDA
VE RBF SVM
VE k-NN
RBF SVM (agnostic)
49.7
56.4
68.0
72.0
63.9
56.4
52.0
72.0
Ed Trumpet
Ed Cornet
Expected RBF SVM
Matt Trumpet v.
Matt Cornet v.
57.7
77.7
72.5
80.7
76.9
73.7
57.9
82.9
Matt Trumpet
Matt Cornet v.
51.3
60.4
51.0
61.2
57.1
57.4
52.4
60.3
Ed Trumpet
Ed Cornet v.
52.5
73.8
66.9
81.1
69.8
68.0
57.3
82.3
Ed Trumpet
Matt Cornet v.
62.8
60.4
61.1
65.4
58.1
59.1
60.4
60.4
Ed Cornet
Matt Trumpet v.
Table 6.1: Trumpet Playback Results Averages. Bolded items in each column are statistically tied with 95% confidence using a one-sided Wilcoxon sign rank test.
71
72
6.5
Summary of Experimental Results
First, we note that the agnostic RBF SVM, which ignores the channel, fails miserably for almost all of these experiments, and thus some form of channel-adaptation should be used. However, given how poor the channel estimates were for these experiments (especially for the trumpet classification), the classification gains produced by the adapted methods were pleasantly surprising. The clean-train expected/projected SVM classifiers have the least channel adaptation. They use the SVM coefficients {αi } trained on the clean training data, and only adapt the kernel at test time to attempt to better model similarity between the test sample and training sample. Both clean-train SVMs do significantly better than the agnostic over the datasets, suggesting that adapting only the kernel is worthwhile. The clean-train projected SVM generally performs worse than the clean-train expected SVM. We hypothesized that the expected SVM would always do better than its clean-train counterpart because its coefficients were trained for the test-environment. Surprisingly, for both experiments using the bathymetry to generate sonar impulse responses, the expected RBF SVM clean consistently does better than the expected RBF SVM. However, the expected RBF SVM clean does not do well at the trumpet identification. We suspect that this is because the channels impulse response estimates were not of sufficient quality, to which the clean-train algorithms are sensitive. Overall, the expected and projected kernels performed similarly, with very comparable performance on the simulation results, a win for projected on the real whale data, and a win for expected on the real trumpet data. Based on comparing the mathematical formulas of the expected and projected RBF, we hypothesize that the projected RBF kernel will be more sensitive to the quality of the channel estimation errors. This hypothesis is supported by the experimental results showing that projected RBF SVM performs comparatively worse than other algorithms with the poor-quality estimates of the reverberation channels in the breezeway, whereas it was competitive in experiments with simulated multipath. The VE methods performed poorly on the trumpet data relative to the expected SVM, but comparably when given the simulated bathymetry channels. This may be because
73
the regularization inherent in expected SVM by aggregating the example channels into a channel mean and covariance is more helpful when the channel examples are poor, as in the case of the trumpet data. Further, the VE methods do better relative to the proposed expected/projected kernels on problems where the classes are easier to separate: such as the easy simulation and the whale problem. But the VE methods do worse relative to the proposed expected/projected kernels on problems where the classes are harder to separate: such as the hard simulation and the trumpet problem. The clean-train expected SVM performs comparably to the VE SVM for all the simulated channel problems despite taking orders of magnitude less training time, but performs slightly worse on the trumpet datasets. We found local joint QDA to be the most robust classifier. Its performance on the trumpet data is tied for best, it is the clear winner in distinguishing the whales, and it performs fairly well with the narrowband signal experiment. Also, compared to the SVM classifiers, we found the local joint QDA method to be much more robust to the choice of its cross-validation parameters. 6.6
Conclusion
This chapter has compared several classifiers to address the dataset shift problem that occurs in signal classification problems when the differences between training and test conditions can be modeled by a linear time-invariant channel and additive Gaussian white noise. Experiments with simulated and real data revealed the following trends. On easier problems, where the classes were well-separated and the channels were realistic but simulated, the VE methods performed well. On harder problems, where the classes are less wellseparated and the channel estimation was poorer, the expected and projected kernel SVMs performed better. In particular, the expected kernel seemed most robust to non-idealistic conditions, but less able to take advantage of good conditions. In addition, not only are the expected/projected kernels theoretically much faster to train due to the O(N 3 ) complexity of the SVM training procedure, that in practice with even relatively small sample sizes they were significantly faster to train. Under cleaner conditions, it was surprising to see that the clean-train expected SVM outperformed the expected SVM, and was often the best performer of all the considered
74
methods. Notably, clean-train SVMs are the fastest SVMs to train. Throughout, the local joint QDA method performed consistently well, was robust to parameter choices and estimates, and is trivial to train. Modifying local joint QDA for the problem of estimating Gaussian parameters in high dimensions with few training samples is straightforward by applying results the in [60]. While further experimental studies with a wider variety of channels and data are needed, our advice to practitioners based on the experimental evidence we have is to use the cleantrain expected SVM is not considered too severe, and—since they seem to be more forgiving classifiers—to use the expected SVM or local joint QDA if the channels are thought to be highly corrupting or poorly estimated.
75
Chapter 7 EXTENSIONS AND CONCLUSIONS A scientist’s accomplishments are equal to the integral of his ability integrated over the hours of his effort. Dr. Henry Eyring, chemist
A summary of the contributions of this thesis are presented in Section 7.1. Section 7.2 includes a discussion of the limitations of the framework and algorithms presented in previous chapters. Finally, the thesis concludes in Section 7.3 with suggested directions for future work. 7.1
Contributions
This thesis focused on deriving classifiers for test samples that are corrupted by a noisy linear time-invariant system given clean training examples. This traditionally signal-processing problem was recast in a machine learning framework in Chapter 1, and by doing so, a previously unpublished flavor of dataset shift was formally proposed. The classifiers introduced to solve this dataset shift problem are broadly categorized by their design to perform joint deconvolution and classification, and differentiated by the modeling assumptions and requirements. Signal-based classifiers were presented in Chapter 3. The joint MAP classifier jointly estimates the signal, channel estimate and class label via the MAP rule. Although the objective function is not convex, reasonable deconvolution estimates and class labels are produced in practice. If the goal is only to produce an estimate of the class label, then better performance is achieved by probabilistically accounting for the convolution model using the joint QDA classifier. The joint QDA classifier models the class-conditional test signal as Gaussian so that an explicit model for the impulse response is not needed.
76
The joint MAP and joint QDA signal-based classifiers may be difficult to apply in practice, since both algorithm require the inversion of an L × L covariance matrix (for discretetime signals of length L). Nevertheless, both algorithms outperformed the Cabrelli blind deconvolution method followed by matched-filter classification, and motivate the value in considering deconvolution jointly with classification. The joint QDA classifier was derived in Chapter 4 for subband energy features, which are useful discrimining features for the passive acoustic experiments in Chapter 6. The Gaussian assumption underlying joint QDA was relaxed to reduce model bias; instead the assumption is that p(z|y) is locally Gaussian. Joint QDA is a good utility classifier: it exhibited good performance across the datasets considered in this thesis, was robust to specific assignment of the class neighborhood parameter ky , and exhibited robustness to noisy channel estimates. As a generative classifier, it can be naturally extended to report confidence, incorporate prior information, and operate as a one-class classifier. Since the class-conditional mean and covariance must be estimated from samples, methods for robustly estimating Gaussian distributions from few samples, as in [60], make it generally applicable. The joint QDA derivation for second order statistics of subband energy features in the appendix (Section B.1) was also a basis for deriving channel-robust kernels in Chapter 5. The expected kernel measures the average similarity between training samples, averaged over the stochastic channel model p(z|x). The projected RBF kernel was derived by “projecting” a Gaussian RBF through the stochastic channel model. It was found that the Gaussian scaling factors of the kernel functions were sensitive to channel estimation errors. So unscaled versions of each kernel were presented, and were shown to be positive definite functions. The expected RBF and projected RBF kernels were proposed as an alternative to the RBF SVM trained on VEs, since training time is dramatically reduced for a large number M of auxiliary channel features. Experiments showed that not only did the proposed kernels require less time to train, but more often than not exhibited superior performance. The robust kernels presented in Chapter 5 represent a richer development of an earlier version of the expected kernel presented in [34]. For additional savings in training time, an engineering shortcut was proposed for training an SVM once on clean data, then adjusting the bias term and kernel in the discriminant
77
function for each new environment encountered; though suboptimal, no retraining is required. Experiments showed that the clean-trained classifiers performed well on simulated data, but did not perform as well on real data. In all, five subband feature-based classifiers were presented and tested in experiments: expected RBF SVM, expected RBF SVM clean, projected RBF SVM, projected RBF SVM clean, and the sole generative classifier, local joint QDA. Across all datasets, the local joint QDA classifier gave the best performance, and is the simplest to train. The expected RBF SVM also gave very good performance, and seemed to be especially forgiving of low-quality channel impulse response estimates in the real-data experiment. The projected RBF SVM was shown to be susceptible to choices of γ and channel statistics. 7.2
Limitations
The problem setup assumes two criteria that may not be met in practice. First, clean training samples {xi }N i=1 are assumed. In practice, it may be more likely that training ˜ i ∗ xi + wi ; that is, the training ˜i = h samples of the form {˜ zi }N i=1 are available, where z samples themselves are corrupted with a channel and noise that may be unique to that particular training sample. The challenge then is to collect auxiliary compound-channel ˜ −1 ∗ h, so that z = features {gi }M i=1 distributed i.i.d. from the same distribution as g = h ˜+w ˜ accounts for the effects of the training and test corrupting channels. Secondly, it is g∗z assumed that auxiliary channel features {hi }M i=1 are drawn i.i.d. from the same distribution as the true corrupting impulse response h, but often, the auxiliary channel features and the test channel may suffer from their own form of dataset shift. Robustness to these conditions has not been rigorously explored, but in real data experiments where both of these conditions have been violated to some degree, reasonable performance was achieved by the classifiers. Each classifier presented in this thesis has been derived for two kinds of features: discrete time signal features and subband energy features. Extending the classifiers to feature maps that are a linear function of the signal, φ(x) = Ax, is straightforward. However, the features that a particular researcher finds compelling for class discrimination are many. For example, this thesis has not derived classifiers that use cepstral coefficients as features,
78
but their use as discriminating features for, e.g., speech recognition is well documented [8]. (In the noiseless case, the relationship would be trivial, since for cepstral coefficient vector zc = hc + xc is a simple additive model. But noise complicates the relationship.) Alas, for every kind of feature that one may wish to employ, a new derivation of the classifier or kernel is required. This may be intractable for choices of features that are not simple functions of the underlying signal. On a related note, this thesis has not explored using several feature types. For traditional machine learning methods, the “features” may consist of a mixed bag of descriptions about the object of interest. But, in this thesis, only a homogeneous feature choice for the elements of x are considered. Since each of the classifiers in this thesis requires second-order statistics of the test features, a first step towards a “mixed bag” is to derive the cross-correlation between, for example, discrete-time features and subband energy features. Although the expected kernel in Chapter 5 was defined for any kernel K, derivations are presented only for the RBF kernel, which is the most popularly used kernel. Derivations for the linear kernel were presented with an early version of the expected kernel in [34]. 7.3
Future Work
Local Joint QDA, the expected kernel SVM and the projected RBF kernel SVM proposed in this thesis solve the dataset shift problem by implicitly transforming the training distribution pXY to pZY using a forward convolution model: they are z-space classifiers. Certainly, one might derive other z-space classifiers the leverage the tools developed in this thesis. One of the chief limitations listed above is that the conditional distribution pZ|X must be modeled from the function relationship of X and Z for each new choice of features. An ambitious remedy is to estimate pZ|X directly from the data. This might be accomplished in a semi-supervised learning paradigm, in which a batch of unlabeled test points {zi }Q i=1 is provided in conjunction with the labeled training points {(xi , yi )}N i=1 [68]. For covariate shift, kernel mean matching is used to estimate the ratio
pte (x,y) ptr (x,y)
from the data, without
explicitly modeling the distributions [53, Ch. 8]. A key motivation for using a forward convolution model is to avoid ill-posed deconvolution. As noted in Section 1.2.1, the convolution operator has a null space that corresponds
79
to zeros of the system’s frequency response; multipath channels contain zeros due to destructive interference. A similar motivation comes from the data processing theorem [13, ˆ is Theorem 2.8.1] which states (in the notation of this thesis) that if random variable X estimated from Z, where Z has been generated from an underlying source X, as a Markov ˆ then chain X → Z → X, ˆ I(X; Z) ≥ I(X; X), where I(X; Z) is the mutual information between X and Z. In other words, processing the ˆ ) can only destroy information. data (for example, finding a deconvolution estimate x ˆ Nevertheless, there are practical reasons why one may wish to classify an estimate x rather than the observation z. For example, z may be of very high dimension when compared ˆ . Or x may represent the output of another system, such as a Kalman tracker [14]. The to x following section presents an overview of robust x-space classifiers—developed in parallel with the z-space classifiers in this thesis—as an alternative approach to solving the dataset shift problem, elements of which were published in [3].
7.3.1
Robust Classifiers for Probabilistic Deconvolution
In this section, let us posit the existence of p(x|z) that represents the density over all possible ˆ from the distribution p(x|z) would represent a deconvolution estimates of z. A draw x feasible deconvolution estimate of z. It is assumed that a density p(x|z) can be inferred M from the test sample z, training samples {(xi , yi )}N i=1 , and auxiliary training pairs {hi }i=1 .
Then, the objective of robust x-space classifiers is to assign a class label to p(x|z) given training pairs {(xi , yi )}N i=1 . A depiction of this problem is shown in Figure 7.1. While theoretically convenient, it is quite challenging to model p(x|z) in practice. In this section, a very simple case is considered, in which it is assumed that the test sample and unknown (true) sample are related by z = Hx + w, where the matrix H = convmtx(h) is a known. This is a degenerate case of the dataset shift problem depicted in Figure 1.2, in which the set of auxiliary channel features has a
80
+ + ++ + + + -?
- -- - -
Figure 7.1: Depiction of the problem setup for robust x-space classifiers, in which the labeled training examples (+ and –) are used to infer the class label of a distribution over deconvolution estimates, p(x|z), represented by its mean (marked ?) and standard deviation contours.
single element h. For additional simplicity, it is assumed that x and z are draws from a jointly Gaussian distribution, x 0 Σ N ; , z 0 HΣT
ΣH T HΣH T
+
�−1 2 σw I z,
�
2I σw
,
so that p(x|z) = N (x; mx|z , Σx|z ) =N
x; ΣH
T
HΣH + T
Σ
−1
HT H + 2 σw
�−1 ! ,
(7.1)
which follows from conditional independence of jointly Gaussian random variables [61]. � 2 I −1 z, which is Note that the mean of the distribution p(x|z) is mx|z = ΣH T HΣH T + σw precisely the linear minimum mean-squared error (LMMSE or Wiener) deconvolution of z [47]. With this theoretically convenient setup, in the following subsections, closed form solutions are derived for local QDA and SVM classifiers that operate on the deconvolution density p(x|z).
Robust Local QDA First, consider the following definitions.
81
Definition 2. Expected Maximum Likelihood (Expected ML) Rule. Given the distribution p(x|z), define the expected ML rule as y ∗ = arg max E [X|z] p(X|y) y Z = arg max p(x|y)p(x|z) dx. y
(7.2)
Equation (7.2) generalizes the traditional ML rule in the case of no uncertainty for which p(x|z) = δ(x − z). Definition 3. Expected Nearest Neighbor to a Random Test Sample. Given a random variable X with finite mean m and covariance Σ, and given training samples {xi }N 1=1 , define the nearest neighbor of X to be x` where ` solves � � 4 ` = arg min EX kX − xi k2 i=1,...,N
h i = arg min EX (X − xi )T (X − xi ) i=1,...,N
= arg min xTi xi − 2xTi m + tr Σ + mT m i=1,...,N
= arg min kxi − mk2 , i=1,...,N
since Σ does not depend on i. Note that Definition 3 differs from Definition 1 in Section 4.2, since in Definition 3, only the test point is a random variable; in Definition 1, only the training points are random variables. Local robust QDA for classifying a deconvolution density is derived using Definition 2, where p(x|y) is assumed to be locally Gaussian with (local) class-conditional mean mx|y and covariance Σx|y estimated from the ky expected nearest neighbors of class y using Definition 3. Then, since p(x|z) is Gaussian, y ∗ = arg max
Z
= arg max
Z
p(x|y)p(x|z) dx
y
y
N (x; mx|y , Σx|y )N (x; mx|z , Σx|z ) dx
= arg max N (mx|z ; mx|y , Σx|y + Σx|z ) y
82
using the product of Gaussians rule in (A.9), and where mx|z and Σx|z are given in (7.1). Thus, the robust local QDA classifier is precisely the same form as a local QDA classifier operating on a deconvolution estimate mx|z , but with class-conditional covariance regularized by Σx|z . A Bayesian approach to estimate class-conditional Gaussians from few samples was presented in [60], which applied to the robust local QDA classifier results in the robust local BDA classifier presented in [3].
Expected Discriminant for Robust SVM Consider a discriminant classifier, such as an SVM, that classifies a test sample x as sgn(f (x)), and define the expected discriminant as follows. Definition 4. Expected discriminant. Let random vector X be distributed as the deconvolution density p(x|z). Then, define the expected discriminant as EX|z [f (X)] . For the SVM with RBF kernel, f (x) = b +
i=1 αi yi K(x, xi )
PN
so that for p(x|z) given in
(7.1), the expected discriminant becomes EX|z [f (X)] = b +
Z p(x|z)
N X
αi yi K (x, xi ) dx
i=1
=b+
N X
Z
p (x|z) K (x, xi ) dx
Z
� � N x; mx|z , Σx|z N x; xi , γ −1 I dx
α i yi
i=1
=b+ =b+
N X i=1 N X
α i yi
� αi yi N mx|z ; xi , Σx|z + γ −1 I ,
i=1
using the product of Gaussians rule in (A.9). Thus, if the SVM is trained using an RBF kernel with bandwidth (inverse covariance) parameter γ, it may be applied to the deconvolution density p(x|z) by using a new kernel with covariance Σx|z + γ −1 I.
83
7.3.2
Forward Model or Inverse Model?
To conclude, there are merits and disadvantages of both x-space and z-space classifiers. In both cases, a key challenge is modeling the relationship of pXY to pZY , although modeling is arguably more difficult for x-space classifiers. For z-space classifiers, pZY is factored as pZ|X pXY so that pZ|X is the distribution to estimate. For example, the class-conditional R distribution in joint QDA can be expressed as p(z|y) = p(z|x)p(x|y) dx; likewise, the expected kernel and projected RBF kernel employ pZ|X . In this thesis, the functional relationship between X and Z was used to estimate first- and second-order moments of pZ|X . For x-space classifiers, the distribution of interest is pX|Z , which due to ill-posed deconvolution is generally difficult to model. As an example, for subband-energy features, estimating pX|Z as a Gaussian requires estimating the conditional mean and variance of [rewriting (1.7) in terms of ux ]: h n oi ∗ uz − uw − 2 Re xf · hf · wf ux = , [uh ] ∗
which exhibits circular dependence, since ux = xf · xf . However, if pX|Z can be modeled, then x-space classifiers are arguably more convenient than z-space classifiers. For example, the z-space RBF SVMs in Chapter 5 require that the SVM be retrained for each new environment, unless an engineering shortcut is employed. In contrast, an x-space SVM need only be trained once, as in Section 7.3.1; different manifestations of the environment are captured by p(x|z), which is needed only at test time. As is so often the case in signal processing and statistical learning, the central issue in either approach is modeling.
84
BIBLIOGRAPHY [1] Y. S. Abu-Mostafa. Learning from hints in neural networks. J. Complexity, 6(2):192– 198, 1990. [2] H. S. Anderson and M. R. Gupta. Joint deconvolution and classification with applications to passive acoustic underwater multipath. J. Acous. Soc. Am., 124(5):2973–2983, November 2008. [3] H. S. Anderson and M. R. Gupta. Classifying linear system outputs by robust local Bayesian quadratic discriminant analysis on linear estimators. Proc. IEEE SSP, 2009. [4] B. W. Bader and T. G. Kolda. MATLAB tensor classes for fast algorithm prototyping. ACM Transactions on Mathematical Software, 32:635–653, 2006. [5] S. Bickel, M. Br¨ uckner, and T. Scheffer. Discriminative learning under covariate shift. J. Mach. Learn. Res., 10:2137–2155, 2009. [6] S. Boyd and L. Vandenberghe. Convex Optimization. Cambridge University Press, 2004. [7] M. K. Broadhead and L. A. Pflug. Performance of some sparseness criterion blind deconvolution methods in the presence of noise. J. Acoust. Soc. Am., 107(2):885–893, Februrary 2000. [8] L. Buera, E. Lleida, A. Miguel, A. Ortega, and O. Saz. Cepstral vector normalization based on stereo data for robust speech recognition. IEEE Trans. Audio, Speech and Lang. Proc., 15(3):109–1113, March 2007. [9] C. A. Cabrelli. Minimum entropy deconvolution and simplicity: A noniterative algorithm. Geophysics, 50:394–413, 1984. [10] E. Candes. Compressive sampling. Proc. Int. Congress of Math., 3:1433–1452, 2006. [11] D. A. Caughey and R. L. Kirlin. Blind deconvolution of echosounder envelopes. Proc. IEEE ICASSP, pages 3149–3152, 1996. [12] C.-C. Chang and C.-J. Lin. LIBSVM: a library for support vector machines, 2001. Software available at http://www.csie.ntu.edu.tw/~cjlin/libsvm.
85
[13] T. M. Cover and J. A. Thomas. Elements of Information Theory. Wiley & Sons, Inc., Hoboken, NJ, 2006. [14] J. L. Crassidis and J. L. Jundkins. Optimal Estimation of Dynamic Systems. CRC Press, 2002. [15] N. Dasgupta and L. Carin. Time-reversal imaging for classification of submerged elastic targets via Gibbs sampling and the relevance vector machine. J. Acoust. Soc. Am., 117(4):1999–2011, 2005. [16] D. Decoste and B. Sch¨ olkopf. Training invariant support machines. Mach. Learn., 46:161–190, 2002. [17] R. Duda, P. Hart, and D. Stork. Patter Classification. John Wiley & Sons, Inc., 2nd edition, 2001. [18] J. E. Ehrenberg, T. E. Ewart, and R. D. Morris. Signal-processing techniques for resolving individual pulses in a multipath signal. J. Acoust. Soc. Am., 63(6):1861– 1865, June 1978. [19] T. E. Ewart, J. E. Ehrenberg, and S. A. Reynolds. Observations of the phase and amplitude of individual Fermat paths in a multipath environment. J. Acoust. Soc. Am., 63(6):1801–1808, June 1978. [20] R. E. Fan, P. H. Chen, and C. J. Lin. Working set selection using the second order information for training SVM. J. Mach. Learn. Res., 6:1889–1918, 2005. [21] R. L. Field. Transient signal distortion in a multipath environment. Proc. OCEANS, pages 111–114, 1990. [22] J. H. Friedman. Regularized discriminant analysis. J. Am. Stat. As., 84(405):165–175, 1989. [23] E. K. Garcia, S. Feldman, M. R. Gupta, and S. Srivastava. Completely lazy learning. IEEE Trans. Knowledge Data Engineering, 2009. [24] M. G. Genton. Classes of kernels for machine learning: A statistics perspective. J. Mach. Learn. Res., 2:299–312, March 2002. [25] R. P. Goddard. The Sonar Simulation Toolset, Release 4.6: Science, Mathematics, and Algorithms. Technical Report A352884, University of Washington Applied Physics Lab, 2008.
86
[26] B. K. Gunturk, A. U. Batur, Y. Altunbasak, M. H. Hayes, and R. M. Mersereau. Eigenface-domain super-resolution for face recognition. IEEE Trans. Imag. Proc., 12(5), May 2003. [27] M. R. Gupta and H. S. Anderson. Maximum likelihood signal classification using second-order blind deconvolution probability model. Proc. IEEE SSP, 2007. [28] M. R. Gupta, H. S. Anderson, and Y. Chen. Joint deconvolution and classification for signals with multipath. Proc. IEEE ICASSP, 2007. [29] B. Haasdonk and H. Burkhardt. Invariant kernel functions for pattern analysis and machine learning. Machine Learning, 68:35–61, 2007. [30] T. Hastie, R. Tibshirani, and J. Friedman. The Elements of Statistical Learning. Springer, 2001. [31] R. Horn and C. R. Johnson. Matrix Analysis. Cambridge University Press, 1985. [32] L. Isserlis. On a formula for the product-mean coefficient of any order of a normal frequency distribution in any number of variables. Biometrika, 12:134–139, 1918. [33] A. K. Jain. Fundamentals of Digital Image Processing. Prentice Hall, 1989. [34] K. Jamieson, M. R. Gupta, E. Swanson, and H. S. Anderson. Training a support vector machine to classify signals in a real environment given clean training data. Proc. IEEE ICASSP, 2010. [35] T. Jebara. Machine Learning: Discriminative and Generative. Kluwer Academic Publishers, 2004. [36] T. Jebara, R. Kondor, and A. Howard. Probability product kernels. J. Mach. Learn. Res., 5:819–844, 2004. [37] J. N. Kapur. Maximum-entropy models in science and engineering. Wiley Eastern Limited, 1993. [38] D. H. Kil and F. B. Shin. Pattern Recognition and Prediction with Applications to Signal Characterization. AIP Press, Woodbury, New York, 1996. [39] L. E. Kinsler and A. R. Frey. Fundamentals of Acoustics. John Wiley & Sons, Inc., 2nd edition, 1962. [40] A. Kirsch. An Introduction to the Mathematical Theory of Inverse Problems. Springer, 1996.
87
[41] T. G. Kolda and B. W. Bader. Tensor decompositions and applications. SIAM Review, 51(3):455–500, 2009. [42] Edmund Y. Lam and Joseph W. Goodman. Iterative statistical approach to blind image deconvolution. J. Opt. Soc. Am., 17(7):1177–1184, July 2000. [43] H. Liu, P. Runkle, and L. Carin. Classification of distant targets situated near channel bottoms. J. Acoust. Soc. Am., 115(3):1185–1197, 2004. [44] A. J. Llorens, T. L. Philip, I. W. Schurman, and C. R. Lorenz. Enhancing passive automation performance using an acoustic propagation simulation. J. Acoust. Soc. Am, 125(4):2577, April 2009. [45] P. Loughlin and L. Cohen. Moment features invariant to dispersion. Proc. SPIE, 5426(235), 2004. [46] David K. Mellinger and Christopher W. Clark. Mobysound: A reference archive for studying automatic recognition of marine mammal sounds. J. App. Acous., 67(1112):1226–1242, Nov-Dec 2006. [47] T. K. Moon and W. C. Stirling. Mathematical Methods and Algorithms for Signal Processing. Prentice Hall, 2000. [48] F. D. Neeser and J. L. Massey. Proper complex random processes with applications to information theory. IEEE Trans. Info. Theory, 39(4), July 1993. [49] G. Okopal and P. Loughlin. Feature extraction for classification of signals propagating in channels with dispersion and dissipation. Proc. SPIE, Aut. Target Rec., 6566, 2007. [50] G. Okopal, P. Loughlin, and L. Cohen. Dispersion-invariant features for classification. J. Acoust. Soc. Am, 123(2):832–841, February 2008. [51] G. Okopal and P. J. Loughlin. Propagation-invariant classification of signals in channels with dispersion and damping. OCEANS, 2007. [52] A. P. Petropulu and C. L. Nikias. Blind deconvolution using signal reconstruction from partial higher order cepstral information. IEEE Trans. Signal Processing, 41(6), June 1993. [53] J. Qui˜ nonero-Candela, M. Sugiyama, A. Schwaighofer, and N. D. Lawrence, editors. Dataset Shift in Machine Learning. MIT Press, 2009. [54] B. Raj and R. M. Stern. Missing-feature approaches in speech recognition. Sig. Proc. Magazine, (5):101–116.
88
[55] M. J. Roan, M. R. Gramann, J. G. Erling, and L. H. Sibuld. Blind deconvolution applied to acoustical systems identification with supporting experimental results. J. Acoust. Soc. Am., 114(4):1988–1996, 2003. [56] B. Sch¨olkopf, C. Burgess, and V. Vapnik. Incorporating invariances in support vector learning machines. Int’l Conf. Neural Networks, pages 47–52, 1996. [57] B. Sch¨olkopf, P. Simard, A. Smola, and V. Vapnik. Prior knowledge in support vector kernels. Adv. in Neural Inf. Proc. Sys., 1998. [58] S. Senmoto and D.G. Childers. Signal resolution via digital inverse filtering. IEEE Trans. Aer. & Elec. Sys., 8(5):644–640, 1972. [59] F. B. Shin, D. H. Kil, and R. Wayland. IER clutter reduction in shallow water. Proc. IEEE ICASSP, pages 3149–3152, 1996. [60] S. Srivastava, M. R. Gupta, and B. A. Frigyik. Bayesian quadratic discriminant analysis. J. Mach. Learn. Res., 8:1277–1305, 2007. [61] H. Stark and J. W. Woods. Probability and Random Proceses with Applications to Signal Processing. Prentice Hall, 3rd edition, 2002. [62] D. J. Strausberger, E. D. Garber, N. F. Chamberlain, and E. K. Walton. Modeling and performance of HF/OTH radar target classification systems. IEEE Trans. Aer. & Elec. Sys., 28(2):396–403, 1992. [63] D. W. Tufts, I.P. Kirsteins, R. J. Vaccaro, C. S. Ramalingam, and A. Shah. Improvements in signal processing for time-varying multipath propagation environments. Proc. OCEANS, 1:586–593, 1991. [64] R. J. Urick. Principles of Underwater Sound. McGraw-Hill, 3rd edition, 1983. [65] R. A. Wiggins. Minimum entropy deconvolution. Geoexploration, page 2135, 1978. [66] R. W. Yeung. A First Course in Information Theory. Springer, 2002. [67] Q. Zhu and B. Steinberg. Correction of multipath interference using clean and spatial location diversity. Proc. IEEE Ultrasonics Symp., pages 1367–1370, 1995. [68] Xiaojin Zhu. Semi-supervised learning literature survey. Technical Report 1530, Computer Sciences, University of Wisconsin-Madison, 2005.
89
Appendix A USEFUL IDENTITIES The following identities are used frequently in this thesis. A.1
Convolution and Hadamard Product of Vectors
For any vectors a, b ∈ Cd , scalar β ∈ C, � � (a ∗ b) (a ∗ b)T = aaT ∗ ∗ bbT � � (a · b) (a · b)T = aaT · bbT abT · (βI) = β diag (a · b) ,
(A.1) (A.2) (A.3)
which can be verified by writing the relationships in summation form. For A ∈ Cn×n , h ∈ Cp and H = convmtx(h) ∈ Cm×n , h1 · · · hp 0 0 h1 · · · hp convmtx(h) = .. .. . . 0 · · · 0 h1
where m = n + p − 1 and ··· 0 ··· 0 .. , .. . . · · · hp
it can also be shown that HAH T = A ∗ ∗hhT . A.2
Convolution and Hadamard Product of Tensors
The properties for vectors in (A.1) and (A.2) can be generalized for tensors. Let A and B be d-order tensors with A ∈ Rm1 ×···×md and B ∈ Rn1 ×···×nd , and let ∗d denote the d-dimensional discrete convolution sum. Then, it is simple to verify (for example, using Einstein summation convention), that � � � � A ∗d B ◦ A ∗d B = (A ◦ A) ∗2d (B ◦ B) (A · B) ◦ (A · B) = (A ◦ A) · (B ◦ B) ,
(A.4)
90
where the tensor outer product A ◦ B is a 2d-order tensor with dimensions m1 × n1 × · · · × md × nd . A.3
Proper White Gaussian RVs
Let V ∈ Cd be a complex Gaussian random vector that is zero mean, white, and proper. By definition of proper complex vectors [48], � � � � E VVH = E V∗ VT = σv2 I � � E VVT = 0.
(A.5) (A.6)
Since V is zero-mean and Gaussian, the third moment is zero, which implies � � � � E (V · V∗ ) VT = E (V · V∗ ) VH h i h i = E V (V · V∗ )T = E V∗ (V · V∗ )T = 0.
(A.7)
Then, using Isslerlis’ Gaussian moment theorem [32], it is straightforward to show that i h E (V · V∗ ) (V · V∗ )T = σv4 I + σv4 11T ,
(A.8)
where 11T is a matrix of all ones. A.4
Product of Gaussians Identity
Lastly, for x, a ∈ Rn , A ∈ Sn++ , P ∈ Rm×n , b ∈ Rm and B ∈ Sm ++ , � N (x; a, A)N (P x; b, B) = N b; P a, B + P AP T N (x; c, C) , � �−1 where c = C A−1 a + P B −1 b and C = A−1 + P T B −1 P .
(A.9)
91
Appendix B DERIVATIONS B.1
Derivation of Covariance of Uz
Let Xf , Hf and Wf be mutually independent random vectors in the subband energy relationship in (4.1), and let Wf be a complex Gaussian vector that is zxero mean, white, and proper. Then, oi h n ∗ Cov [Uz ] = Cov Uh · Ux + Uw + 2 Re Xf · Hf · Wf h i � � = E (Uh · Ux ) (Uh · Ux )T + E Uw UTw � o � o n n ∗ T ∗ Re Xf · Hf · Wf + 4 E Re Xf · Hf · Wf
(B.1)
h i � � + E (Uh · Ux ) UTw + E Uw (Uh · Ux )T � o � n ∗ T + 2 E (Uh · Ux ) Re Xf · Hf · Wf
(B.2)
o i n T f f f∗ (Uh · Ux ) + 2 E Re X · H · W � oT � n f f f∗ + 2 E Uw Re X · H · W
(B.4)
h n o i ∗ + 2 E Re Xf · Hf · Wf UTw
(B.6)
h
¯h ·U ¯x − U ¯w −U
� ¯h ·U ¯x T −U ¯ wU ¯T U w �T � T ¯h ·U ¯x − U ¯h ·U ¯x U ¯ , U w
(B.3)
(B.5)
�
(B.7)
h n oi ∗ where additional terms involving E Re Xf · Hf · Wf are zero because Wf is zero mean and independent of Xf and Hf . Line (B.2) cancels with (B.7). Lines (B.3) and (B.4) are zero since Wf is zero mean and uncorrelated with Xf and Hf . Since Wf is proper ∗
and Uw = Wf · Wf , lines (B.5) and (B.6) are zero by property (A.7). By expanding
92
Re {a} =
1 2
(a + a∗ ) and multiplying, line (B.1) can be rewritten as �� �� �T � f f f∗ f f f∗ E X ·H ·W X ·H ·W �� �� � � ∗ ∗ H + E Xf · Hf · Wf Xf · Hf · Wf �� �∗ � �T � f f f∗ f f f∗ + E X ·H ·W X ·H ·W �� �∗ � �H � f f f∗ f f f∗ + E X ·H ·W X ·H ·W � � � � �i H H ∗ T · Hf Hf · Wf Wf Xf Xf �i h� ∗ T � � ∗ T � � H . · Wf Wf · Hf Hf + E Xf Xf
=E
h�
(B.8) (B.9) (B.10) (B.11) (B.12) (B.13)
where properties (A.2) and (A.6) can be used to verify that lines (B.8) and (B.11) are zero. Using (A.2), lines (B.9) and (B.10) become (B.12) and (B.13), respectively. This yields h i Cov [ Uz ] = E (Uh · Ux ) (Uh · Ux )T � � ¯h ·U ¯x U ¯h ·U ¯x T − U � � ¯ wU ¯T + E Uw UTw − U w �i � � � � h� ∗ T H H · Wf Wf · Hf Hf + E Xf Xf �i h� ∗ T � � ∗ T � � H · Wf Wf · Hf Hf + E Xf Xf � � ¯ hU ¯T ·U ¯ xU ¯T = E Uh UTh · Ux UTx − U x h � � ¯ wU ¯T + E Uw UTw − U w h� � � �i H H 2 + E Xf Xf · Hf Hf · σw I h� ∗ T � � ∗ T �i 2 + E Xf Xf · Hf Hf · σw I,
(B.14) (B.15) (B.16) (B.17) (B.18) (B.19) (B.20) (B.21) (B.22)
where property (A.2) was used to rewrite (B.14) and (B.15) as (B.19). Then, use (A.5) to simplify (B.17) and (B.18) as, respectively, (B.21) and (B.22). In (B.21) and (B.22), h� �i � h i� � H 2 I = σ 2 diag E Xf · Xf ∗ ¯ x by (A.3) and by definiE Xf Xf · σw = diag U w tion of Ux (similarly for terms involving Hf ). Thus, (B.21) and (B.22) simplify to � � � 2 diag U ¯h ·U ¯ x . Applying (A.8) to E Uw UT , and recalling that U ¯ w = σ 2 1, (B.20) 2σw w w � � � 4 I. Finally, E U UT · U UT − U ¯ hU ¯ T ·U ¯ xU ¯ T = Σu + U ¯ hU ¯ T · Σux + Σu · reduces to σw x x h h x h h h h
93
¯ xU ¯ T , so that be collecting terms, we have U x � � ¯ xU ¯ T + σ 4 I + 2σ 2 diag U ¯h ·U ¯x . ¯ hU ¯ T · Σux + Σu · U Cov [Uz ] = Σuh + U x w w h h B.2
(B.23)
Derivation of Expected RBF for Dependent Uzi and Uzj
In the following, we assume that conditioning on uxi , uxj is implicit, that is p(uzi , uzj ) = p(uzi , uzj |uxi , uxj ). Model p(uzi , uzj ) = N ¯ x = ux substituting U i
¯z U i
Σuzi
ΓT
, , where Σuz is given in (B.23) by i ¯z U Γ Σ uzj j and Σux = 0, since we condition on Ux = uxi :
� 4 2 ¯ h · ux . Σuzi = Σuh · uxi uTxi + σw I + 2σw diag U i The cross-covariance term Γ is solved for in the following manner: i h ¯z U ¯T Γ = E Uzi UTzj − U zj i o� h� n ∗ = E Uh · uxi + Uw + 2 Re xfi · Hf · Wf o�T � � n f f f∗ Uh · uxj + Uw + 2 Re xj · H · W ¯z U ¯T −U zj i h � � �T i + E Uw UTw = E (Uh · uxi ) Uh · uxj � oT � o n n f f f f∗ f f∗ + 4 E Re xi · H · W Re xj · H · W
(B.24) (B.25)
h � � �T i + E (Uh · uxi ) UTw + E Uw Uh · uxj � n oT � f f f∗ + 2 E (Uh · uxi ) Re xj · H · W
(B.26)
h n o �T i ∗ + 2 E Re xfi · Hf · Wf Uh · uxj � o � n ∗ T + 2 E Uw Re xfj · Hf · Wf
(B.28)
i h n o ∗ + 2 E Re xfi · Hf · Wf UTw
(B.30)
¯ h · ux − U i
(B.31)
¯w −U
� ¯ h · ux T − U ¯ wU ¯T U w j �T � T ¯ h · ux ¯ h · ux U ¯ , U − U w j i �
(B.27)
(B.29)
(B.32)
94
h
n oi ∗ f f f where additional terms involving E Re xi · H · W are zero because Wf is zero mean and independent of Hf . Lines (B.29) and (B.30) are zero by (A.7), and lines (B.27) and (B.28) are zero since Wf is zero mean. Further, line (B.26) cancels with (B.32). Line (B.25) can be expanded using Re {a} = 12 (a + a∗ ) to be �� �� �T � f f f f∗ f f∗ E xi · H · W xj · H · W �� �� �H � f f f f∗ f f∗ + E xi · H · W xj · H · W �� �∗ � �T � f f f f∗ f f∗ + E xi · H · W xj · H · W �� �H � �∗ � f f f f∗ f f∗ xj · H · W + E xi · H · W
(B.33) (B.34) (B.35) (B.36)
�i � � � � H H ∗ T xfi xfj · Hf Hf · Wf Wf �i h� ∗ T � � ∗ T � � H . · Wf Wf · Hf Hf + E xfi xfj
=E
h�
(B.37) (B.38)
Combining (B.24), (B.25) and (B.31), and using the same logic as used to derive (B.23), we have h � � �T i ¯ h · ux T ¯ h · ux U − U Γ = E (Uh · uxi ) Uh · uxj j i � � + Cov Uw UTw �oi � � � � h n� H ∗ T H · Wf Wf · Hf Hf + 2 E Re xfi xfj � n o� 4 2 ¯ h · Re xf · xf ∗ . = Σh · uxi uTxj + σw I + 2σw diag U i j Since
p(uzi , uzj )
is
jointly
Gaussian
in
uzi
and
uzj ,
we
can
rewrite
¯ z , Σz p(uzi , uzj ) = p(uzi |uzj )p(uzj ), where p(uzj ) = N uzj ; U and p(uzi |uzj ) = j j � � ¯ z + Ω uz − U ¯ z , Ψ , where Ω = ΓT Σ−1 and Ψ = Σz − ΓT Σ−1 Γ. Since the N uzi ; U zj zj i j j i � −1 Gaussian RBF kernel is given by K(Uzi , Uzj ) = N Uzi ; Uzj , γ I , then by successive �
95
use of the product of Gaussians identity in (A.9), EUzi ,Uzj ZZ = N ZZ = N ZZ = N
� � K(Uzi , Uzj ) � uzi ; uzj , γ −1 I p(uzi , uzj ) duzi duzj � uzi ; uzj , γ −1 I p(uzj )p(uzi |uzj ) duzi duzj � � ¯ z , Σz uzi ; uzj , γ −1 I N uzj ; U j j
� � ¯ z + Ω uz − U ¯ z , Ψ duz duz N uzi ; U i j j i j Z � −1 � ¯ z + Ω uz − U ¯z ,γ I + Ψ = N uzj ; U i j j � ¯ z , Σz duz N uzj ; U j j j Z � ¯ z − ΩU ¯ z , γ −1 I + Ψ = N (I − Ω) uzj ; U i j � ¯ z , Σz duz N uzj ; U j j j ¯z ;U ¯ z − ΩU ¯z , = N (I − Ω) U j i j (I − Ω) Σzj (I − Ω)T + γ −1 I + Ψ
�
� � ¯z ;U ¯ z , (I − Ω) Σz (I − Ω)T + γ −1 I + Ψ =N U i j j T −1 Substituting in Ω = ΓT Σ−1 zj and Ψ = Σzi − Γ Σzj Γ, and cancelling terms yields
� � ¯z ;U ¯ z , Σz + Σz − Γ + ΓT + γ −1 I . N U j i j i
96
VITA Hyrum S. Anderson graduated with his Ph.D. in Electrical Engineering from the University of Washington in 2010. Previously, he was an associate staff member at MIT Lincoln Laboratory. He received his MS and BS degrees in Electrical Engineering from Brigham Young University, both in 2003, with emphases in remote sensing and signal processing. He took a two year leave of absence during his undergraduate degree to serve a voluntary two-year mission for his church, living in and around Moscow, Russia. He was raised in a large family in Meridian, Idaho.