Oct 31, 2013 - Seo, S., Bode, M., Obermayer, K.: Soft nearest prototype classification. Neural. Networks, IEEE Transactions on 14(2) (2003) 390â398.
K-Centroids-Based Supervised Classi cation of Texture Images using the SIRV modeling Aur´elien Schutz, Lionel Bombrun, Yannick Berthoumieu
To cite this version: Aur´elien Schutz, Lionel Bombrun, Yannick Berthoumieu. K-Centroids-Based Supervised Classi cation of Texture Images using the SIRV modeling. Geometric Science of Information (GSI), Aug 2013, Paris, France. pp.1-8, 2013.
HAL Id: hal-00878827 https://hal.archives-ouvertes.fr/hal-00878827 Submitted on 31 Oct 2013
HAL is a multi-disciplinary open access archive for the deposit and dissemination of scientific research documents, whether they are published or not. The documents may come from teaching and research institutions in France or abroad, or from public or private research centers.
L’archive ouverte pluridisciplinaire HAL, est destin´ee au d´epˆot et `a la diffusion de documents scientifiques de niveau recherche, publi´es ou non, ´emanant des ´etablissements d’enseignement et de recherche fran¸cais ou ´etrangers, des laboratoires publics ou priv´es.
K-Centroids-Based Supervised Classification of Texture Images using the SIRV modeling Aur´elien Schutz, Lionel Bombrun and Yannick Berthoumieu⋆ Universit´e de Bordeaux, ENSEIRB-Matmeca, Laboratoire IMS, Signal and Image Group {aurelien.schutz, lionel.bombrun, yannick.berthoumieu }@ims-bordeaux.fr
Abstract. Natural texture images can exhibit high intra-class diversity due to the acquisition conditions. To reduce its impact on classification performances, the geometry of the cluster in the feature space should be considered. We introduce the Spherically Invariant Random Vector (SIRV) representation, which is based on scale-space decomposition, for the modeling of spatial dependencies characterizing the texture image. From the specific properties of the SIRV process, i.e. the independence between the two sub-processes of the compound model, we derive a centroid estimation scheme from a pseudo-distance i.e. the Jeffrey divergence. Next, a K-centroids based (K-CB) supervised classification algorithm is introduced to handle the intra-class variability of texture images in the feature space. A comparative study on various conventional texture databases is conducted and reveals the impact of the proposed classification algorithm.
Keywords: Supervised classification, texture, Jeffrey divergence, information geometry.
1
Introduction
In research area devoted to machine vision, texture analysis is still an issue for applications ranging from classification and segmentation to indexing approaches. One of the challenging problems is the diversity in appearance of the image samples coming from the same class of natural textures. Depending on the viewing or illumination conditions under which images are acquired, the classification of texture images can become a hard task. In order to provide invariant approaches to the intra-class diversity, the geometry of the cluster in the feature space must be considered. Over the last decade, numerous works devoted to texture analysis have shown the interest to use jointly scale-space decomposition and stochastic modeling to characterize the textural content [1,2,3,4]. The more recent works propose parametric probability density function (pdf), i.e. prior such as Generalized Gaussian density (GGD) or Weibull density, to fit the empirical histogram of sub-band coefficients [1]. Some works have pointed out ⋆
Thanks TOTAL for funding.
2
the pertinence to consider multivariate modeling such as multivariate GGD [5], Spherically Invariant Random Vector (SIRV) [6], and copulas based models in order to take into account the spatial dependency [5,6] rather than simple univariate modeling. Incorporating the dependency in the model enables us to increase the performance of classification methods. In addition, these works have proposed to exploit probabilistic dissimilarity such as Kullback-Leibler divergence (KL) [7,1], geodesic distance [8,6] or Jeffrey divergence (J) [9,10]. Thereby, the parametric space with such dissimilarity defines a smooth Riemannian manifold for which well-founded processing can be derived. In this way, Choy and Tong have proposed in [1] to compute a centroid from several instances of parameter vectors from each sub-band for a given class using the GGD model and the KL divergence. Even if their proposed algorithm exploits the geometrical properties of the manifold, the main drawbacks of their proposal is that (i) classifying with only one centroid is not sufficiently robust to handle diversity and (ii) they do not exploit the spatial dependency of wavelet coefficients through multivariate models. Those two issues are the main goals of this work. The paper contribution is twofold. Firstly, the SIRV distribution is introduced for the modeling of wavelet coefficients. By considering the independence between the multiplier τ and the Gaussian vector g of the SIRV model, an algorithm is developed in Section 2 to estimate the centroid from a collection of SIRV parameters. Secondly, we introduce in Section 3 a K-centroids based (K-CB) supervised classification algorithm to handle the intra-class diversity of texture images. Some classification results are next presented in Section 4 to evaluate the performance of the proposed K-CB classification algorithm on various texture databases. Conclusions and future works are finally reported in Section 5.
2 2.1
SIRV Modeling and Centroid Evaluation Stochastic Model
To model wavelet coefficients, Spherically Invariant Random Vectors (SIRV) have been proposed in [11] overall. This class of models has been introduced to take into account the non-Gaussianity of the signal. In such a case, the observed d−dimensional vector x is decomposed as: x=
√
τ g,
(1)
where τ is a scalar random variable called multiplier (τ ∈ R+ ) and g a real Gaussian vector with zero mean and covariance matrix Σ = E{gg T }. Processes τ and g are assumed independent. In the literature [6], various models issued from the Pearson system have been introduced to represent the multiplier τ such as Gamma, Inverse Gamma and Fisher distributions. In this paper, the univariate Weibull distribution is considered to model the multiplier. Its pdf is: pw (τ ; a, b) =
n � τ �a o a � τ �a−1 exp − b b b
(2)
3
where a and b are respectively the shape and scale parameters. Since the SIRV model is uniquely defined with respect to the covariance matrix parameter up to a multiplicative constant, the multiplier τ is normalized to have an unitary −1 mean, i.e. E{τ } = 1. It yields that b = (Γ (1/a + 1)) . SIRV parameters are hence extracted according to the SIRV estimation scheme developed in [12]. Unfortunately, no closed-form expression exists for the pdf of the multivariate vector x in the case of Weibull distributed multiplier. However, characterizing texture content can be provided considering vector y = (τ, g) resulting from the SIRV representation. Using the Weibull distributed multiplier and the independence between τ and g, the joint pdf of vector y is pY (y; λ) = pw (τ ; a) pG (g; Σ) where λ = {a, Σ} is the parametric vector associated to the SIRV model. The components λ form a parametric Riemannian manifold. In the sequel of the paper, we call M the corresponding manifold. In the general framework of classification, a measure is required to estimate the dissimilarity between two images from their respective set of features. In this paper, the Jeffrey divergence (J) is considered to compute the probabilistic distance between two parametric vectors. By working on the vector y = (τ, g), the Jeffrey divergence is obtained using the ”chain rule”, since the multiplier parameter τ and the Gaussian process g are independent in the SIRV model. � � � � � � J p(y; λ), p(y; λ′ ) = J pG (g; Σ), pG (g; Σ ′ ) + J pw (τ ; a), pw (τ ; a′ ) . (3) The first term in (3) corresponds to J for the multivariate Gaussian process, while the second term corresponds to J for the stochastic model of the multiplier. 2.2
Centroid Computation N
Tr Let Λ = (λn )n=1 be a collection of NT r parametric vectors from a specific class of textured images. In [1], Choy and Tong have introduced an iterative algorithm ¯ (also called centroid) from this collection to estimate the barycentric sample λ of samples. We propose an extension of the iterative procedure using (3), the optimization problem is split into two simpler problems: one for the multivariate Gaussian part and one for the univariate Weibull part. It yields that the centroid ¯ = {¯ ¯ is composed by two centroids: λ a, Σ}
a ¯ = arg min a∈Mw
¯ = arg min Σ Σ∈MG
NT r � � 1 X J pw (τ ; a), pw (τ ; an ) , NT r n=1
NT r � � 1 X J pG (g; Σ), pG (g; Σn ) . NT r n=1
(4)
(5)
More details concerning the centroid computation can be found in [13] where an enhanced iterative procedure is presented.
3
Problem of Handling Diversity
Let I be a texture image. Let No and Ns be respectively the number of orientations and scales of a multi-scale decomposition. I is hence decomposed into
4
No × Ns sub-bands. Let us consider the parametric vector λs,o of the pdf associated to each sub-band. The collection T = {λs,o |s = 1, . . . , Ns , o = 1, . . . , No } of those parametric vectors represents the texture image I. The components λs,o NT r of the vector TI form a parametric Riemannian manifold. Let (Tc,n )n=1 be NT r training samples from the same class c. The centroid is then defined as: � ¯ s,o |s = 1, . . . , Ns , o = 1, . . . , No . T¯ = λ (6)
3.1
Capabilities and Limits of Using an Unique Centroid F
F
2
2
0
F
1
(a)
0
F
1
(b)
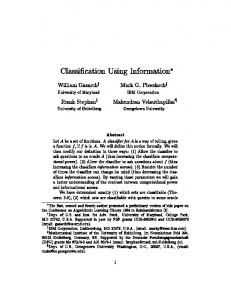
Fig. 1. Scatter plot in the projected subspace: (a) for textures with low intra-class diversity and (b) for textures with different orientations. Computed centroid is displayed by a blue square.
In this section, some experiments are conducted on real texture images to evaluate the potential and limits of the unique centroid representation. To visualize the similarity of the texture images, a dimension reduction algorithm is necessary since the manifold M is immersed in an high dimensional space. Here, we have considered an isometric feature mapping (isomap) algorithm [14] to provide tractable graphical interpretation. This algorithm can be divided into three steps. First, a pairwise dissimilarity matrix D1 is computed on the database using the Jeffrey divergence: D1 (i, j) = J(Ti , Tj ), ∀i, j ∈ [1, . . . , NT r ] . Since the Jeffrey distance does not satisfy the triangular inequality, a shortest path algorithm, for instance Dijkstra [15], is used to find the shortest distance between two texture images. Hence, isomap estimates the geodesic distances D2 (i, j) between all pairs of images on the manifold M. Next, this matrix is transformed n o D2 into a covariance-like matrix using a Gaussian kernel, i.e.: W = exp − 2·σ22 . Finally, a principal component analysis (PCA) is applied on W . The top first eigenvectors (principal component) associated to the highest eigenvalues of W allow an embedding of texture images in a low dimensional space. Fig. 1 draws a scatter plot of texture images in a subspace of dimension 2 characterized by the first two eigenvectors of W . The blue square indicates the location of the estimated centroid. As observed on Fig. 1.(a), when the scatter plot is compact, the centroid represents well the cluster. Nevertheless, when the intra-class diversity is large, an unique centroid is not able to capture this diversity. This is the case for Fig. 1.(b) where the samples are issued from the same texture class and samples could have up to five different orientations.
5
The natural diversity inside a class of texture images is due to many reasons such as differences in the scene enlightenment, in the scale considered, in the perspective, . . . This diversity modifies the shape of the scatter plot by stretching or splitting the clusters. To capture this intra-class diversity, we propose in the next section a multi-centroid approach. 3.2
K-Centroids-Based Supervised Classification (K-CB) F
F
2
3
0
0
F1
(a)
F2
(b)
Fig. 2. Embedding of texture images in a subspace of dimension 2 characterized by: (a) the first two eigenvectors and (b) the 2nd and 3rd eigenvectors of W. This allows a scatter plot representation in its three principal directions. A centroid is computed for each cluster and represented by a red square for the red cluster (resp. blue and green)
For each class c = 1, . . . , Nc , K centroids (T¯c,k )K k=1 are computed according to the K-means classifier. Practically, for a given texture class, a K-means classifier is applied. Next, the centroid is computed for each obtained cluster according to (4) and (5). Let Tt be a test sample. This sample is labeled to the class cˆ, corresponding to the class of the closest centroid, i.e. cˆ (λs,o,t ) = arg min c
(N N s X o X s=1 o=1
¯ s,o,c,k )|∀k = 1, . . . , K J(λs,o,t , λ
)
,
(7)
In the following, this supervised classification algorithm is referred by K-CB. Note that the algorithm corresponding to (4) and (5) is a particular case of K-CB when K = 1. Note also that when K is equal to the number of training samples per class, NT r , the K-CB classifier reduces to the nearest neighbor (1-NN) classifier. To evaluate the potential of a multi-centroid approach, the K-means classifier with K = 3 and J has been applied on the images of Fig. 1.(b). Three centroids are hence estimated for this texture class. They are represented by the red, blue and green squares of Fig. 2. Fig. 2.(a) and Fig. 2.(b) draws a scatterplot of texture images in a subspace of dimension 2 composed by respectively the first two eigenvectors (F1 and F2 ) and by the 2nd and 3rd eigenvectors (F2 and F3 ). As observed, the clusters are well represented by their central element: the centroid.
6
4
Results
4.1
Context
To evaluate the performance of supervised classification algorithms, the database is split into a training database and a disjoint testing database. Practically, NT r training samples are randomly selected for each texture class, the remaining sample are used as testing samples. Two databases are considered here: VisTex [16] with 40 classes and Nsa = 16 images per class (128 × 128 pixels), and Brodatz [17] with 13 classes and Nsa = 112 images per class (128 × 128 pixels). VisTex database contains some texture images with different illumination conditions, while Brodatz one exhibits a higher intra-class variability due to various viewing conditions such as rotated image. In the following, 100 Monte Carlo runs have been used to evaluate performances of the different classifiers (kappa index and error bars). The kappa index refers to the proportion of consistent classifications observed beyond that expected by chance alone [18]. Results and Discussion Average kappa index (%)
4.2
100 1−CB [1] 3−CB 1−NN
95 90 85
2/16
5/16 8/16 11/16 14/16 No. of training sample
Fig. 3. Evolution of the average kappa index as a function of the number of training samples on the VisTex database.
In this experiment, the stationary wavelet decomposition (with 2 scales) with Daubechies’ filter db4 is considered. Fig. 3 draws the evolution of the average kappa index as a function of the number of training samples on the VisTex database for the nearest neighbor (1-NN in red), the one centroid [1] (1-CB in blue) and the proposed K-CB classifier with 3 centroids (3-CB in green). A gain of more than ten points is observed when 3 centroids are considered instead of only 1 centroid per class. Hence, the proposed 3-CB classifier allows a better characterization of the intra-class diversity. We also note that the performance of the 3-CB classifier are close to those of the 1-NN. However, the computation complexity is significantly lower with the K-CB classifier1 , since only K computations of the similarity measure between the query and centroids are necessary while NT r are required for the 1-NN classifier. Since computational considerations play a key role for practical application, the 1-NN classifier may be intractable for large database. As a consequence, the K-CB classifier is a good trade-off between classification accuracy and computation complexity. 1
The computation of the centroids being done off-line for the K-CB classifier.
7 Spatial Database K neighborhood
1-NN NT r = K
1-CB [1] K-CB 1-NN NT r = NSa /2 NT r = NSa /2 NT r = NSa /2
3×3
VisTex 3 83.7 % ±2.0 90.4 % ±1.3 96.8 % ±1.2 97.5 % ±0.8 Brodatz 10 50.6 % ±2.6 79.9 % ±1.5 96.2 % ±1.2 98.2 % ±0.5
1×1
VisTex 3 78.7 % ±2.3 72.7 % ±2.0 88.9 % ±1.7 94.1 % ±1.1 Brodatz 10 65.8 % ±2.7 70 % ±1 97 % ±2 99 % ±1
Table 1. Average kappa index for the different supervised classifiers on the VisTex and Brodatz databases.
Table 1 displays the average kappa index for the different classifiers (1-NN, 1-CB and K-CB) on the VisTex and Brodatz databases (K equals respectively 3 and 10 for the two databases). Note that two 1-NN classifiers have been considered, one with K training samples per class (the same complexity as the K-CB) and one where half of the database is used for training. In this experiment, the steerable pyramid with 2 scales and 8 orientations has been used for the decomposition. Lines 3–4 show performance of SIRV on spatial neighborhood 3 × 3 where lines 5–6 show performance of univariate Generalized Gaussian distribution [1]. As observed in Table 1, for the same computational complexity, the proposed K-CB classification exhibits a gain of minimum 10 points compared to the nearest neighbor classifier (1-NN) with NT r = K. Hence, an adapted selection of centroids with the K-means allows an increase of the kappa index. We also note that the performance of the K-CB are very close to the 1-NN classifier with the same number of training data. High performance of K-NN are less increased than performance of K-CB with the multivariate assumption. In addition, the proposed K-CB classifier based on a parametric point of view outperforms a texton-based approach such as the one proposed by Varma and Zisserman in [2] which has a Kappa index of about 82% on the VisTex database with 20 centroids.
5
Conclusion
This paper has addressed the problem of centroid-based (CB) classification in the multivariate case. We have firstly introduced the Spherically Invariant Random Vector (SIRV) distribution for the modeling of wavelet coefficients, and secondly introduced a K-centroids-based (K-CB) supervised classification to handle the natural intra-class diversity of texture images. Classification results on texture databases have shown that the proposed K-CB classifier allows to obtain a gain of 1.5K points in classification accuracy for a gain of K points in computation complexity against the 1-CB classifier. Further works will concern the development of a supervised classification algorithm with an adapted and automatic number of centroids per texture class (which will depend on the intra-class diversity) similar to Learning Vector Quantization approach[19].
8
References 1. Choy, S.K., Tong, C.S.: Supervised texture classification using characteristic generalized Gaussian density. Journal of Mathematical Imaging and Vision 29 (Aug. 2007) 35–47 2. Varma, M., Zisserman, A.: A statistical approach to texture classification from single images. International Journal of Computer Vision 62 (2005) 61–81 3. Rabin, J., Peyr´e, G., Delon, J., Bernot, M.: Wasserstein barycenter and its application to texture mixing. In: Proceedings of the Third International Conference on Scale Space and Variational Methods in Computer Vision. Volume 8. (2011) 4. Schwander, O., Schutz, A., Nielsen, F., Berthoumieu, Y.: k-MLE for mixtures of generalized gaussians. In: Pattern Recognition (ICPR), 2012 21st International Conference on, IEEE (2012) 2825–2828 5. Verdoolaege, G., Rosseel, Y., Lambrechts, M., Scheunders, P.: Wavelet-based colour texture retrieval using the Kullback-Leibler divergence between bivariate generalized Gaussian models. In: Image Processing, IEEE International Conference on. (Nov. 2009) 265–268 6. Bombrun, L., Lasmar, N.E., Berthoumieu, Y., Verdoolaege, G.: Multivariate texture retrieval using the SIRV representation and the geodesic distance. In: Acoustics, Speech and Signal Processing, IEEE International Conference on. (2011) 865– 868 7. Barbaresco, F.: Applications of information geometry to radar signal processing. In: Emerging Trends in Visual Computing (ETVC08). (Nov. 18-20 2008) 8. Amari, S., Nagaoka, H.: Methods of information geometry. Amer Mathematical Society (2007) 9. Nielsen, F., Nock, R.: Sided and symmetrized bregman centroids. IEEE Transactions on Information Theory 55(6) (June 2009) 2048–2059 10. Schutz, A., Berthoumieu, Y., Turcu, F., Nafornita, C., Isar, A.: Barycentric distribution estimation for texture clustering based on information-geometry tools. In: Electronics and Telecommunications, International Symposium on. (Nov. 2012) 11. Lasmar, N.E., Berthoumieu, Y.: Multivariate statistical modeling for texture analysis using wavelet transforms. In: Acoustics Speech and Signal Processing, IEEE International Conference on. (Mar. 2010) 790–793 12. Gini, F., Greco, M.: Covariance matrix estimation for CFAR detection in correlated heavy tailed clutter. Signal Processing 82(12) (2002) 1847–1859 13. Schutz, A., Bombrun, L., Berthoumieu, Y.: Centroid-based texture classification using the sirv representation. In: Image Processing (ICIP), International Conference on. (Sep. 2013) 14. Tenenbaum, J.B., Silva, V.D., Langford, J.C.: A global geometric framework for nonlinear dimensionality reduction. Science 290(5500) (2000) 2319–2323 15. Dijkstra, E.W.: A note on two problems in connexion with graphs. Numerishe Mathematik 1 (1959) 269–271 16. Picard, R., Graczyk, C., Mann, S., Wachman, J., Picard, L., Campbell, L., Negroponte, N.: Vision texture database. the Media Laboratory, MIT, Cambridge, Massachusetts (1995) 17. Brodatz, P.: Textures: A Photographic Album for Artists and Designers. Dover, New York (1966) 18. Gomez, D., Montero, J.: Determining the accuracy in image supervised classification problems. EUSFLAT 1(1) (Jul. 2011) 342–349 19. Seo, S., Bode, M., Obermayer, K.: Soft nearest prototype classification. Neural Networks, IEEE Transactions on 14(2) (2003) 390–398