either the tibiofemoral or patelofemoral, according to the location of damaged cartilage. Diagnosis of Knee OA is done since the first clinical examination. Pain ...
Knee cartilage segmentation using active shape models and contrast enhancement from magnetic resonance images Germán Gonzáleza and Boris Escalante-Ramírezb a Posgrado en Ingeniería Eléctrica, Universidad Nacional Autónoma de México, Mexico City, Mexico. b Departamento de Procesamiento de Señales, Facultad de Ingeniería, Universidad Nacional Autónoma de México, Mexico City, Mexico. ABSTRACT In this paper, we take advantage from contrast characteristics of our magnetic resonance images improving the performance of Active Shape Models (ASM) applied on knee cartilage segmentation. We perform an image fusionbased contrast enhancement method using time series MRI T2. Then, we apply ASM algorithm and we compare results with ASM without contrast enhancement. The results show that the ASM with contrast enhancement performs better and is consistent. We validate these results using Dice coefficient and Hausdorff distance. Keywords: Segmentation, Active Shape Models, Contrast Enhancement, Gaussian and Laplacian Pyramids, Image Fusion.
1. INTRODUCTION Knee Osteoarthritis (OA) [1] is a disease caused by biomechanical stress that affects the articular cartilage and bones of the knee. This condition causes pain and malfunction. OA may be present in any of the medial femoral compartments, either the tibiofemoral or patelofemoral, according to the location of damaged cartilage. Diagnosis of Knee OA is done since the first clinical examination. Pain, morning stiffness and knee swelling in a patient older than 50 years are considered as consequences of OA. However, image analysis of the knee also has an important role since it can confirm the OA diagnosis, determines compartments involved and evaluates the disease stage. Moreover, it can confirm the responsibility of OA in the symptoms and provides information about disease evolution during treatment. Magnetic Resonance Imaging (MRI) [2] provides a non-invasive assessment for evaluating the presence and progression of the Knee OA [3]. Magnetic resonance can show the soft tissue structures and their boundaries with the bones, without significant distortion. Furthermore, MRI does not change the tissue’s dimension and there is not superposition between anatomical structures and, more important, it directly visualizes the knee cartilage and its defects [4]. Automatic or semiautomatic knee segmentation has been studied for more than 20 years and many approaches have been reported, for example: growing regions [5-7], Bezier splines [8], active contours [9, 10], Bayesian classifiers [11] and active shape models (ASM) [12, 13]. ASM [14] compute an average shape of the object to segment from a training set and a statistical model of minimal parameters that allow the shape to adjust to different objects within a certain range. ASM have been widely used in medical image analysis because there is sufficient knowledge about the shape of targeted anatomical objects obtained through diverse medical imaging modalities. The purpose of our work is to take advantage of the contrast characteristics of Resonance Magnetic Images (volume acquisitions in time series) in order to enhance the contrast in the images and therefore, improve the ASM segmentation performance in knee cartilage. We test the contrast enhancement method on real data; this is new because, in the original paper [15], only synthetic images are presented.
2. METHODS AND MATERIALS In this section, the main characteristics of MRI, segmentation and contrast enhancement algorithms are described. Validation metrics of segmentation and contrast enhancement are also discussed.
IX International Seminar on Medical Information Processing and Analysis, edited by Jorge Brieva, Boris Escalante-Ramírez, Proc. of SPIE Vol. 8922, 892213 · © 2013 SPIE · CCC code: 0277-786X/13/$18 · doi: 10.1117/12.2035529 Proc. of SPIE Vol. 8922 892213-1
2.1 Medical Images The images were selected from 16 different volume sets on a 3T MRI system (Siemens Verio). In each set, there are 11 knee volumes and, in each volume, there are 10 images. The images are in T2* in an echo-time series (Multiecho system). Every 7.54 [ms] a new knee volume is acquired by the sequence is called Carr-Purcell-Meiboom-Gill [20]. An important characteristic of this sequence is the gradual contrast decrease along the volume acquisition time (Figure 1). The images were acquired with a 384 x 384 matrix (0.414-mm in-plane resolution and 3.6-mm slice thickness). 2.2 Active Shape Models The original algorithm of Active Shape Models (ASM) consists of a statistical shape model derived from a Point Distribution Model (PDM) obtained through a set of landmarks on the shape contours. The PDM is used for modeling the shape of an object and its variations. First, the shapes are aligned using Procrustes Analysis (PA), PA is performed by optimally translating, rotating and uniformly scaling the objects. In other words, both the space location and the size of the objects are freely adjusted. The aim is to obtain a similar location and size, by minimizing a shape difference measure called Procrustes distance between two shapes. The PDM is built applying Principal Component Analysis (PCA) to the aligned set (by PA) of shapes represented by landmarks. The original shapes and their representation model ( = 1, … , ), is the number of variation modes (described below), are related by the mean shape and the eigenvectors :
(
=
− ),
=
+
(1)
We can reduce the representation dimensionality using only the eigenvectors of the major eigenvalues. In this case, equation (1) turns into an approximation, with an error depending on the magnitude of the excluded eigenvalues. is limited to guarantee only Therefore, assuming the data is Gaussian distributed, each component of the vectors plausible shapes are represented: |
| ≤
, 1 ≤ ≤
, 1 ≤
≤
,
(2)
where is regularization constant, usually between 1 and 3 (it depends on desired flexibility of model), are the eigenvalues of the covariance matrix. of used eigenvectors and
is the number
The appearance model is built from a set of Gray Local Profiles (GLP) in the normal direction to the contour at each landmark. The GLPs are built from normalized first order derivatives and describe the local intensity variations at each landmark positions. The profile equation is:
where the profile is
=
…
(
)
and
=
∑
|
|
, (3)
is the size of the profile.
The next step is to fit the model on interest region. An instance of the model is given by the adaptation of shape respect to reference shape :
= ( ,
where ( , ) is a rotation matrix with angle θ and scale , model parameters:
)
+ ,
is the translation and
Proc. of SPIE Vol. 8922 892213-2
is the combination of
with (5) and the
=
+
(6)
Combining last equation with (5), the adaptation results in the next equation:
)
( ,
=
+
+
(7)
The position parameters are given by , and the model parameters are represented by . The position parameters represent pose modifications and model parameters represent shape modifications. The adaptation pretends mapping the model to + . The position parameters are adjusted and model parameters are modified from the deformed version of the shape. The term can be written as: ,
=(
Where
=( +
,
,
) and
=
Where the terms 1 +
,
+
=
(8)
.
The influence of the position parameters on the shape
is:
= ( (1 +
)
),
+
)
+
+
(9)
+
are obtained minimizing the equation:
−
,
−
−
,
−
,
(10)
where is the identity matrix aimed at giving the same weight at each point. The influence of model parameters only in the equation (9), hence → + . modifies The distance is
is: =
=
From the last equation, the new value of parameters are updated:
(1 +
→ +
)
,−
−
( , )
+
−
−
(11)
is verified in equation (2). And, if the condition is valid, the next +
→
+
→
+
→
(1 +
)→
+
→
(12)
The process is repeated by n iterations, either predefined or controlled by a stop criterion. 2.3 Image Fusion-based Contrast Enhancement We enhance contrast using a method that exploits the image characteristics, i.e.: contrast and luminance in time series. The method is called Image fusion-based Contrast Enhancement [15], this method takes advantage of these two characteristics and, in a multiresolution scheme, fuses both image characteristics getting the contrast enhancement. The algorithm can be summarized in the next steps:
Proc. of SPIE Vol. 8922 892213-3
Step 1: Calculate the image quality measures for each of the input images: Contrast:
, ,
= |∇ | = ( ( , ) − ( + 1, )) + ( ( , ) − ( , + 1)) ,
given an input image ( , ) where x and
(13)
are the row and column coordinates, respectively.
Luminance: , , = ( ( , );
, )=
−
( ( , )
)
,
where σ proposed by authors is 0.2 (giving more weight to pixels which value is closer to the mean) and intensity of the original image.
(14) is the mean
Step 2: For each image obtain the scalar weight map (15) and the normalized scalar weight map using (16).
, ,
, ,
=
, ,
= ∑
, ,
(15)
, ,
(16)
where = 1, 2, … , and is the number of input images. The weight of contrast and luminance of the metric uses a power function, where and are the corresponding weighting exponents ( , > 0), that increase or decrease the influence of quality measures. Step 3: Decompose the input images using a Laplacian pyramid. Step 4: Obtain the fused pyramid as a weighted average of the original Laplacian decompositions for each level , with the -th level of Gaussian pyramid of the weight map (16) serving as the weights. The fused pyramid is: { } , = ∑
{ },
,
{ },
,
(17)
Step 5: Reconstruct the image from the fused Laplacian pyramid. 2.4 Validation Validation (quantitative evaluation) aims at measuring the algorithm performance. In our particular case, we wish to measure the accuracy of the segmentation algorithm and the fusion-based contrast enhancement performance. An output image has been enhanced over the input image if it enables a better perception of image details. A contrast enhancement is a difficult task because contrast quantification is hard. Thus, it is necessary to establish measures for defining good enhancement. We use Absolute Mean Brightness Error (AMBE) [16], Discrete Entropy (DE) [17], and Edge-Based Contrast Measure (EBCM) [18] as quantitative contrast measures, and Dice Coefficient and Hausdorff Distance for evaluating segmentation. 2.4.1
Dice Coefficient
The DICE coefficient is a similarity measurement between sets. In this case, it is used as a global measure of the existing differences between the calculated shape and the reference shape. The coefficient is given by:
=
( ∩ ) | | | |
,
Proc. of SPIE Vol. 8922 892213-4
(18)
where is the area inside calculated shape and is the area inside reference shape. DICE coefficient values are between 0 and 1; the closer the coefficient to 1, the more similar the shapes are. 2.4.2
Hausdorff Distance
The Hausdorff distance determines the similarity between two shapes [19]. The Hausdorff distance is defined as the maximum distance from a point set to the nearest point of other set points. If = { , … , } and = { , … , } are two point sets, the Hausdorff distance between and is: ( , ) = max (ℎ( , ), ℎ( , )) ,
(19)
where ℎ( , ) =
∈
∈
‖ − ‖
Equation (20) is properly called the direct Hausdorff distance from the set the point sets and , and ℎ( , ) =
∈
∈
(20) to set , using the underlying norm ‖∙‖ on
‖ − ‖
(21)
is called inverse Hausdorff distance. The Hausdorff distance is not symmetric. Then, equation (19) considers both cases giving a more general definition. 2.4.3
Absolute Mean Brightness Error
AMBE is the absolute difference between the Mean Brightness (MB) values of an input image for example: ( , ) = |
( ) and Where preserved. 2.4.4
( ) are the MB values of
( )−
and an output image,
( )|.
(22)
and Y, respectively. The lower AMBE value, the better brightness is
Discrete Entropy
The DE of an image measures its content, where a higher value indicates an image with richer details. The DE is defined as:
( ) log
( ) = ∑∀
( )
(23)
Where ( ) is the probability of the pixel intensity, and it is calculated from the normalized histogram. 2.4.5
Edge-Based Contrast Measure
The EBCM is based on the human perception mechanism; it is very sensitive to contours (or edges). The gray level in the object edges is calculated by computing the mean value of the pixel gray levels weighted by their edge values. The contrast ( , ) for a pixel of image located at ( , ) is thus defined as: | (, )
( , )|
(, )
( , )|
( , ) = |
.
(24)
Where the mean edge gray level is: ( , ) = ∑(
, )∈
(, )
( , ) ( , )⁄∑(
, )∈
(, )
( , )
(25)
( , ) is the set of all neighboring pixels of pixel ( , ), and ( , ) is the edge value at pixel ( , ). The magnitude of the image gradient is calculated using the Laplacian operator. The EBCM for image is thus computed as the average contrast value, for example:
Proc. of SPIE Vol. 8922 892213-5
Where when
( ) = ∑
∑
( , )⁄
is the total number of pixels. Then, for an output image ( )≥ ( ).
of an input image
(26)
, the contrast is improved
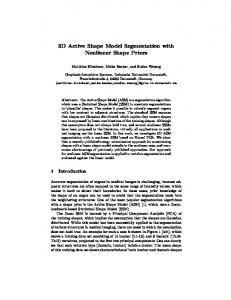
3. RESULTS This section shows the results of contrast enhancement and the goal is to find the best fusion option on images. Results validation is based on contrast measures described on previous section. Later, taking the images with the best contrast, we test segmentation algorithm on femur cartilage. Medical images are in DICOM format. 3.1 Contrast enhancement results As mentioned above, we have 11 images of the same slice in each of the 16 selected sets. We selected the slice of the fourth volume because it presents the best contrast between bone and cartilage perceptually and, with this image, we compare the contrast enhancement results. In Figure 1, slices from different volumes are showed and it is noticeable the contrast characteristics we want to use.
e l
(a) (b) (c) Figure 1(a) First-volume slice (bright). Figure 1(b) Fourth-volume slice (good contrast). Figure 1(c) Sixth-volume slice (dark).
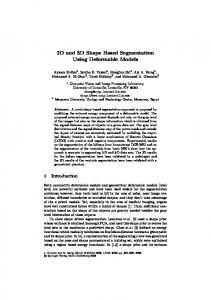
The contrast enhancement algorithm is based on image fusion, and then we fuse the fourth volume slice with the rest of corresponding volumes slices (brighter and darker slices). But, in the results graphs, we only show fusion results with slices of the fifth, sixth, seventh, eighth and ninth volumes because they are more representative. Fused images are evaluated by the following measures: AMBE, DE, EBCM and results are shown in Figure 2. Table 1 shows average results of each fusion. 3.2 Segmentation results We chose fusing fourth and sixth volume slices (justified on Discussion section). Then, we compare the results with ASM segmentation on slices of the fourth volume (Original) and the fused images. Since the ASM require prior training, we used the “leave-one-out” method to maximize data usage. The Dice coefficient and Hausdorff distance are the metrics used for validating segmentation results (Table 2). Moreover, the best and the worst segmentation result obtained on the enhancement contrast images are shown in Figure 3, Image 10 and Image 1 respectively. The average of Dice coefficients calculated on the original image is (SD) 0.7586 ± 0.1169 and, on the fusion image is 0.8155 ± 0.052, and the average of Hausdorff distance calculated on in the original image is 3.3803± 1.2336 and, on the fusion images is 2.9158 ± 0.6735. Each segmentation is achieved in 20 seconds approximately.
Proc. of SPIE Vol. 8922 892213-6
Discret Entropy
AMBE 8 4-5 Fusion 4-6 Fusion 4-7 Fusion 4-8 Fusion 4-9 Fusion
2000
1500
Original 4-5 Fusion 4-6 Fusion 4-7 Fusion 4-8 Fusion 4-9 Fusion
7.5
7
1000
6.5
6
500
5.5 0
2
4
6
8 Figures
10
12
14
5
16
2
4
6
(a)
8 Figures
10
12
14
16
(b) EBCM Original 4-5 Fusion 4-6 Fusion 4-7 Fusion 4-8 Fusion 4-9 Fusion
0.4
0.35
0.3
0.25
0.2
0.15
2
4
6
8 Figures
10
12
14
16
(c) Figure 2(a) AMBE Results. Figure 2(b) DE Results. Figure 2(c) EBCM Results. Results on the original image are shown in blue and the best fusion (4-6 fusion) results are in red.
Table 1. Average results of AMBE, DE and EBCM for each fusion
Image Original 4-5 Fusion 4-6 Fusion 4-7 Fusion 4-8 Fusion 4-9 Fusion
AMBE avg. 600.4813 689.0589 731.8271 764.6651 785.4851
DE avg. 6.2427 6.0476 6.0174 5.0883 5.9662 5.9491
Proc. of SPIE Vol. 8922 892213-7
EBCM avg. 0.1956 0.2347 0.2626 0.2776 0.2851 0.2899
Table 2. For each image, Dice coefficients of ASM with original image and ASM with fusioned image and Hausdorff distances of ASM with original image and ASM with fusioned image.
Image Image 1 Image 2 Image 3 Image 4 Image 5 Image 6 Image 7 Image 8 Image 9 Image 10 Image 11 Image 12 Image 13 Image 14 Image 15 Image 16
Dice_Original 0.6760 0.7345 0.8063 0.7623 0.8220 0.7442 0.4994 0.7643 0.4848 0.8621 0.8245 0.7750 0.8748 0.8407 0.8006 0.8671
Dice_Fusion 0.7077 0.7814 0.8207 0.7797 0.8908 0.8468 0.7778 0.7639 0.8452 0.8983 0.8241 0.8256 0.7915 0.7724 0.8367 0.8863
Haus_Original 2.4755 3.5323 2.7598 3.1228 3.1798 2.2151 4.9496 2.9259 6.7318 3.1684 2.9469 5.2034 2.0863 3.4308 2.7630 2.5940
(a)
Haus_Fus 2.9222 3.3891 2.0835 2.9954 2.6852 1.6756 2.5941 2.7121 3.0975 2.9625 2.8717 5.2466 2.2911 3.5774 2.9529 2.5955
(b)
Figure 3(a) the best segmentation result is on Image 10 and Figure 3(b) the worst segmentation result is on Image 1
4. DISCUSSION Based on the segmentation results, we note that contrast enhancement improves, in most cases, the segmentation results of knee cartilage. Furthermore, we proved ASM segmentation performs better with contrast enhancement images, since it depends mainly on gray levels and their distribution profiles. The average results of Dice coefficient and Hausdorff distance are improved with the contrast enhancement and their variance also decreases in comparison with segmentation on original images. However, in some patients with advanced Knee OA and, who have no cartilage left, is not substantial since there is little to segment. This is a serious problem for the ASM algorithm because there are not gray level variations, so the algorithm. Fortunately, ASM always provides plausible shapes and landmarks are correlated between themselves. Therefore, the failures are not so serious but. From a purely perceptual opinion, we chose the 4-6 fusion. However, using the results of AMBE, DE and ECBM, we conclude the following: The average ECBM of fused image is greater than the average ECBM of the original images and, although subsequent fusions shown better ECBM, the difference between 4-5 fusion and 4-6 fusion is high and the difference between 4-6 fusion and 4-7 fusion has a significant decay. Furthermore, the greater is the number of the
Proc. of SPIE Vol. 8922 892213-8
fusion image, the worse are the AMBE and Entropy results. If AMBE increases and Entropy decreases means quality image is affected. In the particular case of entropy, if it decreases, the image loses details and sharpness decays. For these reasons, we chose 4-6 fused images, because they have equilibrium on AMBE, DE and ECBM metrics. The contrast enhancement technique fits perfectly with the characteristics of our images.
5. CONCLUSION AND FUTURE WORK In this paper, we have used known methods: ASM and Fusion-based Contrast Enhancement, but they had not been tested together before. The contrast enhancement method presents good results in [15] but, this work did not evaluate its test results on a real application or on real data. Our images are very well suited to test the proposed contrast enhancement method: they belong to the same data set but each one has a different contrast. This characteristic totally depends on the pulse sequence used during image acquisition. Commonly, knee cartilage is acquired in different sequences, mainly T1, but, using the former sequence, we pretend to find something additional to just the cartilage size or thickness. Additionally, we also carried out a relaxometry study. Relaxometry characterizes a tissue depending on the relaxation time T2, by fitting an exponential curve. This time is very important for diagnosis OA because an elevated T2 time suggests biomechanical changes on cartilage (deterioration) suggesting that the patient is likely to develop this disease [21]. The segmentation results show that contrast enhancement improves segmentation performance, proving our hypothesis. A better contrast implies a gradient increment, thus a better region differentiation. The knee cartilage segmentation is necessary because we want to estimate T2 time over this specific zone. Our results are good and useful, however, there are a lot of methods that improve ASM performance, and some of them use descriptors and transforms. We could compare results in order to select the best in a future work.
ACKNOWLEDGEMENTS We would like to thank Ph.D. Marcelo F. Lugo-Licona for his helpful comments and the departments of Magnetic Resonance and Radiotherapy of the Hospital Ángeles de las Lomas for providing MR Images. The authors greatly acknowledge the support by research grants from UNAM PAPIIT IN113611 and CONACYT-325545.
REFERENCES [1] Bonnin, P. and Chambat, P., [Osteoarthritis of the knee], Springer-Verlag, France, (2008). [2] Suetens, P., [Fundamentals of Medical Imaging], Cambridge University Press, New York, (2009). [3] Burstein, D., “MRI for development of disease‐modifying osteoarthritis drugs”. NMR in Biomedicine 19(6), 669680 (2006). [4] Guermazi, A., Burstein, D., Conaghan, P., Eckstein, F., Hellio Le Graverand-Gastineau, M. P., Keen, H. and Roemer, F. W., “Imaging in osteoarthritis”. Rheumatic Disease Clinics of North America 34(3), 645-687 (2008). [5] Eckstein, F., Cicuttini, F., Raynauld, J. P., Waterton, J. C. and Peterfy, C., “Magnetic resonance imaging (MRI) of articular cartilage in knee osteoarthritis (OA): morphological assessment”. Osteoarthritis and cartilage 14, 46-75 (2006). [6] Lynch, J. A., Zaim, S., Zhao, J., Stork, A., Peterfy, C. G. and Genant, H. K., “Cartilage segmentation of 3-D MRI scans of the osteoarthritic knee combining user knowledge and active contours,” Proc. SPIE, pp. 925–935 (2000). [7] Lynch, J. A., Zaim, S., Zhao, J., Stork, A., Peterfy, C. G. and Genant, H. K., “Automating measurement of subtle changes in articular cartilage from MRI of the knee by combining 3-D image registration and segmentation,” Proc. SPIE, pp. 431–439 (2001). [8] Carballido-Gamio, J., Bauer, J. S., Stahl, R., Lee, K. Y., Krause, S., Link, T. M. and Majumdar, S. “Inter-subject comparison of MRI knee cartilage thickness,” Medical image analysis 12(2), 120-135 (2008). [9] Raynauld, J. P., Kauffmann, C., Beaudoin, G., Berthiaume, M. J., de Guise, J. A., Bloch, D. A. and MartelPelletier, J., “Reliability of a quantification imaging system using magnetic resonance images to measure cartilage thickness and volume in human normal and osteoarthritic knees,” Osteoarthritis and cartilage 11(5), 351-360 (2003).
Proc. of SPIE Vol. 8922 892213-9
[10] König, L., Groher, M., Keil, A., Glaser, C., Reiser, M. and Navab, N., “Semi-automatic segmentation of the patellar cartilage in MRI,” Bildverarbeitung für die Medizin, 404-408 (2007). [11] Kapur, T., Beardsley, P., Gibson, S., Grimson, W. and Wells, W., “Model-based segmentation of clinical knee MRI,” Proc. IEEE Int’l Workshop on Model-Based 3D Image Analysis, 97-106 (1998). [12] Solloway, S., Taylor, C. J., Hutchinson, C. E., and Waterton, J. C., “Quantification of articular cartilage from MR images using active shape models,” Computer Vision—ECCV'96, 400-411 (1996). [13] Solloway, S., Hutchinson, C. E., Waterton, J. C. and Taylor, C. J., “The use of active shape models for making thickness measurements of articular cartilage from MR images,” Magnetic Resonance in Medicine 37(6), 943-952 (1997). [14] Cootes, T. F., Taylor, C. J., Cooper, D. H. and Graham, J., “Active shape models-their training and application,” Computer vision and image understanding 61(1), 38-59 (1995). [15] Saleem, A., Beghdadi, A. and Boashash, B., “Image fusion-based contrast enhancement,” EURASIP Journal on Image and Video Processing 2012(1), 1-17 (2012). [16] Chen, S. D. and Ramli, A. R., “Minimum mean brightness error bi-histogram equalization in contrast enhancement,” IEEE Transactions 49(4), 1310-1319 (2003). [17] Shannon, C. E., “A mathematical theory of communication,” ACM SIGMOBILE Mobile Computing and Communications Review 5(1), 3-55 (2003). [18] Beghdadi, A. and Le Negrate, A., “Contrast enhancement technique based on local detection of edges,” Computer Vision, Graphics, and Image Processing 46(2), 162-174 (1989). [19] Huttenlocher, D. P., Klanderman, G. A. and Rucklidge, W. J., “Comparing images using the Hausdorff distance,” IEEE Transactions 15(9), 850-863 (1993). [20] Meiboom, S., and D. Gill. "Modified spin‐echo method for measuring nuclear relaxation times," Review of scientific instruments 29(8), 688-691 (1958). [21] Baum, T., et al. "Association of magnetic resonance imaging–based knee cartilage T2 measurements and focal knee lesions with knee pain: Data from the Osteoarthritis Initiative." Arthritis Care & Research 64(2), 248-255 (2012).
Proc. of SPIE Vol. 8922 892213-10