Vol. 2, No. 4
Modern Applied Science
Knowledge Extraction from Trained Neural Network Scour Models H. Md. Azamathulla (corresponding author) River Engineering and Urban Drainage Research Centre (REDAC) Universiti Sains Malaysia, Engineering Campus 14300 Nibong Tebal Pulau Pinang, Malaysia E-mail:
[email protected],
[email protected] Aminuddin Ab Ghani REDAC, Universiti Sains Malaysia E-mail:
[email protected] Nor Azazi Zakaria REDAC, Universiti Sains Malaysia E-mail:
[email protected] Chang Chun Kiat REDAC, Universiti Sains Malaysia E-mail:
[email protected] Leow Cheng Siang REDAC, Universiti Sains Malaysia E-mail:
[email protected] The research is financed by Universiti Sains Malaysia for funding a short term grant 304.PREDAC.6035262 (Sponsoring information) Abstract This study extends the earlier contribution of Azamathulla et al. in 2005. Artificial neural networks (ANNs), due to their excellent capabilities for modeling complex processes, have been successfully applied to a variety of problems in hydraulics. However, one of the major criticisms of ANNs is that they are just black-box models, since a satisfactory explanation of their behavior has not been offered. They, in particular, do not explain easily how the inputs are related to the output, and also whether the selected inputs have any significant relationship with an output. In this paper, a perturbation analysis for determining the order of influence of the elements in the input vector on the output vector is discussed. The approach is illustrated though networks recommended in Azamathulla et al. 2005 for prediction of scour using neural networks. The analyses of the results suggest that each variable in the input vector (discharge intensity, head, tail water depth, bed material, lip angle and radius of the bucket) influences the depth of scour in different ways. However, the magnitude of the influence cannot be clearly quantified by this approach. Further it adds that the selection of input vector based on linear measures between the variables of interest, which is commonly employed, may still include certain spurious elements that only increase the complexity of the model. Keywords: Neural Networks, Scour, Spillways 1. Introduction Artificial neural networks (ANN) technique has been successfully applied across a broad spectrum of problem domains such as pattern recognition and function approximation. Most ANN applications in engineering mainly fall in the 52
Modern Applied Science
July, 2008
category of prediction, in which an unknown relationship exists between a set of input factors and an output (Jingsheng, 2002). The objective of these studies is to find a formula between the selected input variables and the output based on a representative set of historic examples. The formula is then extended to predict the outcome of any given input. The computational efficiency of ANNs has yielded many promising results in the field of hydraulics and water resources. This interest has been motivated by the complex nature of scour mechanism and the ability of ANNs to model nonlinear relationships (Azamathulla et al. 2005). However, ANNs remain something of a numerical enigma. In particular, they offer end user little or no insight into either the process by which they arrived at a result or, in general, the totality of knowledge actually embedded therein (Tickle et al. 1998). The ANNs possess several significant attributes such as universal function approximation property, robustness, and ability to learn. However, ANNs are also criticized due to their perceived weakness of being black-box models. This is a significant weakness, for without the ability to produce comprehensible decisions it is hard to trust the reliability of networks addressing real-world problems (Benitez et al. 1997). Therefore, a significant research effort is needed to address this deficiency of ANNs. Some solutions have been proposed to represent the operation of a trained neural network, which deals with classification problems, in terms of symbolic rules (Lozowski et al. 1996; Benitez et al. 1997; Tickle et al. 1998; and Castro et al. 2002). However, most of the hydrologic applications of ANNs fall in the category of function approximation, and knowledge extraction from such models is still a virgin research area. For instance, Lange (1999) states that ANNs are black-box models that only develop the relation between input and output variables without the modeling of any physical processes. However, it must be realized that the data that are employed in developing black-box models contain important information about the physical processes being modeled, and this information gets embedded or captured inside the model. This paper discusses the use of a method similar to perturbation analysis (Ho, 1992) to extract the knowledge embedded in trained ANN models for prediction of scour pattern. 2. Perturbation Analysis Neural networks (NN) are capable of modeling complex processes, and have been successfully applied to a variety of problems in hydraulic engineering. However, one criticism in this regard is that they are black-box models and do not offer, a satisfactory explanation of their performance. ANN models neither explain how the inputs are related to the output, nor whether the selected inputs have any significant relationship with an output (Sudheer, 2005). In this study, a perturbation analysis for determining the order of influence of the elements in the input vector on the output vector is therefore discussed. Most NN applications in engineering mainly belong to variable prediction, in which an unknown relationship is assured to exist between a set of input factors and an output (Jingsheng, 2002). The objective of these studies is to find a formula between the selected input variables and the output based on a representative set of historic examples. The formula is then extended to predict the outcome of any given input. However, it must be realized that the data that are employed in developing black-box models contains important information about the physical process being modeled, and this information gets embedded or captured inside the model. This study discusses the use of a method that is similar to perturbation analysis (Ho, 1992) to extract the knowledge embedded in trained NN models for prediction of scour pattern. The main aim of the study was to identify the strength of relationship between individual input variables and the output. The study also aimed at assessing the degree of influence of the individual input variables on the output function. The methodology is illustrated through a FFBP Model-1 for prediction of scour pattern downstream of flip bucket spillway (Azamathulla et al. 2005). 3. Methodology In NN modeling, the combination of all of the variables (input and output) locates a point in a multidimensional input-output space called phase space (Stewart, 1989). The main idea in the method is that a great deal of information is contained in the sample paths in the phase space of the dynamic system. This is much beyond the usual statistics collected such as the means and variances of various output variables. Rather than looking at the simulation simply as a black box with input parameters and final output results, one can utilize the knowledge on the dynamics of the functional domain and get additional information, such as performance and sensitivity of the model. This can be achieved by studying the effects of small disturbances (perturbation) in the mathematical model of a physical system. This model can be expressed as an algebraic equation, integral equation, and ordinary differential equation, partial differential equation, in isolated or combined form. Once an NN model is trained for its generalisation properties, it can be assumed that the trained model represents the physical process of the system. The knowledge acquired for the problem domain during the training process is encoded within the NN in two forms: (a) in the network architecture itself (through number of hidden units) and (b) in a set of constants or weights. Since NN models have large degree of freedom in assigning the weights, they can lead to a situation where two different sets of weights can yield identical outputs (Schmitz et al., 1999). A perturbation analysis of NN parameters may, thus, lead to insignificant implications. However, the distributed nature of information 53
Vol. 2, No. 4
Modern Applied Science
processing in NN implies that a network can be disaggregated in terms of its forecasting inputs, and can still yield outputs. Thus by considering the effects of small disturbances in individual input variables to the network, its relative importance in the total output can be assessed while keeping the network parameters unchanged; or in other words the effect of various inputs on the behavior of the modeled process can be evaluated. n
m
Consider an NN model that represents the functional relationship between attributes inputs x and classes outputs y and evaluated at a set of points S (input patterns) lying inside the domain D. The magnitudes of the partial derivatives of the function with respect to the inputs are a measure of significance and, it is hence assumed that the variables can change freely and independently from one another. This assumption is valid as the influencing factors can be varied individually. However, if the measured attributes are correlated this assumption is not appropriate, as a change in one input feature may be accompanied by a change in another covariant feature. Schmitz et al. (1999) showed that these inter-relationships could be taken into account by focusing on the variations of f that actually occur inside the domain D, which is done by measuring the variation of f when moving between points in S. This variation, is computed by a term absolute variation v(f) of the function f(x) between the points i and j, which is defined as the absolute value of the directional derivative of f(x) integrated along a straight line between the two points. Thus, with ‘u’ as the unit vector in direction x to x . i
j
xj
v ij ( f )
³ 'f ( x ).u dx
(1)
xi
This variation can be ciphered between all pairs of points in S. If an attribute is insignificant to the function for the domain D, the variation in the function will be unrelated to the variation in the attribute and a measure of significance of an attribute x for a function f over a data set S could be the correlation between the absolute variation of the function i
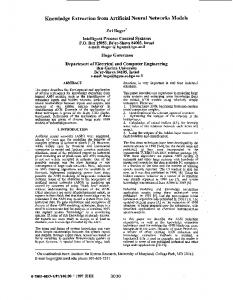
and the absolute variation of that attribute taken between all possible pairs of points in S. This method is illustrated in the following sections with the help of a FFBP Model-1, NN model. This approach is based on cross-, auto-, and partial auto-correlations between the variables in question. The sigmoid function is used as the activation function in both hidden and output layers. Therefore, the model output and input were scaled appropriately to fall within the function limits. A standard feed forward back propagation algorithm is employed to estimate the network parameters. The number of hidden neurons in the network, which is responsible for capturing the dynamic and complex relationship between various input and output variables, was identified by various trials (Eberhart and Dobbins, 1990; Maier and Dandy, 2000). The trial-and-error procedure started with two hidden neurons, and the number of hidden neurons was increased to 10 during the trials with a step size of 1 in each trial. For each set of hidden neurons, the network was trained in batch mode to minimize the mean square error at the output layer. In order to check any over-fitting during training, a cross validation was performed by keeping track of the efficiency of the fitted model. The training was stopped when significant improvement in the efficiency was achieved. The model was then tested for its generalization properties. The final structure of the NN model is: 6 input neurons, 10 hidden neurons, and 3 output neurons. The performance of error measures of the ANN model during testing are presented in Table 2 of Azamathulla et al. 2005. The good correlation between the observed and predicted scour patterns (Table 2 in Azamathulla et al. 2005) even with high levels of perturbation indicates that the NN model is able to capture the information contained in the data very well. The FFBP model-1 performance was very good in terms of the error measures (Azamathulla et al. 2005). This study discusses an effective technique to distinguish the strength of relationship between input and output variables in an NN model. The results suggested that by performing perturbation analysis, the influence of each individual input variable on the output variable can be assessed. The results indicated that the massively parallel and distributed nature of a trained NN is capable of capturing the dynamics of the physical process being modeled. A careful examination of the important information contained in the trained NN can reveal the nature of the physical processes captured by distributed components of the trained NN. Furthermore, it adds that the selection of input vector based on linear correlation between the variables of interest, may still include certain spurious elements that will only increase the model complexity. To ascertain the fault tolerance of the model, the input variables were individually perturbed over the range of validation patterns, and the NN model was used to simulate the forecasts using the perturbed input patterns. Fig. 1 shows the variation of the correlation coefficient between the computed and observed scour during this analysis. As this figure illustrates, an error (perturbation) in the range of -20% to +20 in individual variables does not result in a substantial change in forecasts (see Table. 1). It may be noted that these permissible errors are on the individual values and not the combined effect of errors on all variables. Hence it can be concluded that the trained NN certainly represents the physical behavior of the system through its input variables.
54
Modern Applied Science
July, 2008
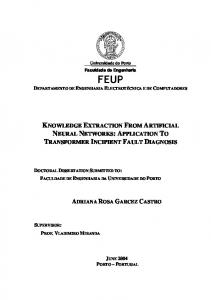
4. Internal Network Structure As mentioned earlier one of the facts pertaining to the functioning of NNs emunity, is that NN models act as mysterious black boxes and do not provide any clue on how they model the physical process. Some sparse and isolated attempts only have been made in the recent past to overcome this deficiency and to understand the interval structure of trained NN e.g. Castro et al. (2002), Wilby et al. (2003), Jain et al. (2004), Sudheer and Jain (2004). These studies showed that hidden neurons can do piecewise regression and can individually model certain catchment processes while predicting runoff in time series modeling. This section attempts to prove this aspect further and it differs from the previous in that it deals with a causal relationship rather than the earlier temporal ones. As an example, a trained FFBP-2 network with 5 input nodes and 10 hidden nodes yielding the scour depth was considered. Because the output is obtained by transforming input using the hidden neurons, the two can be simultaneously studied to explore the piecewise processing. The coefficient of correlation, r, between the output of the scour depth was calculated in order to see the transformation made by the hidden nodes affects the network output. This is shown in Table 2. At the same time the output fired from each hidden neuron was listed as in Table 3 for various testing cases. The hidden neurons H1, H2, H7 are highly correlated with the network output while H3, H4, H8 are not (Table 2). Elimination of these links subsequently was attempted. However, the attempt yielded loose generalization in the results. From Table 2 it can be seen that the neurons H1, H2, H7 produced outputs in the upper half of the total range of the outputs (0,1), while the neurons H3, H4, H8 yielded the outputs in lower tail of the output range. The two tables thus indicated that the influential hidden neurons are H1 H2 and H7. While others (H3, H4, H8) are complimentary, these neurons may be important to take care of the noise in the data. H1, H2, H7 may be modeling the previously known important parameters of head, H1, discharge intensity, q and bucket radius, R while H5, H6, H7, H9, H10 may be modeling other relatively less significant variables like lip angle of bucket, I, sediment size d50. To this extent, present study was in agreement with previous study of time series modeling (Jain et al. 2004). Even in this case of causal relationships, the hidden neurons somehow perform input portioning, transforming it into sub domains with strong hidden neurons. Thus, it is reasonable to assume that the massively parallel components of NN represent different variables of a physical process. A hidden layer thus seems to convert the input domain into another one where the samples become linearly separable and where the data are not forced into a fixed model like regression. 5. Conclusions A perturbation analysis for determining the order of influence of the elements in the input vector on the output vector was discussed. Present study also identified the strength of relationship between individual input variables and the output. The correlation between the observed and predicted scour patterns (Table 2, Azamathulla et al. 2005) and the high value indicate that the NN model is able to capture the information contained in the data very well. It was found that the hidden neurons could do piecewise regression and could individually model certain causal relationships. It was also shown that even in this case of causal relationships, unlike earlier observations belonging to time series predictions, the hidden neurons were capable of executing input partitioning, transforming it into sub domains with strong hidden neurons. Hence, it can be assumed that the components of NN represent different variables of a physical process. A hidden layer thus seems to convert the input domain into another one where the samples become linearly separable and where the data are not forced into a fixed model like regression. 6. Acknowledgments The authors wish to express their sincere gratitude to Universiti Sains Malaysia for funding a short term grant to conduct this on-going research (304.PREDAC.6035262). The authors are also thankful to Prof M C Deo, IIT Bombay for his valuable suggestions. References Azamathulla, H. Md., Deo, M. C. and Deolalikar, P. B. (2005). "Neural networks for estimation of scour downstream of ski-jump bucket", Journal of Hydraulic Engineering, ASCE, 131(10), 898-908.
55
Vol. 2, No. 4
Modern Applied Science
Benitez, J. M., Castro, J. L., and Requena, I. (1997). “Are artificial neural networks black boxes?.” IEEE Trans. Neural Netw. 8(5), 1156–1164. Castro, J. L., Mantas, C. J., and Benitez, J. M. (2002). “Interpretation of artificial neural networks by means of fuzzy rules.” IEEE Trans. Neural Netw. 13 (1), 101–116. Eberhart, R. C., and Dobbins, R. W. (1990). Neural network PC tools: A practical guide, Academic, New York. Ho, Y. C. (1992). “Perturbation analysis: Concepts and algorithms.” Proc., 1992 Winter Simulation Conf., Arlington, Va., J. J. Swain, D. Goldsman, R. C. Crain, and J. R. Wilson, eds., 231–240. Jain, A., Sudheer, K. P., and Srinivasulu, S. (2004). “Identification of physical processes inherent in artificial neural network rainfall runoff models.” Hydrolog. Process., 118(3), 571–581. Jingsheng, J. (2002). “Clustering technique for evaluating and validating neural network performance.” J. Comput. Civ. Eng. 16(2), 152–155. Lange, N. T. (1999). “New mathematical approaches in hydrological modeling-an application of artificial neural networks.” Phys. Chem. Earth, 24(1&2), 31–35. Lozowski, A., Cholewo, T. J., and Zurada, J. M. (1996). “Crisp rule extraction from perceptron network classifiers.” Proc., IEEE International Conf. on Neural Networks. Plenary, Panel, and Special Sessions, Washington, D.C., 94–99. Maier, H.R. Dandy, G.C. (2000). “Neural networks for prediction and forecasting of water resources variables; a review of modeling issues and applications.” Environmental Modelling and Software, Elsevier, 15, 101-124. Schmitz, G. P. J., Aldrich, C., and Gouws, F. S. (1999). “ANN-DT: An algorithm for extraction of decision trees from artificial neural networks.” IEEE Trans. Neural Netw. 10(6), 1392–1401. Stewart (1989). Does God play dice? The mathematics of chaos, Blackwell, Cambridge, Mass. Sudheer, K. P. (2005). “Knowledge extraction from trained neural network river flow models.” ASCE, J. Hydrologic Eng., 10(4), 264-269. Sudheer, K. P. and Jain, A. (2004). “Explaining the internal behaviour of artificial neural network river flow models.” Hydrolog. Process., 118(4), 833–844. Tickle, A. B., Andrews, R., Golea, M., and Diederich, J. (1998). “The truth will come to light: Directions and challenges in extracting knowledge embedded within trained artificial neural network.” IEEE Trans. Neural Netw. 9(6), 1057–1068. Wilby, R. L., Abrahart, R. J., and Dawson, C. W. (2003). “Detection of conceptual model rainfall-runoff processes inside an artificial neural network.” Hydrol. Sci. J. 48(2), 163–181.
56
Modern Applied Science
July, 2008
Table. 1 Perturbation analysis for FFBP Model -1 with out -5%
Perturbation
-10%
-15%
-20%
+5%
+10%
+15%
+20%
perturbation Correlation
0.97
0.97
0.946
0.934
0.925
0.965
0.956
0.954
0.953
0.97
0.965
0.944
0.932
0.927
0.967
0.958
0.956
0.943
0.98
0.975
0.964
0.954
0.954
0.978
0.975
0.968
0.963
coefficient of observed to predicted Scour depth Correlation coefficient of observed to predicted Scour location Correlation coefficient of observed to predicted Scour Width
57
Vol. 2, No. 4
Table 2.
Modern Applied Science
Ranges of H1,H2, H3 …….H10.
H1
H2
H3
H4
H5
H6
H7
H8
H9
H10
0.755713
0.773763
0.029799
0.098279
0.129731
0.316225
0.748967
0.147867
0.32619
0.327166
0.51793
0.525154
0.035753
0.084581
0.182025
0.235407
0.5091
0.186919
0.242003
0.318382
0.479326
0.455511
0.139226
0.24093
0.243339
0.422084
0.53339
0.211481
0.429642
0.112446
0.64017
0.621656
0.223543
0.330968
0.165308
0.516795
0.685279
0.209114
0.525275
0.11156
0.942169
0.951587
0.04294
0.167201
0.042336
0.512524
0.941037
0.124268
0.526984
0.377622
0.584446
0.564944
0.19469
0.299342
0.175767
0.484028
0.638839
0.177494
0.492225
0.08823
0.467791
0.447847
0.145597
0.24162
0.198986
0.41919
0.538603
0.125766
0.426625
0.054413
0.553207
0.559602
0.039631
0.091556
0.192283
0.247866
0.536713
0.216623
0.254818
0.366087
0.517213
0.524174
0.035603
0.084312
0.185477
0.234474
0.507214
0.190512
0.241048
0.323593
0.83728
0.852083
0.044775
0.133331
0.092169
0.39003
0.832141
0.161744
0.401567
0.370908
0.977077
0.976968
0.809945
0.804581
0.000559
0.868021
0.979715
0.180946
0.873543
0.084741
0.977609
0.981387
0.087993
0.27351
0.025865
0.645305
0.974488
0.237951
0.659523
0.619453
0.870284
0.882283
0.054207
0.153628
0.090285
0.423651
0.861084
0.202013
0.435785
0.44994
0.526459
0.506462
0.168855
0.269578
0.186935
0.45138
0.589641
0.14955
0.459224
0.069231
0.420409
0.414402
0.063666
0.099817
0.227244
0.213875
0.399414
0.207281
0.219037
0.25678
0.834577
0.848652
0.043513
0.130597
0.106269
0.381588
0.824783
0.184798
0.393
0.409948
0.586142
0.566786
0.183105
0.293227
0.184511
0.485937
0.639626
0.202188
0.494231
0.112126
0.680157
0.691165
0.042121
0.106223
0.170018
0.294379
0.660921
0.223154
0.302983
0.409799
58
Modern Applied Science
July, 2008
Table 3. Correlation coefficient between output of hidden neuron and Outputs (relative scour depth) 'r' Hidden \ output ds/dw output
Coeefficient of correlation
0.98
H1
0.8133
H2
0.8088
H3
-0.0802
H4
0.0632
H5
-0.7636
H6
0.4401
H7
0.8032
H8
0.1937
H9
0.4526
H10
0.7046
scourdepth scourlength scourwidth
0.97
0.96
0.95
0.94
0.93
0.92 -20
-10
0
10
20
30
Perturbation to inputs (% )
Figure 1. Perturbation to inputs and correlation coefficient for Observed to Predicted Scour
59
Vol. 2, No. 4
Modern Applied Science
1.1
H1 vs d s /d w
1.0 0.9 0.8 0.7
H1
0.6 0.5 0.4 0.3 0.2 0.1 0.0 0.0
0.2
0.4
0.6
0.8
1.0
d s /d w
Figure 2. Output from hidden neuron H1 versus relative scour depth
1.1
H2 vs d s/d w
1.0 0.9 0.8 0.7
H2
0.6 0.5 0.4 0.3 0.2 0.1 0.0 -0.1 0.0
0.1
0.2
0.3
0.4
0.5
0.6
0.7
0.8
0.9
1.0
1.1
d s/d w
Figure 3. Output from hidden neuron H2 versus relative scour depth
60
Modern Applied Science
July, 2008
1.1
H7vs d s /d w
1.0 0.9 0.8 0.7
0.5 0.4 0.3 0.2 0.1 0.0 -0.1 0.0
0.1
0.2
0.3
0.4
0.5
0.6
0.7
0.8
0.9
1.0
1.1
d s /d w
Figure 4. Output from hidden neuron H7 versus relative scour depth 1.1 1.0
H3 vs d s /d w
0.9 0.8 0.7 0.6
H3
H7
0.6
0.5 0.4 0.3 0.2 0.1 0.0 -0.1 0.0
0.1
0.2
0.3
0.4
0.5
0.6
0.7
0.8
0.9
1.0
1.1
d s /d w
Figure 5. Output from hidden neuron H3 versus relative scour depth
61
Vol. 2, No. 4
Modern Applied Science
1.1
H4vs d s /d w
1.0 0.9 0.8 0.7
H4
0.6 0.5 0.4 0.3 0.2 0.1 0.0 -0.1 0.0
0.1
0.2
0.3
0.4
0.5
0.6
0.7
0.8
0.9
1.0
1.1
d s /d w
Figure 6. Output from hidden neuron H4 versus relative scour depth 1.1 1.0
H8vs d s /d w
0.9 0.8 0.7
H8
0.6 0.5 0.4 0.3 0.2 0.1 0.0 -0.1 0.0
0.1
0.2
0.3
0.4
0.5
0.6
0.7
0.8
0.9
1.0
1.1
d s /d w
Figure 7. Output from hidden neuron H8 versus relative scour depth
62