Mar 18, 2009 - September 2011 SPE Journal. 625. Laboratory Measurements and Numerical. Modeling of Streaming Potential for. Downhole Monitoring in ...
Laboratory Measurements and Numerical Modeling of Streaming Potential for Downhole Monitoring in Intelligent Wells M.D. Jackson, SPE, J. Vinogradov, J.H. Saunders, and M.Z. Jaafar,* SPE, Imperial College, London
Summary Downhole monitoring of streaming potential, using electrodes mounted on the outside of insulated casing, is a promising new technology for monitoring water encroachment toward an intelligent well. However, there are still significant uncertainties associated with the interpretation of the measurements, particularly concerning the streaming potential coupling coefficient. This is a key petrophysical property that dictates the magnitude of the streaming potential for a given fluid potential. We present the first measured values of streaming potential coupling coefficient in sandstones saturated with natural and artificial brines relevant to oilfield conditions at higher-than-seawater salinity. We find that the coupling coefficient in quartz-rich sandstones is independent of sample type and brine composition as long as surface electrical conductivity is small. The coupling coefficient is small in magnitude, but still measurable, even when the brine salinity approaches the saturated concentration limit. Consistent results are obtained from two independent experimental setups, using specially designed electrodes and paired pumping experiments to eliminate spurious electrical potentials. We apply the new experimental data in a numerical model to predict the streaming potential signal that would be measured at a well during production. The results suggest that measured signals should be resolvable above background noise in most hydrocarbon reservoirs. Furthermore, water encroaching on a well could be monitored while it is several tens to hundreds of meters away. This contrasts with most other downhole monitoring techniques, which sample only the region immediately adjacent to the wellbore. Our results raise the novel prospect of an oil field in which the wells can detect the approach of water and can respond appropriately. Introduction Permanently installed downhole sensors are increasingly being deployed to provide reservoir data during production. These data help reduce uncertainty in the reservoir description and contribute to reservoir management decisions (Laurence and Brown 2000; Tolan et al. 2001; Manin et al. 2002; Brown et al. 2003, 2004; Bui and Jalali 2004; Kragas et al. 2003, 2004; Webster et al. 2006). In wells equipped with inflow-control valves, it is possible to develop a feedback loop between measurement and control to optimize production (Nyhavn et al. 2000; Addiego-Guevara et al. 2008). Wells equipped with downhole sensors and control valves are often described as “intelligent” or “smart” (Robison 1997; Glandt 2005), and it is widely recognized that they have the potential to significantly enhance production (Robison 1997; Rester et al. 1999; Storer et al. 1999; Nyhavn et al. 2000; Lie and Wallace 2000; Armstrong and Jackson 2001; Tolan et al. 2001). Streaming potentials in porous media arise from the excess electrical charge that is transported by flow (Hunter 1981). The solid surfaces become electrically charged, leading to the formation of a diffuse layer in the adjacent fluid which contains an excess of *Now at the Universiti Teknologi Malaysia. Copyright © 2011 Society of Petroleum Engineers This paper (SPE 120460) was accepted for presentation at the SPE Middle East Oil and Gas Show and Conference, Bahrain, 15–18 March 2009, and revised for publication. Original manuscript received for review 7 October 2009. Revised manuscript received for review 21 September 2010. Paper peer approved 19 October 2010.
September 2011 SPE Journal
countercharge. If more than one fluid phase is present in the pore space, additional double layers may form at fluid/fluid interfaces (e.g., Hunter 1981). If the fluid is induced to flow tangentially to the interface by an external potential gradient, then some of the excess charge within the diffuse layer is transported by the flow, giving rise to a streaming current. Accumulation of charge associated with divergence of the streaming current density establishes an electrical potential, termed the streaming potential. Measurements of streaming potential, using electrodes permanently installed downhole, have recently been proposed as a promising new reservoir-monitoring technology (Jackson et al. 2005; Chen et al. 2006; Saunders et al. 2006, 2008). However, there are still significant uncertainties associated with the interpretation of the measurements, particularly concerning the magnitude and sign of the streaming potential coupling coefficient at high salinity (Saunders et al. 2008). The coupling coefficient (C) is a key petrophysical property that relates the fluid (∇P) and electrical (∇V) potential gradients when the total current density is zero (e.g., Sill 1983), C=
∂V ∂P
, . . . . . . . . . . . . . . . . . . . . . . . . . . . . . . . . . . . . . . (1) j =0
and that can be used to predict the magnitude of the streaming potential generated by a given fluid potential. The coupling coefficient depends upon the electrical conductivity of the brine (�w) and of the brine-saturated rock (�rw); the permittivity (�w) and viscosity (�w) of the brine; and the zeta potential (�), which is the microscopic electrical potential associated with the excess charge in the double layer. It can be expressed as (Hunter 1981) C=
ε w� , . . . . . . . . . . . . . . . . . . . . . . . . . . . . . . . . . . . . (2) � w� rw F
where F is the formation factor, measured when surface conductivity is negligible (typically with a very saline brine). Several studies have reported values of the streaming potential coupling coefficient measured in laboratory experiments. An early motivation was to determine the streaming potential contribution to the spontaneous potential log recorded by wireline tools. After a borehole is drilled, streaming potentials may by generated by the flow of mud filtrate through the mudcake lining the borehole wall or through mudstones in the formation adjacent to the borehole (Wyllie 1951; Gondouin et al. 1962). To quantify the magnitude of these, several workers measured the streaming potential across natural mudstone samples saturated with NaCl brine, and across mudcakes saturated with mud filtrate (Wyllie 1951; Gondouin and Scala 1958; Hill and Anderson 1959). However, it is well-known that the surface electrical properties of the clay minerals in natural and artificial muds and mudstones are different from those of the quartz and feldspar minerals in sandstones, because the crystalline structure of clay minerals promotes the exchange of cations with the brine (van Olphen 1963). Consequently, values of the streaming potential coupling coefficient obtained from mudstone and mudcake samples are not applicable to reservoir sandstones. Values of the streaming potential coupling coefficient measured in sandstones have been reported, but until recently they were obtained only from samples saturated with relatively low salinity (less than seawater, which is approximately 0.5 M) NaCl or KCl brines (e.g., Sen Gupta and Bannerjee 1955; Hill and Anderson 1959; Sprunt et al. 1994; Jouniaux and Pozzi 1995, 1997; Li 625
et al. 1995; Jiang et al. 1998; Lorne et al. 1999a, 1999b; Pengra et al. 1999; Alkafeef and Alajmi 2006). Formation brine in hydrocarbon reservoirs is typically more saline than this, ranging from approximately 0.5 to 4 M (e.g., Fisher 1987; Barth 1991). Only Jaafar et al. (2009) have measured the streaming potential coupling coefficient in sandstones saturated with brine of higher salinity (up to the NaCl saturation limit of approximately 5.5 M at laboratory conditions). However, they investigated only two samples of the same sandstone, saturated with simple NaCl brines. The composition of formation and injected brine in hydrocarbon reservoirs is more complex than the brines used in their study; moreover, the coupling coefficient could potentially vary with rock texture or mineralogy. The aims of this paper are therefore twofold. The first is to investigate the effect of brine composition, and sandstone texture and mineralogy, on the streaming potential coupling coefficient. We present the first measured values of the coupling coefficient in sandstone samples saturated with a range of brine compositions relevant to oilfield conditions, including natural seawater and artificial formation brine. We find that the coupling coefficient in quartz-rich sandstones is insensitive to sandstone type and brine composition within experimental error, so long as surface electrical conductivity is small. Consistent results are obtained from two independent experimental setups, using specially designed electrodes and paired pumping experiments to eliminate spurious electrical potentials. The second aim is to apply these new experimental data in the numerical model of Saunders et al. (2006, 2008) to predict the streaming potential signal that would be measured at a well during production. Streaming potential measurements have been proposed as a method to characterize flow in fractures adjacent to a borehole, and the pressure response of a reservoir during transient production tests (Hunt and Worthington 2000; Chen et al. 2006; Alkafeef et al. 2007). However, in this paper, we focus on the use of streaming potential measurements to detect and characterize water encroaching on a well during production. Our results suggest that measured signals will be resolvable above background noise in most hydrocarbon reservoirs, and that water encroaching on a production well causes changes in the streaming potential at the well while the water is several tens to hundreds of meters away. This contrasts with most other downhole monitoring techniques, which sample only the region immediately adjacent to the wellbore. These findings raise the novel prospect of an oil field in which the wells can detect the approach of water and respond appropriately. Such wells offer enormous potential economic and environmental benefits, particularly in fields that are difficult to access or dangerous to operate (Jackson et al. 2005).
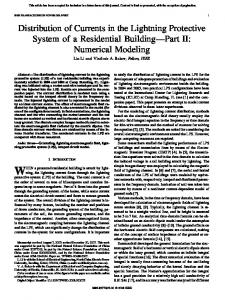
other pair of electrodes is located on each face of the core sample, inside the pressure vessel (Fig. 1c). These internal electrodes, which are in the path of the flow, are significantly less stable than the external electrodes and record flow-rate-dependent voltages at high salinity that are independent of pumping direction and which can mask the streaming potential signal. However, they can also be used to measure the conductivity of the saturated core. We have two different setups, which can be run simultaneously. The first uses a stainless-steel pressure vessel as the core holder and oil as the confining fluid (Fig. 1a). The steel vessel is electrically isolated from the core sample by a rubber sleeve and plastic caps at both ends, and it provides an earthed Faraday enclosure to eliminate spurious external currents. The second setup uses an acrylic pressure vessel with nitrogen as the confining fluid. The vessel is wrapped in earthed foil to provide a Faraday enclosure. The composition of the brines used in the experiments is described in Table 1. The seawater samples are natural and were treated only to kill microorganisms using ultraviolet light and remove solid matter by filtration. The formation brine is artificial; the composition is taken from a North Sea oil field, and the salinity is typical of many reservoirs (Barth 1991). The core samples used in the experiments are described in Table 2. They were all obtained from sandstones exposed at outcrops in the UK and France. Samples of St. Bees 1 and St. Bees 2 are the same as those used by Jaafar et al. (2009). To measure the streaming potential, brine of the chosen composition is pumped through the core sample at a number of constant flow rates until stabilized pressure and voltage differences are recorded across the sample (see Fig. 2). Brine is pumped at the same rate in both directions through the sample to eliminate electrode polarization effects, which are apparent if the coupling coefficient interpreted from the measurements depends upon the flow direction (see Parreira 1965; Ball and Ferstenau 1973). The conductivity of the brine in each reservoir is measured at regular intervals to ensure that it remains constant and equal; this is necessary to eliminate electrochemical potentials. The electrical conductivity of the saturated samples is also measured at regular intervals, over a frequency range of 10 Hz–2 MHz. The pH of the brine is measured before and after each experiment, and, in the measurements reported here, varied between 6 and 8 pH units. Interpretation of the results follows from the observation that at steady state, the streaming current induced by the flow is balanced by a conduction current to maintain overall electrical neutrality. Moreover, the currents follow approximately the same 1D path along the core samples, so Eq. 1 can be written as C=
Experimental Measurement of Streaming Potential Coupling Coefficient The experimental method is described in detail by Jaafar et al. (2009), so only a brief overview is provided here. Brine is pumped using a syringe pump and synthetic oil as a hydraulic fluid at constant rate through the sandstone core samples, which are held within a pressure vessel with a confining pressure of approximately 500 kPa (Fig. 1). The initial and outlet pore-fluid pressure is atmospheric. The syringe pump maintains constant rate to high accuracy, and flow can be directed in either direction through the samples. Using the synthetic oil as a hydraulic fluid allows air bubbles in the brine to be captured at the top of the oil layer in each reservoir, eliminates the flow of electrical current through the brine along a path parallel to the core sample, and reduces corrosion of the pump. The pressure difference across the core sample is measured using a pair of pressure transducers, and the voltage across the sample is measured using two pairs of nonpolarizing Ag/AgCl electrodes. One pair of electrodes is positioned out of the flow path to eliminate spurious potential drift and electrode flow effects (Korpi and deBruyn 1972; Morgan et al. 1989). These external electrodes are located in a brine reservoir that is in electrical contact with the flowing brine through a low-permeability plug (Fig. 1b), and they provide voltage measurements that are stable to tens of �V. The 626
�V , . . . . . . . . . . . . . . . . . . . . . . . . . . . . . . . . . . . . . . . . (3) �P
where ΔP is the pressure difference and ΔV is the voltage across the core sample. A linear regression through the stabilized pressure and voltage differences yields the streaming potential coupling coefficient (see Fig. 2b). Experimental Results Fig. 2 shows a typical example of data recorded from the experiments. Fig. 2a shows a plot of voltage (ΔV) and pressure difference (ΔP) against time for St. Bees 2, flowing the formation brine at 5×10⁻² mL·s–1. As soon as pumping starts at t = 50 seconds, the pressure difference increases and stabilizes after approximately 20 seconds. The voltage also changes, stabilizing at the same time as the pressure. When pumping stops at t = 1,160 seconds, the pressure difference and voltage relax to their initial values. Pumping then starts in the opposite direction, but at the same flowrate, at t = 1,750 seconds, causing the pressure and voltage to respond in the opposite sense to the previous flow, but with the same magnitude, which gives us confidence that electrode effects are small. When pumping stops at t = 2,900 seconds, both pressure and voltage relax to their initial values. Fig. 2b shows a plot of stabilized voltage (ΔV) against pressure difference (ΔP) for St. Bees 2, flowing the formation brine. A linear regression through these September 2011 SPE Journal
(a)
Pump V1
Ag/AgCl Oil reservoir
V3
V4
NaCl solution
V2
Porous disc Brine flow line Data acquisition system
P1
Oil column
P2
V6
Brine column
Core holder
V5 Pressure transducer
Sampling
(c)
Sampling
M Manometer
To column 1
AgCl membrane Purge
Rubber sleeve
P1
To column 2
Confining pressure pump
P2 Core Silver rod
Silver rod
(b)
Coarse mesh Fine mesh
Fig. 1—Experimental setup for measuring the streaming potential coupling coefficient. (a) Brine is pumped through a pressurized core holder located between two brine reservoirs, driven by synthetic oil as a hydraulic fluid that allows gas bubbles to be isolated and prevents electrical current flow parallel to the core. Brine can be pumped in either direction through the core holder by adjusting the valves on the flowlines. (b) The external electrodes are located out of the flow path in an NaCl solution that is more saline than the flowing brine. The electrodes are in electrical contact with the flowing brine through a low-permeability porous disc. (c) Cross section through the core holder. The internal electrodes are located on each face of the sample, and can be used to measure streaming potential or resistivity.
data yields a value of the streaming potential coupling coefficient C = –7.6×10⁻¹⁰ V·Pa–1, with R2 = 0.97052. Fig. 3 shows the measured value of coupling coefficient as a function of brine salinity along with data from previous studies. Also shown is an empirical relation between the coupling coeffiSeptember 2011 SPE Journal
cient and brine salinity obtained directly from a regression through the available data for sandstones C = −1.36C −f 0.9123 , . . . . . . . . . . . . . . . . . . . . . . . . . . . . . . . . . (4) 627
TABLE 1—CHEMICAL COMPOSITION OF BRINES USED IN THE EXPERIMENTS Composition (M) Species
UK Seawater
Dead Sea Water
Formation Brine
Cl
0.55
5.77
1.329
SO4
0.0283
0.00587
0.0005
Na
0.67
2.96
1.154
Mg
0.053
1.62
0.0225
Ca
0.0103
0.39
0.0625
K
0.0102
0.17
0.012
HCO3
–
0.0015
0.006
Br
–
0.059
–
Sr
–
0.0035
–
Li
–
0.0025
–
Mn
–
0.0000564
–
TABLE 2—DESCRIPTION OF THE ROCK SAMPLES USED IN THE EXPERIMENTS St. Bees 1 (Cut Parallel to Bedding)
St. Bees 2 (Cut Perpendicular to Bedding)
Fontainebleau
Stainton
7.2%
17%
19%
Grain size
250 m
60–200 m
60–200 m
P e rm eability (brine)
25 m d
38 m d
>99% quartz
90% quartz 5% clay and feldspar