But while academics in the field of landscape architecture and its relatives
continue to advance .... Yet while GIS is now ubiquitous in planning departments,
it.
Dave Toms
1/12/2010
LANDSCAPE ARCHITECTURE AND EVOLVING GIS Everything is related to everything else but near things are more related than distant things. –Tobler’s First Law of Geography This is the tenant of Geographic Information Science (GIScience) and underlies all the data structures, algorithms, and software of modern Geographic Information Systems (GIS). And with its implied focus on place, context, and relationships, it is no surprise that landscape architects were instrumental in the early development of GIS technology and methods. But while academics in the field of landscape architecture and its relatives continue to advance both GIScience and GIS, the majority body of practicing landscape architects appears to be far behind current advances. GIS has moved into an era where GIS analysis can integrate into the design process just after the moment when back‐of‐the‐napkin sketches are conceived. In addition to supporting established methods of site inventory and analysis, it has evolved into a tool capable of analyzing human interactions in 4 dimensions. Its new capabilities allow landscape architects to bring massive computing power to bear on questions of human experience and narrative. If landscape architects embrace this technology, they can fundamentally evolve the design process and positively influence their social impact. This paper tracks the history and current applications of GIS, and explores future potential of GIS application in the landscape architecture design process.
HISTORY A GIS is an organized assemblage of computer hardware, software, spatial data and operating instructions designed for capturing, storing, updating, manipulating, analyzing, and displaying all forms of geographically referenced information. (Hanna & Culpepper, 1998) This model began emerging as the first automated mapping products and military satellite imagery appeared in the late 1950’s. Through the 1960’s and 1970’s, landscape architects were instrumental in developing analysis methods that would be incorporated into developing software systems, while government and academic institutions developed hardware and data standards. As computing power exploded and costs declined in the 1980’s and 1990’s, GIS systems became available for desktop processing and became increasingly common in government and business offices. Concurrently, new satellite sensors, the Global Positioning System, and the Internet enabled the production and distribution of massive volumes of geographically referenced data. By the end of the 20th century, geographic analysis had become cheap, efficient, and accessible to millions of users. The following table highlights major events in GIS history. (Longley, 2001) Table 1 : Significant Events in the History of GIS Date Event 1957 First known automated mapping produced 1964 Harvard Lab established
1969
ESRI Inc. formed
1969
Design With Nature published
1979
Defensible Processes for Landscape Design published
Note Swedish meteorologists and British Biologists The Harvard Laboratory for Computer Graphics and Spatial Analysis is established under the direction of Howard Fisher at Harvard University. In 1966 SYMAP, the first raster GIS, is created by Harvard Researchers Landscape Architect, Jack Dangermond and his wife Laura form ESRI to undertake projects Ian McHarg’s book was the first to describe many of the concepts in modern GIS analysis, including the map overlay process. Regional Carl Steinitz, Harvard GSD, describes the use of GIS based modeling to evaluate alternative futures.
1
Dave Toms
1/12/2010
1981
ArcInfo launched
1985
GPS operational
1988
TIGER announced
1994
Executive Order signed by President Clinton
1996
Internet GIS products introduced
1999
IKONOS
2000
1 million GIS users
2001
First Location Based Services deployed
First major commercial GIS software system released. Designed for minicomputers and based on the vector and relational database, sets a new industry standard. The Global Posiitioning System gradually becomes a major source of data for navigation, surveying and mapping. Topologically Integrated Geographic Encoding and Referencing is described by the US Census Bureau. Stimulates rapid growth in business GIS. EO12906 leads to creation of US National Spatial Data Infrastructure and Federal Geographic Data Committee Autodesk, ESRI, Integraph, MapQuest, and MapInfo release new generation of internet‐based products New generation of satellite sensors launched. IKONOS claims 90cm ground resolution, Quickbird claims 62cm. LANDSAT7. GIS has more than 1 million core users and estimates of 5 million casual users. KDDI releases first mobile phones that integrate GPS and GIS services.
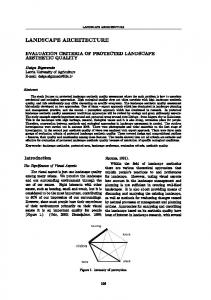
COMMON GIS APPLICATIONS From a landscape architecture perspective, Ian McHarg set the stage for modern Geographic Information Science in his 1969 book, Design With Nature. In it, McHarg outlined the Overlay Method. (Figure 1) The overlay method assigns values to thematic data (land cover, property lines, etc.) that are a measure of the ability of that condition to accommodate a particular use. Multiple data layers are then overlaid and their overlapping values summed. The results indicate the most desirable locations for the use in question. Or as in Figure 2, overlays can be used estimate the combined effects of multiple properties; pollution potential in this case. (Dibase, 2010; McHarg, 1992) The method has become a standard practice in site suitability analysis and is extremely effective for incorporating natural resource FIGURE 1 : OVERLAY METHOD information into planning and design processes. But as with all techniques it does have some shortcomings, most notably is its absolute rationalism. Any GIS operator with the same data and the same method will reach the same conclusion. Design, however, is a fluid process that embraces nebulous and qualitative aspects of human experience. Deterministic decisions FIGURE 2
based solely on the overlay method (data in, answer out) are severely lacking in this dimension.
2
1/12/2010
Dave Toms
The second great contribution to GIS analysis methods by a landscape architect comes from Carl Steinitz of Harvard University. Steinitz elaborated on the overlay method to produce a model for evaluating landscape change and future impacts of design alternatives. (Steinitz, 1979) Steinitz designed a framework for understanding and organizing the landscape planning process. The framework is essentially a classification system that identifies and orders the main purposes of models according to the type of questions they address. The process of landscape analysis and decision making is guided by a deceptively simple flow chart represented in Figure 3.(Dangermond, 2009) In a design process, the 6 stages of the Steinitz Model are passed through a minimum of three times. The first pass moves from Representation Models to Decision Models and helps define context and scope of the design problem. The second pass moves in reverse, from Decision to Representation Models, to identify the unique FIGURE 3 methodology needed to answer the design problem in context. In the third pass, from Representation to Decision Models, analysis is applied to the specific question at each stage. Reaching a “no” decision at any level in the framework demands reassessment of prior decisions. Analysis continues until a positive “yes” outcome is achieved. In theory, this method reveals the best and most defensible design intervention on a particular site. (Steinitz, 2003) These two methods, coupled with a massive expansion of free and easily distributable data, have evolved GIS into a powerful tool for landscape architects and planners. Yet while GIS is now ubiquitous in planning departments, it finds relatively limited application in practicing landscape architecture firms. (Hanna & Culpepper, 1998) Although with a rising emphasis on sustainability, this trend may be changing.
GIS CRITICISMS The methodologies described above are Table 2 : Comparison of Traditional and Design Sciences powerful decision making tools, but this power GIS & traditional sciences The Design sciences is not without criticism. Perhaps foremost in Analysis Synthesis the minds of landscape architects is its severe From instances to principles From principles to instances analytical rigor and inhumanity. Design is a Causal Goal‐oriented synthetic process concerned with human Descriptive Prescriptive Positive Normative qualities of intent, purpose, and emotion. IS OUGHT TO BE Landscape architects are concerned with questions like: Has the function of this place changed recently? How should this place change now that related activities or functions are changing? How should this place be configured in order to support the anticipated activities? The ability of GIS to support these kinds of queries is currently very limited. It cannot yet support queries as to why – say – there is a small structure at the bottom of the ski slope and whether another one should be expected to be at the top, or how that entire configuration of open spaces and installations may change if the ski resort closes for good. Table 2 compares the differences between GIS and traditional sciences to the Design sciences. (Couclelis & COSIT, 2009)
3
Dave Toms
1/12/2010
This analytical focus is further reinforced within academia and industry. Martin and Wing evaluated GIS texts, course syllabi, vendor advertising and the like and determined the general discourse of GIS, “facilitates an ongoing devaluation of non‐GIS practices and theorizations.”(Martin & Wing, 2007) Thus in practice, the reliance on GIS in its common form overemphasizes easily quantifiable attributes like land cover, elevation, and cadastral boundaries, and minimizes qualitative, yet critical attributes related to human experience and interpretation. For example, a McHargian overlay will reveal which road alignment will avoid wetlands, maximize traffic volume, and minimize construction cost, but it cannot tell you if that road alignment accommodates the dreams and ambitions of the community for whom it will serve. In other words, in does not incorporate or evaluate human intent. For landscape architects who are critically engaged in synthesizing human experience into designed spaces, this may prove a hindrance to the design process and explain why GIS application remains limited within the industry.
EMERGING TECHNOLOGY, PARADIGMS, AND APPLICATIONS Recognizing GIS’ positivistic tendencies and partial conflict with the design process, many researchers are pursuing alternate applications of GIS that address social and emotional aspects of place and geography. Concurrently, GIS hardware and software is being reinvented in ways that make integration with the design process both seamless and desirable from the outset. The following is a brief survey of these advances beginning with examples of hardware/software evolutions, followed by social applications and integration.
USER INTERFACES Marshall McLuhan coined the phrase, “The Medium is the Message,” meaning that a designer’s chosen media directly influences how a message is perceived by others. (McLuhan & Gordon, 2003) In context of landscape architecture, the message is a designed product; master plan, city park, etc. When GIS is incorporated into the design process, its influence permeates throughout. At the personal level, research has identified that a designer’s understanding of spatial relationships is strongly influenced by the computer‐user interface. The designer accessing data through keyboard and mouse has measurably less awareness of spatial relationships the designer using tangible objects. (Ishii, 2008; Mi & Maher, 2008) In response, researchers have made great strides in the development of Tangible User Interfaces (TUIs) that engage the designer’s dexterity and ability to manipulate physical objects like building blocks and clay models. (Ishii, 2008; Mitasova et al., 2006; Ratti, Ishii, Frenchman, Wang, & Piper, 2004). These efforts now allow designers to pinch, bend, and pull material much like they would with a traditional model, yet incorporate the processing and analysis power of a complete GIS. Mitisova describes an application in which a GIS with Illuminated Clay Model was used to explore various structure placement and terrain modification scenarios for sediment control and prevention of local flooding in a small watershed. A projector is FIGURE 4 : TANGIBLE USER INTERFACE
4
Dave Toms
1/12/2010
used to project landscape data such as soils, land cover, and building footprints on the physical model. The designer alters the model using small blocks and clay to simulate new building arrangements and grading changes. (Figure 4) A 3‐D scanner analyzes the changes in the physical model and loads them into the GIS. Hydrology models are run using the new landscape information and the results are projected onto the physical model. The projection indicates places where the proposed changes result in flooding and erosion problems. The calculations take seconds and allow the user to physically test multiple design possibilities.(Mitasova et al., 2006) One can imagine the design potential if such technology was employed at an early design meeting, with stakeholders and clients testing their ideas on the fly. The ESRI Corporation is introducing upgrades to its popular ArcMap GIS software package that integrates sketch‐ style ideation with the spatial analysis capability of a GIS.(Dangermond, 2009) This integration is termed GeoDesign. ESRI’s upgraded computing environment allows the designer to quickly draw new features and analyze their impact almost instantaneously. When coupled with a digital pen tablet, the GIS functions like a sketch pad with embedded environmental data. For example, the landscape architect could sketch several rough alternatives of a site plan and test each for impervious coverage, view shed impact, circulation barriers, etc. In this way, complex spatial data is embedded in the ideation process and will theoretically produce a more robust final design. It must be noted that GeoDesign is not an ESRI brand, but rather a larger movement of aligned technologies and practitioners. The second annual GeoDesign Summit was recently convened and set an agenda to advance the philosophy.(ESRI, 2010) The conference concluded that the concept must be advanced by educators, researchers, technologists, and practitioners. Landscape architects have a significant role to play in the future of GeoDesign as the momentum behind the movement will undoubtedly bring adoption by current and future GIS users. As synthetic thinkers, landscape architects are well suited to establishing the workflows and methodologies these users will embrace.
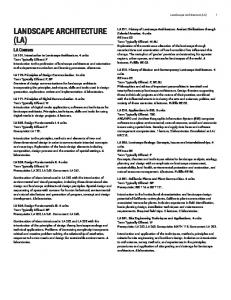
SOCIAL ENGAGEMENT ‐ CRITICAL, PARTICIPATORY, AND FEMINIST GIS Questions of justice, equity, and experience are at the center of all design problems. However, conventional GIS has either been unable to assist in the analysis of these qualitative aspects or has actually introduced damaging bias into the design process. (Sheppard, 2005) Conventional GIS can be characterized as a technological manifestation of Modernism. It espouses speed, efficiency, and function at the cost of personal human awareness. In the same way that modernist architecture celebrated function and marginalized context and human experience, conventional GIS presents an absolute geography embedded with the patriarchal biases of institutional data producers. It has been unable to incorporate space defining attributes like personal memories and narratives. Recognizing this shortcoming, Critical, Participatory, and Feminist GIS have emerged over the past decade as fields of science dedicated to understanding the impacts of GIS technologies on individuals and overcoming its ambivalence to ordinary, everyday living.(Harvey, Mei‐Po Kwan, & Pavlovskaya, 2005) Conventional GIS is often viewed as a masculine technology. Its origin in the fields of national defense, land management, and remote sensing is a primary criticism. As are its reliance on rigid Cartesian coordinate
FIGURE 5 : 3D TRAVEL NARRATIVE
5
1/12/2010
Dave Toms
systems, reinforcement of the distance between researcher and subject, and its dedication to impersonal data collection; i.e. remote sensing satellites and government surveys. At best, people are represented as points on a map.(Sheppard, Couclelis, Graham, Harrington, & Onsrud, 1999) Feminist geography & GIS, however, recognize that for women, knowledge is often rooted in experience and observation. Researchers are now using GIS to map women’s life paths in space and time, analyze geographical contexts of everyday life, and constructing cartographic narratives that capture the richness of women’s lives. (McLafferty, 2005) Researchers are using this new GIS paradigm to reveal social characteristics with profound impacts to landscape architecture practice. Kwan documents how smartphones and other mobile devices have fundamentally changed urban travel patterns and individual understanding of distance and time. She notes how mobile communications allow people and groups to redirect trips to meet real‐time needs and increase spatial mobility and trips. The ability to shop, manage business contacts, and coordinate meetings on the fly reduces the need to spend time at home or conduct business during normal business hours. This in turn creates free time, encourages more travel, and expands social interactions. (M. Kwan, 2007) In a separate study, she analyzes a woman’s travel over the course of one day. A narrative of her day is then visualized in 3D to indicate her geographical route (x,y axes), time spent at a destination (z‐axis), and her perception of safety (line color). (Figure 5) (M. Kwan & Ding, 2008) Landscape architects involved in transportation planning, urban design, etc. must recognize these new patterns and understand that conventional maps of distance and transportation access are not the singular predictor of personal travel choices or quality of experience. Pavlovskaya employed principles of feminist GIS to examine the link between the micro‐geographies of women’s everyday lives and urban restructuring in Moscow after the collapse of communism. Conventional GIS relies on premade, quantifiable data sets but this type of data did not fit the fine scale neighborhood data she needed to complete the study. Thus Pavlovskaya collected alternative data sets capable of representing detailed urban change. She used phone book addresses to reconcile inconsistencies with pre/post privatization building footprint data layers, then interviewed neighborhood residents to ground truth the data and construct personal accounts of the transition. Her analysis revealed that many families did not use any of the rapidly growing retail stores, travel agencies, financial, professional, and business support services because they were either too expensive or irrelevant to FIGURE 6 : FEMINIST GIS GENERATED MAP their daily lives. In fact, there were multiple economies at work within the neighborhood.(Figure 6) This conclusion was significantly different than that reached by those examining conventional economic data and maps, who generally recognized only the macro economy at work. (Pavlovskaya, 2002) Her research emphasizes the depth digitized narratives linked to geography can bring to neighborhood/site analysis. By incorporating methods like hers, landscape architects can increase the social relevance of their site analyses by orders of magnitude. Participatory GIS (or Public Participation GIS) is another evolution beyond conventional GIS that is being used to progress social and environmental justice causes and bridge technological inequities imposed by conventional GIS. It recognizes that despite its short comings, GIS can be a powerful mediator of spatial knowledge, social and
6
Dave Toms
1/12/2010
political power, and intellectual practice in geography and landscape architecture. University‐community partnerships, organizational collaboration, local knowledge production, and participatory research are eliminating access barriers experienced by grass‐roots groups and other resource poor or marginalized GIS users. Multimedia reconstruction of software and databases are diversifying forms of spatial knowledge to include digital photos, sound files, sketch maps, and 3D representations.(Elwood, 2006b) A large body of case studies implementing participatory GIS into a variety of public decision making processes is refining the methodologies and demonstrating the application potential for landscape architects. Kyem illustrates how GIS influences values and actions in a conflict mediation over forest resource allocation. In this study, the timing of the introduction of GIS into the heated negotiation is shown to have a measurable impact on the stakeholders. If introduced too early, some stakeholders place false confidence in “The Map” and assume that it will ensure an equitable distribution of the contested resource. They self‐limit their participation in the negotiation and in turn reduce their bargaining power. On the other hand, when the introduction of GIS into the negotiation is well timed, it “allowed the parties to focus less on contesting one another’s claims and to concentrate on a fresh source of ideas, specific concerns, and issues needing attention at the moment. The GIS applications promoted a search for evidence to substantiate opinions, allegations, and accusations. This evidential requirement reduced reliance on speculation, and as a result, factual considerations formed the basis for reaching final decisions.”(Kyem, 2004) For the landscape architect who commonly uses GIS to build base maps early in a public participation process, these finding are consequential. Still other studies show how community organizations apply their own interpretive frameworks to GIS maps and images to produce spatial narratives of local needs, conditions, and assets that may be adapted to the diverse roles and relationships they negotiate in urban spatial politics. These groups produce flexible mapping strategies to respond to expectations of different audiences. By incorporating spatial narratives into their GIS database, they are able to visualize multiple narratives about neighborhoods, conditions, and capacities. (Table 3) (Elwood, 2006a) This reflexive model of qualitative GIS data could provide landscape architects many benefits. It could clearly be used to enhance site analysis and increase understanding of the communities in which they work, but in the reverse, it could improve their ability to communicate design decisions and intent back to the community.
Table 3 : Flexible Mapping Strategies Spatial narrative Purpose Needs Assets
Injustice Accomplishment
Reinterpretation
Show current or potential problems with neighborhood spaces, structures, or people. Illustrate existing resources or opportunities for positive changes in neighborhood space, structures, and people. Show inequalities between neighborhood and other places/scales. Illustrate community organization successes in neighborhood (programs, physical/material forms of development). Present official data through new interpretive frames, to advance neighborhood priorities or agenda.
Interpretive examples Vacant lots as sites of problematic activities (drug dealing, violence, loitering). Vacant lots as sites for new houses or businesses.
Vacant lots in multiple neighborhoods, to show unequal conditions. Vacant lots acquired for inclusion in community organizations’ affordable housing land trust. Lots designated as vacant in city database, but categorized by community group to differentiate community gardens from unused land.
ACCESS While not quite as energizing as innovations in tactile interfaces and social engagement, the emergence of an open source GIS community has removed most of the startup costs for building complex GIS systems. Universal access
7
1/12/2010
Dave Toms
to the full power of GIS is now available to any individual or organization with a modest computer system through free software downloads.(Mitasova & Neteler, 2004)
CONCLUSION This paper provides an overview of innovation occurring in the technological and theoretical world of GIS. Innovations in software and method are pushing well beyond the conventional application of GIS and developing tools that could vitally improve the practice of landscape architecture. GIS now supports early integration into the design process, offers new analysis techniques that expand awareness of neighborhood values, and eliminates social barriers to technology. Much of this work is being produced in humanities, social science, and geography departments at a number of universities. Notably lacking in the literature is significant representation by landscape architects. This is unsettling because the questions being pursued and innovations being realized have great potential and direct application to landscape architecture by their ability to connect fact and value.(Talen & Shah, 2007) There are notable exceptions of course, (Crewe, 2001; Dangermond, 2009; Juarez & Brown, 2008; Steinitz, 2003) but on the whole, landscape architecture practice is behind the times. Landscape architects remain in the conventional era of GIS that is based in positivist and instrumental forms of decision making. They have yet to recognize the ability and benefit of digitizing qualitative knowledge or the fact that conventional GIS presents a god’s eye view of the world that erases social, political, and economic contexts. This is a hobbling condition for an industry responsible for building human environments based on community needs. If landscape architects take seriously their role as community builders, then they must embrace GIS as an exploratory design tool and elevate its application beyond elementary inventory and analysis.
REFERENCES Couclelis, H., & COSIT. (2009). The abduction of geographic information science: Transporting spatial reasoning to the realm of purpose and design. Crewe, K. (2001). The quality of participatory design: The effects of citizen input on the design of the boston southwest corridor. Retrieved from Journal of the American Planning Association, 67(4), 437. http://search.ebscohost.com.www.lib.ncsu.edu:2048/login.aspx?direct=true&db=aph&AN=5343519&site=ehost‐live&scope=site Dangermond, J. (2009). GIS: Designing our future ‐ ArcNews summer 2009 issue. Retrieved 1/9/2010, 2010, from http://www.esri.com/news/arcnews/summer09articles/gis‐designing‐our‐future.html Dibase, D. e. a. (2010). Map overlay concept | nature of geographic information. Retrieved 1/8/2010, 2010, from https://www.e‐ education.psu.edu/natureofgeoinfo/c9_p6.html Elwood, S. (2006a). Beyond cooptation or resistance: Urban spatial politics, community organizations, and GIS‐based spatial narratives. Annals of the Association of American Geographers, 96(2), 323‐341. doi:10.1111/j.1467‐8306.2006.00480.x Elwood, S. (2006b). Critical issues in participatory GIS: Deconstructions, reconstructions, and new research directions. Transactions in GIS, 10(5), 693‐708. doi:10.1111/j.1467‐9671.2006.01023.x ESRI. (2010). 2010 GeoDesign summit. Retrieved 1/11/2010, 2010, from http://www.geodesignsummit.com/index.html Hanna, K. C., & Culpepper, R. B. (1998). GIS in site design : New tools for design professionals. New York: Wiley. Harvey, F., Mei‐Po Kwan, & Pavlovskaya, M. (2005). Introduction: Critical GIS. Cartographica, 40(4), 1‐4. Retrieved from http://search.ebscohost.com/login.aspx?direct=true&db=aph&AN=19818026&site=ehost‐live&scope=site
8
1/12/2010
Dave Toms
Ishii, H. (2008). The tangible user interface and its evolution. Communications of the ACM, 51(6), 32‐36. Retrieved from http://search.ebscohost.com/login.aspx?direct=true&db=aph&AN=32801374&site=ehost‐live&scope=site Juarez, J. A., & Brown, K. D. (2008). Extracting or empowering? Landscape Journal, 27(2), 190‐204. Retrieved from http://search.ebscohost.com/login.aspx?direct=true&db=buh&AN=35173598&site=ehost‐live&scope=site Kwan, M., & Ding, G. (2008). Geo‐narrative: Extending geographic information systems for narrative analysis in qualitative and mixed‐ method research. Professional Geographer, 60(4), 443‐465. doi:10.1080/00330120802211752 Kwan, M. (2007). Mobile communications, social networks, and urban travel: Hypertext as a new metaphor for conceptualizing spatial interaction. Professional Geographer, 59(4), 434‐446. doi:10.1111/j.1467‐9272.2007.00633.x Kyem, P. A. K. (2004). Of intractable conflicts and participatory GIS applications: The search for consensus amidst competing claims and institutional demands. Annals of the Association of American Geographers, 94(1), 37‐57. doi:10.1111/j.1467‐8306.2004.09401003.x Longley, P. (2001). Geographic information systems and science. Chichester ; New York: Wiley. Martin, K. S., & Wing, J. (2007). The discourse and discipline of GIS. Cartographica, 42(3), 235‐248. Retrieved from http://search.ebscohost.com/login.aspx?direct=true&db=aph&AN=28634726&site=ehost‐live&scope=site McHarg, I. L. (1992). Design with nature (25th anniversary ed.). New York: J. Wiley. McLafferty, S. (2005). Women and GIS: Geospatial technologies and feminist geographies. Cartographica, 40(4), 37‐45. Retrieved from http://search.ebscohost.com/login.aspx?direct=true&db=aph&AN=19818050&site=ehost‐live&scope=site McLuhan, M., & Gordon, W. T. (2003). Understanding media : The extensions of man (Critical ed.). Corte Madera, CA: Gingko Press. Mi, J. K., & Maher, M. L. (2008). The impact of tangible user interfaces on designers' spatial cognition. Human‐Computer Interaction, 23(2), 101‐137. doi:10.1080/07370020802016415 Mitasova, H., Mitas, L., Ratti, C., Ishii, H., Alonso, J., & Harmon, R. S. (2006). Real‐time landscape model interaction using a tangible geospatial modeling environment. IEEE Computer Graphics & Applications, 26(4), 55‐63. Retrieved from http://search.ebscohost.com/login.aspx?direct=true&db=aph&AN=21566980&site=ehost‐live&scope=site Mitasova, H., & Neteler, M. (2004). GRASS as open source free software GIS: Accomplishments and perspectives Blackwell Publishing Limited. doi:10.1111/j.1467‐9671.2004.00172.x Pavlovskaya, M. E. (2002). Mapping urban change and changing GIS: Other views of economic restructuring. Gender, Place & Culture: A Journal of Feminist Geography, 9(3), 281‐289. doi:10.1080/0966369022000003897 Ratti, C., Ishii, H., Frenchman, D., Wang, Y., & Piper, B. (2004). Tangible user interfaces (TUIs): A novel paradigm for GIS. Transactions in GIS, 8(4), 407‐421. doi:10.1111/j.1467‐9671.2004.00193.x Sheppard, E. (2005). Knowledge production through critical GIS: Genealogy and prospects. Cartographica, 40(4), 5‐21. Retrieved from http://search.ebscohost.com/login.aspx?direct=true&db=aph&AN=19818035&site=ehost‐live&scope=site Sheppard, E., Couclelis, H., Graham, S., Harrington, J. W., & Onsrud, H. (1999). Geographies of the information society. International Journal of Geographical Information Science, 13(8), 797‐823. doi:10.1080/136588199241021 Steinitz, C. (1979). Defensible processes for regional landscape design. Washington, D.C.: American Society for Landscape Architects. Steinitz, C. (2003). Alternative futures for changing landscapes : The upper san pedro river basin in arizona and sonora. Washington, DC: Island Press. Talen, E., & Shah, S. (2007). Neighborhood evaluation using GIS: An exploratory study. Environment and Behavior, 39(5), 583‐615. doi:10.1177/0013916506292332
9