common clinical practice. Manual scoring of the events included, among the common standard parameters, the annotation of sleep stages and of EEG arousals.
arXiv:1809.06216 [q-bio.NC]
Large-scale validation of an automatic EEG arousal detection algorithm using different heterogeneous databases
Diego Alvarez-Estevez1, Isaac Fernández-Varela2
1
Sleep center and clinical neurophysiology department, Haaglanden Medisch Centrum, The Hague, The Netherlands 2 Computer Science department, University of A Coruña, A Coruña, Spain
*** Abstract Objective: To assess the validity of an automatic EEG arousal detection algorithm using large patient samples and different heterogeneous databases Methods: Automatic scorings were confronted with results from human expert scorers on a total of 2768 full-night PSG recordings obtained from two different databases. Of them, 472 recordings were obtained during clinical routine at our sleep center, and were subdivided into two subgroups of 220 (HMC-S) and 252 (HMC-M) recordings each, attending to the procedure followed by the clinical expert during the visual review (semi-automatic or purely manual, respectively). In addition, 2296 recordings from the public SHHS-2 database were evaluated against the respective manual expert scorings. Results: Event-by-event epoch-based validation resulted in an overall Cohen’s kappa agreement κ = 0.600 (HMC-S), 0.559 (HMC-M), and 0.573 (SHHS2). Estimated inter-scorer variability on the datasets was, respectively, κ = 0.594, 0.561 and 0.543. Analyses of the corresponding Arousal Index scores showed associated automatic-human repeatability indices ranging in 0.693-0.771 (HMC-S), 0.646-0.791 (HMC-M), and 0.759-0.791 (SHHS2). Conclusions: Large-scale validation of our automatic EEG arousal detector on different databases has shown robust performance and good generalization results comparable to the expected levels of human agreement. Special emphasis has been put on allowing reproducibility of the results and implementation of our method has been made accessible online as open source code. Keywords: automated scoring, EEG arousal, polysomnography
1. Introduction Electroencephalographic (EEG) arousals are transient events of the sleep EEG indicative of ongoing awakening activity. Specifically, according to the current clinical reference standards [1] EEG arousals are defined as abrupt shifts on the EEG frequency including alpha, theta and/or frequencies greater than 16 Hz (but not spindles) that last at least 3 seconds, with at least 10
seconds of stable sleep preceding the change. The scoring of arousals during the Rapid Eye Movement (REM) phase requires a concurrent increase in submental electromyogram (EMG) lasting at least one second. Evidence supports EEG arousals as an important component of the sleep process, and their scoring during routine polysomnographic (PSG) examination is advised
essential as a means of evaluating a subject’s sleep continuity, and in order to give treatment and treatment response guidelines to practitioners [2]. Manual visual examination of the entire PSG for the scoring of these events is costly, due to the complexity and the amount of data involved. Given this context several works have explored the possibility of developing automatic analysis software to help the clinician during the scoring process [3] [4] [5] [6] [7] [8] [9] [10] [11] [12] [13] [14] [15] [16]. While some of the previous approaches have shown promising performance, validation methods are usually limited to relatively small (ranging 2-31 recordings), controlled, and mostly local and private datasets. It remains a question whether the detection capabilities of these algorithms generalize to larger samples, different databases, and perform well on a clinical (noncontrolled) environment. Actually, the reality is that the grade of acceptability of these algorithms among the clinical community still remains low, being rarely used in the clinical practice. In a recent work [16], we have presented a preliminary version of a method for automatic EEG arousal detection, obtaining good validation results on a controlled dataset of 22 PSG in-hospital recordings. Building upon this initial version, an updated algorithm has been developed and set it up to work in the clinical environment, where clinicians can choose whether to use it, or not, as a supportive scoring tool while reviewing their night recordings. In this work we are presenting a large-scale validation on the performance of this updated approach. Validation has been carried out on a large sample of patients using our own sleep center database, but it has also extended by evaluating the algorithm over a large, external, and public database, namely the Sleep Heart Health Study (SHHS) [17]. On each case, the expected level of interscorer human variability has been estimated in order to contextualize the results of the analyses. Moreover, the source code of the algorithm has been published freely available on the internet for the research and the clinical community. To our knowledge this is the largest and more complete validation ever done of an algorithm of this kind. 2. Methods 2.1. Databases The validation of the EEG arousal detection algorithm is performed using as reference data from two different and large databases. A first database is composed of clinical sleep recordings from our own sleep center (Haaglanden Medisch Centrum - HMC, The Hague, The Netherlands). Second, an external and public accessible
source is used, namely the Sleep Heart Health Study (SHHS) database [17]. Each of the databases and the different derived datasets are described in detail in the following lines. A summary of resulting demographics and main PSG data are shown in Table 1. 2.1.1.
HMC
This data collection is composed of PSG recordings gathered retrospectively from the Haaglanden Medisch Centrum (The Hague, The Netherlands) sleep center database. PSG recordings were acquired in the course of common clinical practice, and thus did not subject people to any other treatment nor prescribed any additional behavior outside of the usual clinical procedures. Data were anonymized avoiding any possibility of individual patient identification. The study was carried out in full compliance with the corresponding applicable law and under the supervision of the local Medical Ethics Committee. Patient signals were acquired using SOMNOscreenTM plus devices (SOMNOmedics, Germany) and digitized using the EDF+ format [18]. PSGs were afterwards analyzed offline by clinical experts in the course of common clinical practice. Manual scoring of the events included, among the common standard parameters, the annotation of sleep stages and of EEG arousals. All the procedures were performed according to the standard AASM guidelines [1]. As a homogenization criterion we required the recordings to contain at least 4 hours of Total Sleep Time (TST) after clinical scoring. To match a scenario as close as possible to the real working conditions, no further attempt was made to filter out, or to reject any recording, due to specific patient conditions or to poor signal quality. The only required condition was that the recording had been accepted by the clinicians for the manual scoring of EEG arousals. In total, the sample included 472 recordings from patients visiting our center between April and October 2017. Data included both 24-h ambulatory (APSG, n=352) and in-hospital night (HPSG, n=143) recordings. From this database two separated datasets were arranged as described below. HMC-S: A dataset containing 220 clinical recordings out of the original 472. Specifically, the dataset is composed of 176 APSGs and 45 HPSGs. PSG recordings from this dataset were clinically scored using a semi-automatic approach. First, the clinician used an automatic scoring algorithm for the detection of EEG arousals, and then, on a second pass, the scorer reviewed de results of the automatic scoring replacing, adding or deleting events where necessary. The automatic scoring algorithm used for this purpose was a previous version of the current approach which was described in detail in [16]. 2
Table 1. Summary of demographic data and main PSG characteristics for the different datasets. Data are indicated as mean ± standard deviation; n = number of recordings, M = Males, F = Females, ArI = Arousal Index, AHI = Apnea-Hypopnea Index Dataset HMC-S HMC-M SHHS2
n 220 252 2296
Age 52.99±14.33 51.58±16.22 67.41±10.03
Gender 137 M (62%) / 83 F ( 38%) 133 M (53%) / 119 F (47%) 1026 M (45%) / 1270 F (55%)
HMC-M: This dataset is composed of 252 recordings out of the original 472, split into 176 APSGs and 98 HPSGs. Recordings from this dataset were scored following the classical clinical routine, i.e. purely-manual without any support of automatic scoring. 2.1.2.
SHHS
The Sleep Heart Health Study (SHHS) is a multi-center cohort study implemented by the National Heart Lung & Blood Institute to determine the cardiovascular and other consequences of sleep-disordered breathing. This database is available online upon permission at the National Sleep Research Resource (NSRR) [19] [20]. More information about the rationale, design, and protocol of the SHHS study can be found in the dedicated NSRR section [21] and in the literature [17] [22]. A sample of participants who met the SHHS inclusion criteria (age 40 years or older; no history of treatment of sleep apnea; no tracheostomy; no current home oxygen therapy) was invited to participate in the baseline examination of the SHHS, which included an initial polysomnogram (SHHS-1). In all, 6441 individuals were enrolled between November 1, 1995, and January 31, 1998. During exam cycle 3 (January 2001- June 2003), a second polysomnogram (SHHS-2) was obtained in 3295 of the participants. Raw PSG data are available at NSSR for 5793 subjects within SHHS-1, and for 2651 subjects within SHHS-2. Polysomnograms were obtained in an unattended setting, usually at home, by trained and certified technicians. Specifications for the full montage settings can be found in the corresponding section at the NSRR website [21]. Scoring of sleep stages in SHHS is based on the R&K guidelines [23]. Note that in SHHS, however, no attempt was made to distinguish Stage 3 from Stage 4 which are combined into a single “Deep Sleep” category, similarly as in the current AASM standards [24] [1]. Scoring of arousals was done following the ASDA1992 manual [25]. Full specification of all the scoring criteria, as well as quality control procedures for the SHHS study, can be found in the Reading Center Manual of Operations [26]. From SHHS, the SHHS-2 dataset was used as the reference to validate our EEG arousal detection algorithm. Out of the 2561 PSGs available at NSRR, a total of 2492 recordings were selected after excluding those that did not match the general SHHS2 v3 signal
ArI 12.85±7.86 12.45±10.48 12.91±7.02
AHI 13.33±15.28 14.83±21.03 16.25±15.64
montage [27], or for which no attempt to score EEG arousals was performed by the SHHS scorers. From this subset, 60 recordings were further excluded due to complete technical failure (complete absence of workable EEG and/or EMG signal during the whole recording) leading to 2433 recordings left. No further attempt was made to filter out, or reject any recording, due to poor signal quality conditions. Similarly as for HMC datasets, the selection excluded recordings for which TST < 4 hours. In total 2296 recordings were finally included for the validation of our algorithm. 2.2. Algorithm overview The current version of the EEG arousals detection algorithm is largely based on a previous version which was described and validated elsewhere [16]. The current updated version is an evolution, although it preserves the same original philosophy of simplicity and robustness. The algorithm works using just one EEG and one EMG chin derivations. The use of an additional ECG channel for the removal of ECG artifacts is optional. The method for ECG artifact removal is based on adaptive filtering and it has been described in detail elsewhere [28] [16]. It is a multistage method that consists of a first signal preprocessing step (digital Notch filtering in both signals, with optional adaptive ECG artifact removal, and high-pass filtering in the EMG), followed by detection of candidate events based on frequency changes in the EEG (power content analysis in the alpha (8–12 Hz) and in the beta (>16 Hz) bands). As a result of these steps candidate arousal regions are identified signaling the presence of EEG arousal activity. The analysis proceeds by pattern matching this activity using individual EEG and EMG relevant features. Eventually, candidate EEG arousals can be merged together, or the initial arousal region can be adjusted, usually by extending the corresponding event's offset, if recognizable arousal activity follows. The detection of EEG arousal events involves different subroutines including (i) EEG power-based, (ii) EEG amplitudebased, and (iii) EMG amplitude-based pattern recognition. Finally, false positives are discarded after examining each candidate event within the context of the accepted clinical definitions, including (i) its adequacy to the standard event duration constraints, (ii) the absence of sleep spindle activity, (iii) the absence of EMG activity during REM periods, and (iv) the 3
presence of (at least) 10s of stable sleep preceding the onset of the event. Adaptations to the algorithm were necessary on the first term to support the possibility of different montage configurations, signals sampling rates, and filtering settings (e.g. mains interference occurs in America at 60 Hz while at 50 Hz in Europe). In addition, detection thresholds were modified to increase the sensitivity for detection of alpha-prevalent arousal events, and to achieve better discrimination of sleep spindle activity. A number of processing steps were also simplified, namely regarding the EEG power-based pattern recognition (skipping the first false detection check, and discarding the whole procedure in the case of alpha arousals) and the detection of concurrent EMG activity. Extended technical information is out of the scope for the purposes of this study, and thus the interested reader is referred to check the original publication for details [16]. In addition, the source code of the algorithm has been made publicly available as open-source, allowing tracking of all the changes and implementation details. The code (implemented using Matlab) can be downloaded from GitHub [29]. 2.3. Experimental procedures All the recordings from the datasets described in Section 2.1. were rescored by the automatic algorithm. For parameter configuration, two separated and relatively size-reduced datasets, namely HMC-22 and SHHS1-26, were used. Using this approach it is possible to keep the parameterization independent of the testing data (HMCS, HMC-M, and SHHS2) therefore allowing the possibility to evaluate the generalization capabilities of the algorithm. HMC-22 was used for the validation of an earlier version of our algorithm and it is composed of 22 in-hospital PSG recordings gathered from the HMC database. More detailed description of the dataset and the related validation process can be found in [16]. The SHHS1-26 dataset, on the other hand, is composed of 26 ambulatory PSG recordings gathered from the SHHS-1 study. This dataset was used to validate alternative EEG arousal detection approaches in the past, which are described in detail in [14] and in [15]. Subsets of SHHS1-26 were used as well to validate different machine learning-based approaches described in [12] (n = 20) and in [13] (n = 10). Reference derivations for automatic EEG arousal analysis vary per dataset due to differences between the respective clinical montages. Specifically, for HMC datasets a C4/M1 EEG with bipolar submental EMG configuration was used on the case of HPSG recordings, while for APSGs the Cz/O2 EEG derivation was used instead. In both cases a single-channel modified lead II ECG derivation was used as reference for the analysis, and for the removal of ECG artifacts from the EEG and the EMG signals [16] [28]. The sampling frequency was
256 Hz for all the signals. Out of the two central EEG derivations available for SHHS recordings [21], the C3/A2 channel was used, together with the default bipolar submental EMG trace. Bipolar-lead ECG was sampled at 125 Hz for SHHS-1, and at 250 Hz for SHHS-2 recordings, and it was used analogously for ECG artifact removal purposes. The analysis included the automatic rescoring of all EEG arousals, while the remaining (non-EEG arousal) expert annotations were left intact. This includes, for example, the “lights out” and “lights on” markers, and the hypnogram annotations, used respectively to determine the valid scoring and the sleeping periods. To avoid bias of the analysis due to the unbalance in the recording time between in-hospital and ambulatory recordings, only Time In Bed (TIB) periods were further considered for the validation. Specifically, for HMC datasets this period was extracted straightaway from the “lights out” and “lights on” markers available within each of the EDF+ annotation files, set by the scorers while manually reviewing the recordings. For SHHS, such markers were not explicitly available within the file annotations. In this case TIB was calculated using the variables “stloutp” (Lights out time) and “time_bed” (TIB in minutes from “lights out” to “lights on”) available within the SHHS2 metadata (for details see [30]). Once all the EEG arousals were automatically scored by the algorithm, the validation was performed using two different and complementary approaches. First, eventto-event scoring validation was carried out using a 30 s epoch basis. For this purpose, every EEG arousal event was assigned to a unique epoch, according to the location of its middle point. Using a 2x2 confusion matrix validation metrics for nominal data, namely sensitivity (recall), specificity, precision, F-1 score, and Cohen´s kappa index were then calculated. Second, and from a clinical perspective, the respective Arousal Index (ArI) scores were calculated and compared per recording. For validation metrics involving numerical data we used both, the AndersonDarling and the Lilliefors tests, to check the normal distribution hypothesis. In general, statistical testing was conducted using Matlab software, and the reference significance level was set at α = 0.05. Correlation coefficients were calculated among the respective automatic and clinical reference ArI scores. Statistical significance for paired differences at the recording level was calculated using the Wilcoxon signed rank test. In addition, the Intraclass Correlation Coefficient (ICC) was used as the default measure of repeatability to examine scoring differences [31]. Specifically, a twoway absolute single-measures ICC variant of the statistic was considered [32], using the implementation available 4
at [33]. ICC results were calculated both in the original scale and after log-transformation of the respective automatic and clinical reference scores. Furthermore, for non-Gaussian distributions repeatability was also examined using Generalized Linear Mixed-Effects Models (GLMMs) with log-link and multiplicative overdispersion modeling [34]. Parametric bootstrapping and Bayesian methods were used for interval estimation, and randomization methods were used for significance testing. Results are provided both on the original and on the link scales. Specifically, the rptR package [34] [35] available for the R statistical computing language was used for this purpose. Assessment of the expected inter-scorer reliability Analysis of the expected level of inter-scorer variability was performed in order to adequately contextualize the results of the automatic scoring. For such purpose a subset of the available PSGs for each dataset was rescored by an independent expert scorer, and the results were compared against the original clinical scorings. Manual rescoring of all the recordings in each dataset, however, was unattainable in practice due to the high number of recordings, and hence to the high associated costs in human resources. Thus a procedure was established to estimate the actual underlying variability using a reduced subset of recordings. The exact procedure is described as follows: (i)
For each dataset the respective distribution of the kappa indices obtained from the previous automatic vs clinical validation was used as reference.
(ii)
From this distribution, the five recordings whose associated indices represent the middle of each inter-quartile range, plus the median, were selected as representatives of the whole population. That is, for each dataset, the recordings with kappa scores on the 12.5, 37.5, 50, 62.5 and 87.5 percentiles were used.
(iii)
Each of these recordings was then rescored by a dedicated expert scorer (not present during the first scoring round), blinded to the results of the original analysis. Display montages at the rescoring step were configured to match the same conditions as during the original clinical scoring. Note, that during the rescoring, the hypnogram that resulted from the first scoring was available for contextual interpretation. Its modification on the other hand was not allowed. Note as well that respiratory activity traces were omitted from the display for the purposes of EEG arousal scoring.
Analysis of the rescoring results was carried out by calculating the corresponding derived kappa indices, and
by confronting them to both the corresponding clinical and automatic results. Further statistical analyses of the corresponding ArI indices were omitted, as with five measurements per dataset, low statistical power of the derived metrics was expected [36]. 3. Results Results of epoch-based event-by-event validation are summarized in Tables 2 and 3. In Table 2, and for each dataset, the total number of epochs and the respective validation metrics are accumulated across all the recordings. In Table 3 statistical descriptors are shown by considering the respective per-recording distributions. In general indices do not follow a normal distribution, and thus data is presented using the median and the associated first and third quartiles. For the SHHS2 dataset Figure 1 shows the corresponding kappa index distributions in relation to the respective signal quality scores (check [26] for details on SHHS quality assessment procedures). Kruskal-Wallis analyses resulted in p = 0.004 and p < 0.001 respectively for the EEG and chin EMG distributions. Subsequent multiple comparison tests under the Tukey’s honest significant difference criterion showed, however, no group differences for the EEG, while for the EMG, only group 1 was significantly different from groups 4 and 5. Unfortunately, quality assessment data were not available for the HMC database to perform a similar analysis. Statistical analysis of diagnostic indices The results from the corresponding ArI distribution analyses are shown in Table 4. Distribution descriptors using the mean and standard derivation, as well as the median and the respective interquartile ranges, are shown per dataset. Individual and difference distributions were analyzed showing non-Gaussian distributions in general (p < 0.01 in all the cases). For the difference distributions the corresponding Wilcoxon paired test p-value is explicitly shown in the last column. In this respect results reject the null hypothesis H0 “median of differences is zero” at α = 0.05, but for the HMC-M dataset (p = 0.224). Further tailed analysis shows that differences for HMC-S and for SHHS2 are not significant anymore when assuming a median difference bias of +0.3 (p = 0.088 and p = 0.104 respectively). Results of the repeatability analyses are shown in Table 5. The linear correlation coefficient (r) and the ICC indices are shown, both for the original and for the logtransformed variables. GLMMs are adequate in the case of non-Gaussian distributions [34], and the corresponding derived indices were similarly calculated in the original and in the latent scales. In both cases a log-link function was used. Notice that reporting repeatability of the transformed variables is the most 5
Table 2. Overall results of the event-by-event epoch-based validation on the testing datasets. Sensitivity (Sens), Specificity (Spec), Precision (Prec), F1-score and Cohen´s kappa index are calculated based on the total number of cases in the respective contingency table. For each dataset the total number of epochs are accumulated across all the recordings; TP= True Positives, FP = False Negatives, TN = True Negatives, FN = False Negatives Dataset
#Epochs
TP
FP
TN
FN
Sens
Spec
Prec
HMC-S HMC-M SHHS2
207312 236336 2201487
12492 13130 119702
5170 7340 41398
180600 205668 1928384
9050 10198 112003
0.580 0.563 0.517
0.972 0.953 0.979
0.707 0.641 0.743
F1score 0.637 0.600 0.610
Kappa 0.600 0.559 0.573
Table 3. Distribution descriptors of the per-recording event-by-event validation metrics. Data is shown as Q2 (Q1, Q3) quartiles; Sens = Sensitivity, Spec = Specificity, Prec = Precision Dataset HMC-S HMC-M SHHS2
Sens 0.608 (0.476, 0.724) 0.587 (0.438, 0.731) 0.509 (0.394, 0.634)
Spec 0.978 (0.966, 0.986) 0.973 (0.954, 0.987) 0.983 (0.973, 0.989)
Prec 0.715 (0.618, 0.804) 0.667 (0.484, 0.784) 0.757 (0.661, 0.824)
interesting choice in most of the cases [34] [37]. For completeness, however, here both estimates are reported. In all the cases statistical significance of the
F1-score 0.643 (0.539, 0.712) 0.571 (0.489, 0.658) 0.590 (0.503, 0.683)
Kappa 0.609 (0.494, 0.683) 0.529 (0.435, 0.621) 0.552 (0.461, 0.651)
respective tests was confirmed (p < 0.001 for all the indices).
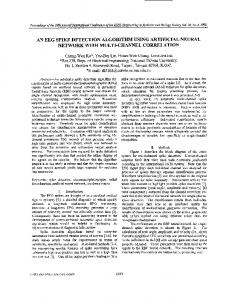
Figure 1. Signal quality assessments for the 2296 recordings used for validation in the SHHS2 dataset (automatic vs manual event-by-event validation). Grades were assigned by SHHS scorers according to the SHHS quality assessment procedures. In SHHS2 values vary from 1 (poorest) to 5 (best) and reflect the proportion of sleep time in which the signals were free of artifact; “1”: < 25%, “2”: 25-49%, “3”: 50-74%, “4”: 75-94%, “5”: > 95%. Upper plot: “Quality of the EEG signal (queeg1)”. Lower plot: “Quality of the EMG chin signal (quchin)”. On each case the first subplot shows the corresponding kappa distributions per group (numerical values for the median and the inter-quartile ranges are indicated below). The subsequent subplot shows a histogram with the number of recordings involved in the corresponding category.
6
Table 4. Summary of statistical tests for the diagnostic ArI indices (automatic vs clinical reference). *Normality test rejected with p