atmosphere of the clean room, chemicals, bulk gases and unionized water, lithography ... A commonly-used design technique for yield enhancement is through.
Layout Synthesis Techniques for Yield Enhancement Venkat K. R. Chiluvuri
and
Israel Koren
Department of Electrical and Computer Engineering University of Massachusetts, Amherst, MA 01003, USA
Abstract Several yield enhancement techniques are proposed for the last two stages of VLSI design, i.e., topological/symbolic and physical layout synthesis. Our approach is based on modi cations of the symbolic/physical layout to reduce the sensitivity of the design to random point defects without increasing the area, rather than fault tolerance techniques. A layout compaction algorithm is presented and the yield improvement results of some industrial layout examples are shown. This algorithm has been implemented in a commercial CAD framework. Some routing techniques for wire length and via minimization are presented and the results of wire length reduction in benchmark routing examples are shown. We demonstrate through topological optimization for PLA-based designs that yield enhancement can be applied even at a higher level of design abstraction. Experimental results show that it is possible to achieve signi cant yield improvements without increasing the layout area by applying the proposed techniques during layout synthesis.
I Introduction
Continued advances in VLSI technology, along with the development of more sophisticated CAD tools, enable an increase in the level of integration of silicon chips. By integrating more and more circuits on a single chip, system performance improvements can be achieved. However, due to unavoidable manufacturing process variations/imperfections, chip sizes must be limited to a certain size, beyond which the yield of the chips is so low that the product is no longer commercially viable. Processing imperfections such as point defects and line registration errors are introduced into the IC layers during the lithography process. The main sources of point defects are dust and other unwanted particles in the atmosphere of the clean room, chemicals, bulk gases and unionized water, lithography and other fabrication equipment. Some of these defects may result in missing patterns or open circuits, while other defects may result in extra patterns or short circuits. During the past 15 years, feature sizes have diminished drastically from a few microns to submicrons, allowing integration of over a million transistors on a single chip. At the same time manufacturing process complexity (i.e., number of lithography levels) has increased signi cantly. Die sizes of high-performance general-purpose microprocessors have already crossed 2cm2. For example, the die size of the Digital's Alpha 21064 microprocessor chip is 2.34 cm2. Such large-area chips became a reality because defect densities dropped almost one order of magnitude during this period. It may be unlikely to have similar substantial improvements in manufacturing facilities in the near future to improve the yield. Therefore, further increase in the level of integration may result in chips with low manufacturing yields. For example, it may be extremely di�cult to achieve yield of over 40-50% for a 5 cm2 chip even under mature manufacturing conditions. Such yields cannot be expected by achieving factory performance goals alone [12]. Thus, new design techniques must be found in order to achieve further improvements in the yield of large-area chips. Localized changes in the layout generated by the general design rules may allow us to increase the yield without any area overhead. Our approach for yield enhancement is based on modi cations of the layout to reduce the sensitivity of the design to point defects without increasing the area, rather than fault tolerance techniques. Unlike the more traditional defect tolerance approach, which requires the development of special redundancy techniques for the given design, the proposed approach is applicable to all design styles and does not require any additional resources in terms of silicon area. Another important property is that the layout changes can be automated and made part of the physical design tools (e.g., compaction, routing) making them transparent to the 2
designer.
1.1 Design for Yield
Several design techniques have been proposed for many stages of design synthesis for yield enhancement. A commonly-used design technique for yield enhancement is through defect tolerance, i.e., the incorporation of redundant circuits. A variety of fault-tolerant techniques have been proposed for memory ICs, PLA-based designs and Wafer Scale Integrated Systems. These fault-tolerant techniques have proved to be very e�ective in certain situations (e.g., memory chips) but involve a cost of additional area and design e�ort. Also, defect tolerance techniques have been developed for only highly regular designs. There is still no general approach to the incorporation of defect tolerance in random logic design. IC device parameters are very sensitive to unavoidable variations in manufacturing process. It is very important to maintain these device parameters within acceptable limits in order to guarantee the circuit performance. Yield degradation due to these global process variations is known as parametric yield. Several statistical design centering techniques have been developed for parametric yield optimization [28]. The objective of statistical design centering is to maximize the parametric yield of a circuit with respect to manufacturing process parameters. For the physical layout design stage, the concept of `Design for Yield` has been applied very successfully through global design rules and area minimization [32] from the very beginning. These design rules are optimized for minimizing the process yield losses due to global variations. However, in a mature manufacturing line, random point defects are the major source of yield losses. The e�ect of a defect on the chip is strongly dependent on where the defect is located. Therefore, the susceptibility of a chip depends on the layout density, where a denser layout is more susceptible to defects. So far, only limited attention has been given to point defects during the layout design. To maintain the yield of future chips with complexities exceeding 10 million transistors, the distribution of point defects and the sensitivity of the design to these defects must be taken into account during the layout synthesis. Therefore, by including defect sensitivity as an additional criterion at the physical design level for yield enhancement, substantially better results can be achieved. Several mathematical models have been proposed for very accurate yield predictions. This high degree of accuracy is achieved, to a large extent, by replacing the chip area with critical area (which represents the defect sensitivity of the layout) in the yield models [14, 19, 20, 27, 33]. Recently several methods have been proposed for estimating the yield of a chip from its layout detail. Xlaser and other yield analysis CAD tools are based on analytical models [15, 26]. Monte-Carlo-simulation-based yield prediction tools were also 3
developed, e.g., [35]. Alhough, these tools are useful for yield analysis, they cannot be used to modify layouts for yield enhancement. Only recently have researchers started reporting their work in the area of layout synthesis for yield enhancement. The rst signi cant work in the area of layout modi cations for yield improvement has been reported by Allan [1]. A set of local rules have been proposed for contacts, metal and polysilicon layers for yield enhancement. However, these techniques are not general enough to be applied in the regular physical layout synthesis stages such as routing and compaction. Some routing techniques for yield enhancement have been developed for two layer routing [22, 30]. These routing algorithms are based on minimization of defect sensitivity of the layout. In the routers proposed in [30], defect sensitivity of the second layer is not considered while minimizing the defect sensitivity of the rst layer. Moreover, criteria chosen for defect sensitivity was not based on any analytical models reported in the yield literature. These shortcomings were addressed to some extent in [22]. The major drawback is that if the layouts generated by these routers are compacted, their yield criteria becomes invalid. Some results have been reported even for the placement and oorplan stages of layout synthesis as well [21].
1.2 Defect-Sensitivity of a Layout
Researchers have proposed several yield models [11, 19] to predict the manufacturing yield. The three-parameter generalized negative binomial yield model given in equation (1) was found to match better empirical results than other yield models.
Y = Y0(1 + dA�=�)?�
(1)
where Y is the yield of the die, Y0 is the gross yield factor, d is the average number of defects per unit area, A is the area of the die, � is the probability that a defect will result in a circuit fault and � is the clustering parameter. In this model, A represents the total area of the die, while the product A� (also called the critical area) represents the portion of the chip area that is sensitive to defects. In other words, not every defect results in a circuit failure. The e�ect of a defect on the chip is strongly dependent on where the defect is located. Therefore, the susceptibility of a chip depends on the layout density, where a denser layout is more susceptible to defects. Thus, layout design rules for a given fabrication process have a strong impact on the yield. These design rules are formulated in such a way that global disturbances, such as misalignment of the masks, line width variations of the poly and di�usions, lateral di�usion on the di�usion line, etc may have a minimal e�ect, and the amount of logic per chip is maximized. 4
Since all the above disturbances are mainly the result of process variations, these layout rules are targeted to maximize the gross yield, Y0. So far, only limited attention has been given to point defects while formulating the design rules. The contribution of point defects to yield losses will be very high in a mature manufacturing process of submicron technologies. Therefore, to further improve the yield of large chips, the distribution of point defects and the sensitivity of the design to these defects must be taken into account while designing the nal layout. The probability that a defect will cause a failure, �, depends on the size of the defect relative to the dimensions of the layout patterns. Several analytical models were proposed to calculate the critical area from layout details [14, 27, 33]. The critical area for defects of size x is de ned as the area in which the center of a defect must fall in order to cause a circuit failure. The expected value of the critical area, AC , is computed using
AC =
Z 1 0
A(x)f (x)dx
(2)
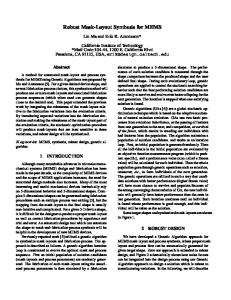
where A(x) is the critical area for defects of size x and f (x) is the defect size probability density function. General layout design rules, like minimum width and spacing for individual layers, have to be maintained with respect to a speci c process. Local variations might be possible in some layers in such a way that the sensitivity of a layer to point defects is reduced. For example, the spacing of some lines can be increased so that the total critical area of that layer is reduced. When these changes are made in the interconnect logic, they do not introduce any functional/parametric changes in the circuit. The RC characteristics remain almost the same. However, when similar changes are made in the active logic, special attention should be paid to maintaining the functional and performance requirements. The e�ect of reduction in the critical area on the yield of a chip depends on its size. This is shown in Figure 1. In larger chips yield improvements will be proportional to critical area reduction. For example, the yield of a 2.5cm2 chip can be improved by 14% with a 15% reduction in the critical area. (Yield in Figure 1 is calculated using the negative binomial model with Y0 = 0.95, � = 1.5 and � = 1/cm2). This illustrates the signi cance of the critical area reduction for yield enhancement in large-area chips. The future challenges of ever increasing complexity of VLSI systems can be met only if the manufacturing yield of these very large chips is maintained at a pro table level. All aspects of yield enhancement need special attention in order to o�set the yield losses due to increasing process complexity and diminishing feature size. To achieve higher yield for very complex VLSI/ULSI systems, they have to be designed for yield. It is not good enough just 5
to look for area minimization. It is essential to consider how various elements are arranged within the given area. Existing CAD systems need to be supplemented by yield optimization tools.
6
2.0 Compaction Strategies for Yield Enhancement
The importance of chip area minimization in increasing the manufacturing yield can not be over emphasized. Special CAD tools such as compactors are developed exclusively to perform area minimization [2, 3, 4]. While the primary goal of all the compactors is to minimize the area, they include some secondary objectives like minimizing the total wire length, minimizing the number of jogs etc. Most of these secondary objectives are oriented towards performance improvements. Though the importance of yield enhancement is recognized [2, 4, 25], so far very little attention was paid to it in physical layout synthesis. Compactors generate actual layouts that occupy minimum area either from symbolic layouts or from actual layouts generated by other layout synthesis tools. In constraint graph based compaction algorithms [4, 23], physical connectivity and separation constraints between the elements are represented by a directed graph. The minimum achievable size of the layout is determined by the longest path (critical path) of the constraint graph. The elements on the critical path are placed at the minimum distances to minimize the area and therefore, they have no freedom to move. However, elements that do not lie on the critical path can be placed in a variety of ways. So far this additional freedom has been utilized very e�ectively to optimize the performance by way of wire length minimization [3]. A new compaction algorithm is presented in this section to improve the yield without increasing the layout area. This new compaction algorithm improves the yield of the nal design by distributing the spacing between non-critical elements so as to minimize the total defect sensitivity for given particular manufacturing conditions, i.e., defect size distribution and defect densities for di�erent layers of the layout. The defect sensitivity of the opencircuit type faults is minimized by increasing the width of several non-critical elements in the layout.
2.1 Relocation of Non-Critical Elements
Compactors place various circuit elements as close as the design rules permit. Though this helps in minimizing the area, it unnecessarily packs many non-critical elements very close together resulting in layers with a large critical area for short-circuit faults. When relocating the wire segments, the compactor may stretch them in order to maintain the original topology, resulting in longer nets and layers with a large critical area for opencircuit faults. In the SPARCS compactor [4] non-critical elements can be placed either on the top or bottom (left or right) optionally. If we take the defect size distribution and the additional wires introduced in relocating the elements also into consideration, much better 7
results from the yield point of view can be obtained. Since the defect size distribution is inversely proportional to the defect size raised to the power of 3 [33], change in the critical area will be nonuniform. For example, by increasing the spacing from 3 microns to 4 microns between the two wire segments of length 100 microns, the critical area of short-circuit faults can be reduced by 4 �m2 whereas for the same amount of increase in spacing from 10 microns to 11 microns the corresponding reduction will be only 0.35 �m2. Any increase in spacing beyond the largest defect size (about 20 microns) does not decrease the critical area at all. It is interesting to note that when changes are made in the layout to minimize the sensitivity of the design to one type of defects, the sensitivity to other defect types may increase. For example, when the width of the metal/active lines is increased to minimize the sensitivity of the design to open-circuit faults, its sensitivity to short-circuit faults and pinhole faults might increase. Therefore, critical area of open- as well as short-circuit faults should be considered while nding an optimal location for non-critical elements. The optimal location for a non-critical element is calculated by minimizing the function given below
�(y) =
Z Dmax
Wmin
Acop(y)D0op +
Z Dmax
Wmin
Acsh (y)D0sh
(3)
where �(y) is the number of defects which can a�ect the functionality of the element, Acsh(y) (Acop(y)) is the average critical area of short-circuit (open-circuit) faults, D0sh (D0op ) is the defect density of short-circuit (open-circuit) faults, Wmin is the minimum design rule for spacing, Dmax is the maximum defect size and y represents the width and the location of the element. The optimal location for a layout element depends on (a) its length, (b) spacing between the element and the elements above and below. In addition, elements connected on both sides and their widths also in uence the optimal location of an element. For example, in Figure 3a, element 10 is connected to two elements 9 and 11 which are above. When element 10 is moved up by one unit (Lambda(�)), the length of each jog will be reduced by one unit. This reduction in jog length will result in fewer open-circuit faults as well as short-circuit faults between adjacent jogs. On the other hand, if an element is connected to other elements which are below, its upward movement will result in extra jog lengths and the associated faults. For a wire segment, only elements in the same layer are considered, where as for a contact, characteristics of the elements connected in the other layer must also be considered. 8
The advantage of this method is that a layout can be optimized for any given manufacturing conditions. Details of the algorithm and the yield improvements achieved in two-layer channel layouts by using this compaction algorithm are presented below.
2.2 Compaction Algorithm
We propose a constraint-graph-based algorithm to nd optimal locations for all noncritical elements of a given layout so that its sensitivity to short-circuit type faults is reduced. The input to the algorithm is the directed-graph representation of the compacted layout. The defect size distribution f (x), where x is the size of the defect, and the defect densities, d (per unit area), for di�erent layers of the layout are the other inputs to the algorithm. In the compacted layout all elements are placed at the minimum possible distances from one end edge of the layout, top or bottom, left or right depending on the direction of compaction. We assume vertical compaction from top to bottom to describe the algorithm. Each node in the graph represents an element or a group of elements and each edge represents the spacing constraint between two adjacent elements. The edge weight represents the distance between two adjacent wire segments and the node weight represents its defect sensitivity.
9
Step 1. Initialization f
Identify all non-critical elements in the graph and arrange them in BFS order; Initialize the node weights (nodewt-ref); term- ag = true; g
Step 2. Optimization
while (term- ag) f term- ag = false; for each non-critical element f nodewt = nodewt-ref; new-nodewt = 0; while (new-nodewt < nodewt) if the element can be moved do f move the element upward by StepSize; calculate new-nodewt; if (new-nodewt < nodewt) f update node positions nodewt = new-nodewt; new-nodewt = 0; term- ag = true; g g
g
g
Figure 2. Compaction Algorithm First, node weights are calculated for all non-critical elements in the layout. The critical area of the rectangular elements or regions is calculated using the analytical models presented in [14, 33]. Then, each non-critical element is searched in the breadth- rst order for an optimal location. Elements can be moved only in the upward direction since all the elements are at the minimum possible location to start with. If the current spacing between the node and each of its incident nodes is more than the minimum design rule speci cation, then that node can be moved upwards. The maximum distance that an element can be moved is known as critical slack. An element is moved only if the critical slack is positive. An element is moved upwards by a prespeci ed amount (step-size), e.g., one �, and the node weight is recalculated. If the current node weight is smaller than the previous one, then the element is moved by another step-size. This procedure continues until the node weight in the new position starts to increase. Then the next element is processed. Once all the non-critical elements are searched, the search is repeated. The optimal location for an element can not be found in one iteration. This is due to the fact that 10
the conditions under which an optimal location is found for an element may alter while processing its adjacent elements. It may take few iterations before nal optimal positions are found for all the elements. For example, the optimal location for element 18 in Figure 3a is 11� from the top edge in the rst iteration. The nal optimal location for this element is 6� from the top edge and is found in the fth iteration. The algorithm is shown in Figure 3.
2.3 Minimization of Open-Circuit Type Faults
The compaction algorithm presented in the previous section for yield optimization is mainly based on optimal distribution of spacing among non-critical elements without increasing their widths. Therefore, most of the yield enhancement is due to reduction in short-circuit type faults. In a similar way, further yield improvements can be achieved by modifying the width of some non-critical elements. Layout synthesis tools such as routers are designed to generate layouts with minimum width elements to minimize the area. (Special layout requirements of power and ground and other critical signals may be met by manual layout or special tools). By increasing the width of some non-critical elements, open-circuit type faults can be minimized without any area penalties. These width changes do not a�ect the performance, since the RC characteristics of the interconnecting wires remain almost the same. However, similar changes in the active logic, clock and other long global nets require careful analysis of performance characteristics. The possible increase in the width depends on the electrical characteristics of the layer. The width of the element is increased in such a way that the total average number of faults � as given in equation (3) is minimized. Each non-critical element is processed in a breadth rst order. First, the optimal width increase at the top edge is found and then at the lower edge. The algorithm is similar to the one presented in Subsection 2.2 and is omitted for the sake of brevity. The signi cant di�erence is that the optimal widths for the elements will be found in one iteration.
2.4 Examples
The results of the layout optimization are shown in Figures 3(b) and 4. The uncompacted layout of Figure 3 is a part of the layout generated by the router of MAGIC [31] layout editor from the netlist of example3b of [36]. The layout shown in Figure 3(a) is generated by the compactor PLOW [31] with automatic jog insertion, straightening and with minimum horizontal length of 12 �. The layout generated by our algorithm is shown in Figure 3(b). To characterize the impact of the layout optimization on manufacturing yield, the yield analysis tool Xlaser is used. Probability of failure versus defect size plots are shown in Figure 4 both for short-circuit faults and open-circuit faults of metal-1 layer. The 11
YKT-I YKT-II Layer Defect Simple Compaction for Simple Compaction for Type Compaction Yield Optim. Compaction Yield Optim. POF POF % Red. POF POF % Red. Metal-1 Shorts 0.003382 0.003103 8.25 0.004319 0.003964 8.22 Opens 0.010093 0.010133 -0.40 0.012352 0.012389 -0.30 Metal-2 Shorts Opens
0.000625 0.000595 0.002957 0.002818
4.80 4.70
0.001158 0.001159 0.004269 0.004266
-0.09 0.07
Poly
0.002786 0.002786 0.006000 0.006011
0.00 -0.18
0.002878 0.002871 0.005733 0.005721
0.24 0.21
Shorts Opens
Table 1: Yield analysis of industrial examples. probability of a short-circuit type failure in metal-1 layer of the original compacted layout is 0.0118. This failure probability is reduced by 21% to 0.00932. Since the area and the total number of defects remain the same, the average number of faults is reduced by 21% due to this layout optimization. The reduction in probability of open-circuit faults is only 4% since the widths of the elements are not altered. This marginal decrease is due to reduction in jog lengths. The optimized layout shown in Figure 3(b) is then processed for minimizing the defect sensitivity of the open-short faults and the results are shown in Figures 5 and 6. The layout shown in Figure 5(a) is optimized for a manufacturing environment where defect densities of both open- and short-circuit type are the same. Probability of failure versus defect size plots for both types of defects are shown in Figure 6. As expected, the probability of failure for short-circuit faults is increased by 7.4% and the probability for open-circuit faults is decreased by 21%. The overall decrease in the average number of faults is about 5% from the previous stage. The two stages of layout optimization for yield enhancement resulted in about 17% reduction in the number of faults in the metal-1 layer. Similar improvements are possible in the metal-2 layer as well. The same layout was optimized for conditions where the short-circuit type defect density is 10 times more than that of open-circuit type and it is shown in Figure 5(b). It is interesting to see the signi cant di�erences in the nal layout under these two di�erent manufacturing conditions.
2.5 Results 12
The yield enhancement algorithms proposed in this section have been implemented as an additional feature in IBM compactor [3]. Two large circuits were analyzed for yield improvements that can be achieved using these techniques. The layouts are scaled down to 0.5 micron technology. These designs consist of several thousands of active devices and two metal layers are used as interconnect layers. These layouts were rst compacted in the vertical direction without enabling yield optimization feature. The defect sensitivity (in terms of probability of failure) of each interconnect layer (including polysilicon) for openand short-circuit faults is measured using XLASER. In these two sample layouts, about 75% of the area is occupied by cells which consist of predominantly active regions. During compaction and yield optimization, layout patterns in these cells are not moved, however, cell as a unit can be moved. As a result, defect sensitivity of the layouts belong to active regions remains almost unchanged, except for boundaries. Therefore, the results of these layers are omitted. The defect size distribution model by Stapper and Ferris-Prabhu [33, 14] is used for yield optization as well as defect sensitivity measurements. We assume the following values for di�erent parameters of the model; xo = 0.5, p = 3.0, and q = 1.0. The average probability of failure for each interconnect layer is shown in the third and sixth columns of Table 1. Layout area of these two examples, after compaction, is 0.38 and 0.425 sq. mm. respectively. The layouts were then compacted by enabling yield enhancement option. The area of the layout remains unchanged during yield optimization phase. The probability of failure for each layer of these layouts is shown in the fourth and seventh columns. The percentage reduction in the pof is shown in the fth and eighth columns. In both these examples, the pof of metal-1 layer for short-circuit faults is reduced by 8.2%. The pof for opencircuit faults is reduced very marginally. In these examples the metal-1 layer consists of predominantly horizontal patterns and the metal-2 layer vertical patterns. Since the layouts were compacted in the vertical direction without auto-jogging, changes in the wire length of metal1 layer are minimal. Therefore, the percentage reduction in the pof is also negligible. We suspect that the small increase in the pof of open-circuit faults is due to the proximity e�ect [33]. In YKT-I, the pof for short- and open-circuit faults is reduced by 4.8 and 4.7%, respectively , in the metal-2 layer. However, in YKT-II, the reduction is negligible. In this example most of the metal-2 wires are bounded by contacts outside the boundary, hence, they don't have freedom to move. In both these examples, the pof reduction in the polysilicon layer is minimal because it is not used as interconnect layer except for few interconnects. The defect sensitivity improvement can be directly translated into yield improvement with 13
additional information on defect densities for short- and open-circuit faults, clustering factor data, etc. Our sample calculations show that an 8-10% improvement, in defect sensitivity on 2 or 3 interconnect layers on a chip of 1 sq. cm can result in a 5-10% improvement in chip yield.
3.0 Routing Strategies for Yield Enhancement
Since compaction is the last stage of the layout synthesis, its e�ectiveness is highly dependent on the quality of the layout synthesis of the previous stages. For example, the quality of the routers has a major impact on compaction. Therefore, further yield improvements can be achieved through new strategies for routing, layer assignment and alike.
3.1 Via and Wire Length Minimization
Most of the existing routers try to minimize the number of vias in the layout. Since the minimum width and spacing requirements for vias are larger than the wire segments, generally more compact designs are possible with fewer vias [5, 13]. Sometimes, just to avoid a via, routers may introduce very long wire segments, which certainly results in layers with higher critical areas [17]. On the contrary, in certain situations it may be worthwhile to introduce some vias (or leave some vias intact) to avoid unnecessary additional wiring. This situation is illustrated in Figure 7. By shifting a part of a horizontal segment of net-1 from track-5 to another free track (track-2), the total net length is reduced by 48% at the cost of one additional via. With a similar reassignment in net-2 from track-2 to track-7, the net length is reduced by half. The Ac of the metal-1 layer is reduced by 25% with these two modi cations. Analogous to minimum wire length requirements for introducing additional vias in the preferred layer maximization problem [9], some criteria to remove/add a via in terms of wire length/critical area must be introduced. For example, for the defect densities reported in [10], the fault probability of one metal-1/poly contact is equivalent to that of a poly wire segment of length 15 microns and width 1.5 microns. By adding a via, which can eliminate more than 15 microns of polysilicon, critical area/fault probability can be reduced. This additional criterion in routing, for the trade-o� between wire length and via, will result in layouts with better yield characteristics. In the routing techniques proposed in [30] only the adjacency information of horizontal tracks is considered as a criteria for defect sensitivity. Neither defect size distributions nor analytical models were used to characterize yield. Since the vertical layer is not considered, we have seen increase in the overall defect sensitivity in some of the examples generated by these routers. If the routing area is compacted, the spacing between horizontal tracks is 14
Examples Chan. # of # of Org. Routing in [36] Den. col. nets WL Vias ex1 12 35 21 310 57 ex3a 15 62 45 583 91 ex3b 17 61 47 818 107 ex3c 18 79 54 976 125 ex4b 17 119 54 1150 179 ex5 20 119 60 1309 150 Average Reducton
Opt. Routing WL Vias 222 36 511 59 736 78 832 92 1113 116 981 102
% Reduction Wl Vias 28.4 36.8 12.3 35.2 10.0 27.1 14.5 26.4 3.2 35.2 25.1 32.0 14.6 31.9
Table 2: Wire length and via reduction due to topological optimization in two-layer routing. changed by the compactor. Therefore, at the routing stage, if the vertical layer is targetted, better layouts can be generated. Since the compactors can not alter the topological order of the nets, defect sensitivity of the vertical layers can be reduced e�ciently during routing. Then the yield enhancement techniques presented in the previous section can be applied during compaction for further yield enhancement. We have formulated Wire length of the vertical layer in a two-layer routing as an Integer Linear Programming. To illustrate the wire length minimization, a simple example (example 1 of [36]) is shown in Figure 9. The original channel has 12 tracks and the total wire length of the vertical layer is 310 units. By reassigning the nets to di�erent tracks it has been reduced to 222 units resulting in a reduction of 28%. This reduction in wire length results in similar reductions in the defect sensitivity of open- and short-circuit type faults. Wire length minimization achieved in the examples given in [36] is shown in Table 2. The average wire length reduction in these benchmark examples is 14.6%. This can result in proportional improvements in defect sensitivity of the vertical layer. Due to this wire length reduction, the number of vias also reduced signi cantly (30%). In many examples, the via reduction results are better than the results reported by several via minimization algorithms [34]. This via reduction will further improve the defect sensitivity of the layouts. Yield improvement results of these examples due to wire length and via reduction have been reported in [8].
4.0 Topological Layout Design Techniques
During the last decade, many structured design techniques have been developed to minimize the design cycle time of VLSI systems. PLAs, gate arrays and standard cell designs are some of the popular design styles. Two-level PLA-based logic synthesis is well 15
developed and commercial automatic synthesis tools/silicon compilers are now available. One of the major drawbacks of these design styles, as of now, is the large area overhead (due to sparsity of the personality matrices of most designs) and the attendant yield and performance degradation. A variety of fault-tolerant techniques have been proposed for PLA-based designs in order to enhance yield [24] which involve a cost of additional area and design e�ort. Several optimization techniques have been proposed to minimize the area of PLAs at various stages of the design, starting from functional design to physical design. PLA folding techniques and the corresponding software tools have been developed to optimize the topological representation of PLAs [16, 18]. The primary objective of all these techniques is to reduce the area of the PLA. Signi cant yield enhancement can also be achieved by minimizing the defect sensitivity of the design that is already optimized for area. We have proposed a topological optimization technique for yield enhancement of PLA based designs in [7]. In our approach, the topological representation of the PLA is altered so that the critical area of the generated layout is minimized. This reduction in critical area is achieved primarily by minimizing the wire lengths in one or more layers of the layout. By modifying the topological representation of the PLA, wire length in the physical layout can be minimized without increasing the area, resulting in layers with reduced critical area. The amount of wire reduction in various layers depends on the folding level, technology and constraints imposed on the input/output positions, etc. For example, in simple column folding with constraints on the inputs, higher reduction in wire length is possible. We show the yield improvement and wire length reduction results achieved through topological optimization with the help of some MCNC benchmark PLA examples in the next section.
4.1 Examples and Results
The PLA example, misex1, consists of 8 input lines (16 lines with complements), 7 output lines and 12 product terms. Layout of this PLA is generated using OCT and MAGIC systems. The original symbolic representation of the circuit and the corresponding physical layout are shown in Figure 9A and Figure 10, respectively. The inputs run from both the top and bottom. The optimized symbolic layout is shown in Figure 9B. The wire length and the critical area of open- and short-circuit type faults of polysilicon layer are shown in Table 3. The performance of the modi ed layout has been veri ed using crystal. There is no change in the maximum delay of 1.93ns in the misex1 PLA circuit. The length of the input poly lines is reduced by permuting the product terms in row positions. This rearrangement of product terms does not have any negative impact on the performance. It may be even better due to the reduction in poly lines. The output lines in the OR plane (metal-1), which 16
Parameter
Original layout
Poly wire length 5.83mm Ac of short-ckt faults 144�m2 Ac of open-ckt faults 665�m2 Ac total 809�m2 Area 0.024mm2 Delay 1.93ns
After topological After physical Total optimization optimization reduction reduc. reduc. 4.73mm 19.0% | | 19.0% 2 2 129�m 10.4% 145�m -11.0% -0.7% 542�m2 18.5% 467�m2 13.8% 29.8% 671�m2 17.1% 612�m2 8.8% 24.4% 2 0.021mm 12.5% | | 12.5% 1.93ns | 1.93ns | |
Table 3: E�ect of topological optimization on the primary layer of Misex1 PLA. run from either top or bottom, can also be included in the objective function. Due to this optimization, 19% wire length reduction is achieved in the polysilicon layer of the AND plane. Consequently, the critical area of this layer is reduced by 17%. It is interesting to observe the incidental reduction in the wire length of the other layers, e.g., metal-1 and di�usion layers. The reduction in wire length of the individual layers may result in better compaction thereby reducing the overall area. In this example, the area is reduced by 12.5%. Therefore, the e�ective yield of the die also increases by approximately that percentage [6]. However, this much area reduction may not always be possible when performing yield optimization, if better folding tools are used [18]. In such a case, the percentage reduction in wire length and in the attendant critical area may be less. The reduction in the wire length of several layers facilitates the implementation of yield enhancement techniques during physical layout synthesis. After implementing these changes in the layout, the critical area is further reduced by 8.8%. Therefore, the overall reduction in the critical area is about 24% in the polysilicon layer and about 11% in metal-1 and di�usion layers. In larger chips, these reductions in the critical areas and the chip area result in about 15% improvement in the yield [6]. Results of wire length minimization on benchmark examples are shown in Table 4. The average wire length reduction is 15.4% for the non-folded PLAs and 10.9% for the columnfolded case. This wire length reduction can signi cantly improve the defect sensistivity of the corresponding layers of the circuits. Yield improvement results due to the topological optimization on larger PLAs have been presented in [7]. We illustrated the signi cance of topological optimization for yield enhancement in PLA-based designs. This new approach for yield enhancement has many attractive features 17
PLA Parameters Wire Length Circuit No Folding Column Folding Name I/P O/P Pterms Org Opt %Red. Org Opt %Red. bw 5 28 22 202 182 9.9 185 172 7.0 clip 9 5 118 1973 1590 19.4 1864 1551 16.8 con1 7 2 9 64 64 0.0 45 38 15.5 duke2 22 29 86 2608 2074 20.5 2146 1991 7.2 inc 7 9 30 334 292 12.6 341 287 15.8 misex1 8 7 12 120 114 5.0 115 96 16.5 misex2 25 18 28 527 486 7.8 585 542 7.4 sao2 10 4 58 983 864 12.1 949 831 12.4 table3 14 14 175 4842 3966 18.1 4464 3870 13.3 table5 17 15 158 4776 4169 12.7 4442 4191 5.7 vg2 25 8 110 3213 2814 12.4 3302 2853 13.6 Average Wire Length Reduction 15.4 10.9 Table 4: Input Wire Length Reduction due to Topological Optimization. compared to conventional methods. Yield enhancement in PLAs through redundancy and recon guration is proposed in [24]. In this approach, extra resources such as spares, testing, recon guration etc., require additional area up to 25%. Due to this additional area requirements, e�ective yield will go down beyond a certain optimal level of redundancy. In this approach, performance degradation is another concern. In the new approach proposed above, no additional resources are required to achieve the yield improvement. In majority of the cases it may even result in better performance due to reduction in wire length and overall area.
5.0 Conclusions
The most signi cant aspect of the proposed yield enhancement techniques is that no additional area is required. The yield enhancement can be realized almost at no additional cost except for marginal increase in computational time of the CAD tools. Another important aspect is that a layout can be optimized for given manufacturing conditions. Further yield improvements can be achieved by layer reassignment during routing and compaction stages of layout design. Incorporation of additional defect types for the yield criteria will improve the accuracy of yield estimation. The proposed layout design techniques for yield enhancement should supplement rather than replace the more traditional defect tolerance techniques. The complexity of 18
future products will be too high to achieve the yield targets with either of these two approaches alone. E�ectiveness of these two approaches is highly dependent on the design structure, complexity and the process yield. In very regular architectures, most notably memory units, defect tolerance techniques are expected to have a higher contribution towards yield improvement. As the design becomes less regular, the contribution of the layout techniques is expected to increase. The use of redundancy is especially bene cial for processes and circuits which have low yields. By using both these techniques the yield targets can be achieved with lesser area overheads.
References [1] G. A. Allan et al., \An Yield Improvement Technique for IC Layout Using Local Design Rules," IEEE Trans. Computer-Aided Design, Vol. 11, NO. 11, pp. 1355-1362, November 1992. [2] D. G. Boyer, \Symbolic Layout Compaction Review," Proc. of the 25th ACM/IEEE Design Automation Conf., 1988, pp. 383-389. [3] IBM Corporate Compactor User's Manual, Internal Document, IBM Corporation, NY. [4] J. L. Burns and R. Newton, \SPARCS: A New Constraint-Based IC Symbolic Layout Spacer," Proc. of the IEEE Custom Integrated Circuits Conf., pp. 534-539, 1986. [5] C. K. Cheng et al., \Geometric Compaction on Channel Routing," IEEE Trans. Computer-Aided Design, Vol. 11, NO. 1, pp. 115-127, January 1992. [6] V. K. R. Chiluvuri and I. Koren, \New Routing and Compaction Strategies for Yield Enhancement," IEEE Int. Workshop on Defect and Fault Tolerance in VLSI Systems, pp. 325-334, November 1992. [7] V. K. R. Chiluvuri and I. Koren, \Topological Optimization of PLAs for Yield Enhancement," IEEE Int. Workshop on Defect and Fault Tolerance in VLSI Systems, pp. 175-182, October 1993. [8] V. K. R. Chiluvuri and I. Koren, \A Wire Length Minimization Algorithm for Channel Routing," Technical Report TR-94-CSE-10, ECE Dept., University of Massachusetts, Amherst, 1994. [9] M. J. Ciesielski, \Layer Assignment for VLSI interconnect Delay Minimization," IEEE Trans. Computer-Aided Design, Vol. 8, NO. 6, pp. 702-707, June 1989. [10] R. S. Collica et al., \A Yield Enhancement Methodology for custom VLSI Manufacturing," Digital Technical Journal, Vol. 4, No. 2, pp. 83-99, Spring 1992 19
[11] J. A. Cunningham, \The Use and Evaluation of Yield Models in Integrated Circuit Manufacturing," IEEE Trans. on Semiconductor Manufacturing, Vol. 3, No. 2, pp. 6071, May 1990. [12] R. B. Fair, \Challenges to Manufacturing Submicron, Ultra-Large Scale Integrated Circuits," Proceedings of IEEE, Vol. 78, No. 11, pp. 1687-1705, November 1990. [13] S. C. Fang et al., \ Via Minimization with Associated Constraints in Three-Layer Routing Problem," Proc. of the Int. Symp. on Circuits and Systems, pp. 1632-1635, 1990. [14] A. V. Ferris-Prabhu, \Role of Defect Size Distribution in Yield Modeling," IEEE Trans. Electron Devices, Vol. ED-32, No. 9, pp. 1727-1736, September 1985. [15] J. P. Gyvez and Chennian Di, \IC Defect Sensitivity for Footprint-Type Spot Defects," IEEE Trans. Computer-Aided Design, Vol. 11, NO. 5, pp. 638-658, May 1992. [16] G. D. Hachtel, A. R. Newton and A. Sangiovanni-Vincentelli, \An Algorithm for Optimal PLA Folding," IEEE Trans. Computer-Aided Design, Vol. CAD-1, No. 2, pp. 63-76, April 1982. [17] S. Haruyama, D. F. Wong and D. S. Fussell, \Topological Channel Routing," IEEE Trans. Computer-Aided Design, Vol. 11, No. 10, pp. 1177-1197, October 1992. [18] S. Y. Hwang, R. W. Dutton and T. Blank, \A Best-First Search Algorithm for Optimal PLA Folding,"IEEE Trans. Computer-Aided Design, Vol. CAD-5, No. 3, pp. 433-442, July 1986. [19] I. Koren and C. H. Stapper, \Yield Models for Defect Tolerant VLSI Circuits: A Review," Defect and Fault Tolerance in VLSI Systems, Vol. 1, I. Koren (ed.), pp. 1-21, Plenum, 1989. [20] I. Koren, Z. Koren and C. H. Stapper, \A Uni ed Negative Binomial Distribution for Yield Analysis of Defect Tolerant Circuits," IEEE Trans. Computers, Vol. 42, No. 6, pp. 724-734, June 1993. [21] Z. Koren and I. Koren, \Does the Floorplan of a Chip A�ect its Yield?," IEEE Int. Workshop on Defect and Fault Tolerance in VLSI Systems, pp. 159-166, October 1993. [22] S. Y. Kuo, \YOR: A Yield-Optimizing Routing Algorithm by Minimizing Critical Areas and vias," IEEE Trans. Computer-Aided Design, Vol. 12, No. 9, pp. 1303-1311, September 1993. [23] T. Lengauer, Combinational Algorithms for Integrated Circuit Layout, John Wiley & Sons, England, 1990. [24] R. Leveugle, M. Soueidan and N. Wehn, \Defect Tolerance in a 16 Bit Microprocessor," Defect and Fault Tolerance in VLSI Systems, edited by I. Koren, Plenum Publishing Corporation, New York, 1990. 20
[25] M. Lorenzetti, \The E�ect of Channel Router Algorithms on Chip Yield," The MCNC Int. Workshop on Layout Synthesis, May 1990. [26] A. R. Dalal et al., \A Layout-Driven Yield Predictor and Fault Generator for VLSI," IEEE Trans. on Semiconductor Manufacturing, Vol. 6, No. 1, pp. 77-81, February 1993. [27] W. Maly, \Modeling of Lithography Related Yield Losses for CAD of VLSI Circuits," IEEE Trans. on Computer-Aided Design, Vol. CAD-4, No. 3, pp. 166-177, July 1985. [28] W. Maly, \Computer-Aided Design for VLSI Circuit Manufacturability," Proceedings of IEEE, Vol. 78, No. 2, pp. 356-392, February 1990. [29] \OCT Tools Reference Manual," M 2C CAD Tools Distribution, Release 6.0, 1990. [30] A. Pitaksanonkul et al., \DTR: A Defect-Tolerant Routing Algorithm," 26st IEEE Design Automation Conference, pp. 795-798, 1989. [31] J. K. Ousterhout et al., \Magic: A VLSI Layout System," 21st IEEE Design Automation Conference, 1984, pp. 152-159. [32] R. D. Rung,"Determining IC Layout Rules for Cost Minimization," IEEE J. Solid-State Circuits, Vol. SC-16,No. 1, pp. 35-42, February 1981. [33] C. H. Stapper, \Modeling of Defects in Integrated Circuit Photolithographic Patterns," IBM J. Res. Develop, Vol. 28, No. 4, pp. 461-474, July 1984. [34] K. The, D. F. Wong and J. Cong, \Via Minimization by Layout Modi cation," Proc. of the 26th ACM/IEEE Design Automation Conf., pp. 799-802, 1989. [35] H. Walker and S. W. Director, \VLASIC: A Catastrophic Fault Yield Simulator for Integrated Circuits," IEEE Trans. Computer-Aided Design, CAD-5, No. 4, pp. 541-556, October 1986. [36] T. Yoshimura and E. S. Kuh, \E�cient Algorithms for Channel Routing," IEEE Trans. Computer-Aided Design, Vol. 1, NO. 1, pp. 25-35, January 1982.
21