ORIGINAL ARTICLE – ADULT CARDIAC
Interactive CardioVascular and Thoracic Surgery 18 (2014) 38–42 doi:10.1093/icvts/ivt362 Advance Access publication 8 October 2013
Left ventricular mass regression after sutureless implantation of the Perceval S aortic valve bioprosthesis: preliminary results Giuseppe Santarpino*, Steffen Pfeiffer, Francesco Pollari, Giovanni Concistrè, Ferdinand Vogt and Theodor Fischlein Department of Cardiac Surgery, Klinikum Nürnberg, Nuremberg, Germany * Corresponding author. Department of Cardiac Surgery, Klinikum Nürnberg, Klinikum Süd, Breslauerstraße 201, 90471 Nuremberg, Germany. Tel: +49-911-3985441; fax: +49-911-3985443; e-mail:
[email protected] (G. Santarpino). Received 6 April 2013; received in revised form 10 July 2013; accepted 15 July 2013
Abstract OBJECTIVES: Left ventricular (LV) hypertrophy in aortic stenosis (AS) is considered a compensatory response helping maintain systolic function, but constitutes a risk factor for cardiac morbidity and mortality. The aim of this study was to assess the degree of LV mass regression after sutureless implantation of the Perceval S aortic valve bioprosthesis (Sorin Group, Saluggia, Italy). METHODS: Between March 2010 and July 2012, 78 patients with symptomatic AS underwent isolated aortic valve replacement (AVR) with the Perceval bioprosthesis. Mean age was 77.1 ± 5.3 years, 46 patients were female (59%) and mean logistic EuroSCORE was 11 ± 7.5%. Echocardiography was performed preoperatively, at discharge, and at follow-up (mean 13.5 ± 7.3 months). LV mass was calculated using the Devereux formula and indexed to body surface area. RESULTS: There was 1 in-hospital non-cardiac death and 3 late deaths. LV mass index decreased from 148.4 ± 46 g/m2 at baseline to 119.7 ± 38.5 g/m2 at follow-up (P = 0.002). No significant changes were observed in LV hypertrophy and/or relative wall thickness >0.42 as well as in LV ejection fraction. Mean aortic gradient decreased from 49.5 ± 15.8 mmHg at baseline to 11.6 ± 5.1 mmHg at discharge and 8.3 ± 4.4 mmHg at follow-up (P < 0.001), resulting in significant clinical improvement. No moderate or severe paravalvular leakage was observed at discharge and at follow-up. CONCLUSIONS: In AS patients, isolated AVR with the Perceval sutureless bioprosthesis is associated with significant LV mass regression at 1-year follow-up. However, longer-term follow-up is necessary to confirm these findings. Keywords: Aortic valve replacement • Echocardiography • Heart valve bioprosthesis • Left ventricle • Right ventricle
INTRODUCTION
MATERIALS AND METHODS
Left ventricular (LV) hypertrophy is a recognized risk factor for cardiac morbidity and mortality [1, 2]. Prognostic studies have given rise to the hypothesis that regression of LV hypertrophy is the underlying determinant of longevity after aortic valve replacement (AVR) for aortic stenosis (AS) [3–6]. Within 1 year of surgical AVR for AS, the decrease in LV afterload results in regression of LV mass in the majority of patients. However, in some patients, regression is incomplete [7, 8]. Sutureless aortic bioprosthesis implantation is a feasible alternative for high-risk patients with AS. Although the sutureless Perceval aortic valve bioprosthesis (Sorin Group, Saluggia, Italy) has been introduced only recently, several reports have shown promising results in terms of mortality, morbidity and haemodynamic performance [9–12]. However, the impact of sutureless bioprostheses on LV mass is unknown. Therefore, the aim of this study was to assess the degree of LV mass regression after sutureless implantation of the Perceval aortic valve bioprosthesis at 1-year echocardiographic follow-up.
Patients Between March 2010 and July 2012, 78 high-risk patients (mean age 77.1 ± 5.3 years, 46 females) with severe AS, with or without aortic regurgitation, without associated tricuspid and/or mitral valvulopathy and coronary artery disease, underwent isolated AVR with the Perceval sutureless valve at the Nuremberg Cardiac Surgery Department, Germany. Transthoracic echocardiography was performed at baseline, before discharge and at follow-up. The follow-up was complete and mean follow-up time was 13.5 ± 2.4 months. Data were obtained from interviews with surviving patients with regard to postoperative adverse events, current functional status and echocardiographic findings. Preoperative mean aortic valve pressure gradient was 51.3 ± 13.2 mmHg, and mean logistic EuroSCORE was 11 ± 7.5%. Baseline patient characteristics are listed in Table 1. Hypertension was defined if patients were on antihypertensive treatment preoperatively; patients were considered as having diabetes if they
© The Author 2013. Published by Oxford University Press on behalf of the European Association for Cardio-Thoracic Surgery. All rights reserved.
G. Santarpino et al. / Interactive CardioVascular and Thoracic Surgery
Number of patients Age (years) Female sex Body weight (kg) Body surface area (m2) Hypertension Diabetes mellitus Chronic renal failure Logistic EuroSCORE Canadian Cardiovascular Society class New York Heart Association class
Table 2: 78 77.1 ± 5.3 46 (59) 77.4 ± 14 1.85 ± 0.2 65 (83.3) 19 (24.3) 10 (12.8) 11 ± 7.5 1.4 ± 0.5 2.73 ± 0.6
Values are means ± SD or numbers (%).
were on oral hypoglycaemic or insulin therapy and renal failure was defined as a reduction in glomerular filtration rate of ≤59 ml/min.
Technology and surgery The Perceval S aortic valve bioprosthesis requires preoperative transthoracic and transoesophageal echocardiography to assess the anatomical characteristics of the aortic root. Implantation is not recommended for bicuspid valves with asymmetrical sinuses of Valsalva, or in the presence of enlarged aortic roots, and available sizes are suitable for an aortic annulus diameter up to 27 mm. Patients undergoing minimally invasive surgery also need intraoperative monitoring with transoesophageal echocardiography for the management of cardiopulmonary bypass and evaluation of the prosthetic valve. Under general anaesthesia and orotracheal intubation, all patients undergoing AVR with no previous cardiac surgery or not suitable for right anterior thoracotomy were placed on cardiopulmonary bypass after partial ‘J’ sternotomy at the third/fourth intercostal space (evaluated with chest X-ray in the presurgical screening) and minimal cutaneous incision (8–10 cm) [11]. Cardiopulmonary bypass was established using a straight arterial cannula in the ascending aorta, and a two-stage venous cannula in the right atrial appendage (when possible) or femoral vein. All procedures were performed during aortic cross-clamping with a DeBakey, or flexible or Glauber clamp and continuous infusion of cardioplegia (warm cardioplegia, Calafiore protocol), administered via either the antegrade or retrograde route through the coronary sinus. If a second infusion of cardioplegia was necessary, it was delivered retrogradely with direct control on the coronary ostia of the correct retrograde flux to minimize cross-clamp time. In case of lack of retrograde flux from the coronary ostia, direct cannulation of the coronary ostia was performed with antegrade cardioplegia infusion. Transverse aortotomy was located at a higher level than usual, 2 mm above the sino-tubular junction. After aortic valve exposure through the positioning of three commissural sutures, the stenotic valve was completely removed, and the annulus was mildly decalcified and sized with calibrated valve sizers to select the appropriate prosthesis diameter. We evaluated any resistance of the valve sizer through the aortic annulus into the left ventricle. The prosthesis was mounted on a holder with a specific collapser suitable for the diameter of the prosthesis. The implantation was performed through the initial positioning of
Intraoperative data
Valve size S (21 mm) M (23 mm) L (25 mm) XL (27 mm) Surgical approach Sternotomy Ministernotomy Right anterior minithoracotomy Aortic cross clamp time (min) Cardiopulmonary bypass time (min)
6 33 37 2 12 (15.4) 63 (80.8) 3 (3.8) 38.3 ± 12.6 68.2 ± 19.4
Values are means ± SD or numbers (%).
three intra-annular and middle-commissural 4/0 polypropylene sutures. The intra-annular sutures were tied to the valve struts to allow proper valve positioning within the aortic annulus. After release of the prosthesis from the holder, the polypropylene guiding sutures were removed. Then a balloon was inserted into the valve and expanded for 30 s at a pressure of 4 atm—as recommended by the manufacturer. The valve was maintained in a continuous flux of sterile water at 37°C to allow extension and intra-aortic wall fixing of the nitinol stent. The surgical procedure was completed with closure of the transverse aortotomy. Transoesophageal echocardiography was performed during the procedure to assess the correct positioning and functioning of the prosthesis. A standard median sternotomy was performed in 12 redo patients (first operation was AVR in 5 and coronary artery bypass surgery in 7 patients). A right anterior minithoracotomy (n = 3) approach was used if right position of the aorta was documented by computed tomography scan [13]. Intraoperative data are reported in Table 2.
Transthoracic echocardiography Echocardiographic studies were performed by an experienced cardiologist and analysed by an independent echocardiographic Core-Lab (Medstar Research Washington, DC, USA). LV dimensions were obtained from the parasternal long-axis view, with measurement of end-diastolic interventricular septum thickness, LV posterior wall thickness and LV end-diastolic and end-systolic internal diameters just below the tips of the anterior mitral leaflet. LV mass was calculated using the Devereux formula [14] and indexed to body surface area [LV mass index (LVMI)]. LV hypertrophy was defined as LVMI >115 g/m2 for males and >95 g/m2 for females. Relative wall thickness (RWT) was calculated by RWT = 2 × (LV posterior wall thickness)/(LV end-diastolic diameter) and considered abnormal when RWT was >0.42 [15]. RWT and LVMI were used to assess LV geometry. Patients were categorized as having the following: normal geometry (normal RWT–normal LVMI); concentric remodelling (increased RWT– normal LVMI); eccentric hypertrophy (normal RWT–increased LVMI) and concentric hypertrophy (increased RWT–increased LVMI). LV end-diastolic and end-systolic volumes were obtained from the apical view and indexed to body surface area. LV ejection fraction was calculated using the biplane modified Simpson rule. Peak
ORIGINAL ARTICLE
Table 1: Baseline patient characteristics
39
40
G. Santarpino et al. / Interactive CardioVascular and Thoracic Surgery
transaortic velocity and mean gradient were measured using continuous-wave Doppler through the native or prosthetic aortic valve. The Doppler signal was acquired from multiple views after achieving optimal alignment with the direction of transaortic blood flow.
Statistical analysis Statistical analysis was performed with the SPSS 17.0 statistical software (SPSS, Inc., Chicago, IL, USA). Continuous and categorical variables are presented as mean [standard deviation (±SD)] and as number (with percentage), respectively. In order to assess differences between baseline, discharge and follow-up for continuous variables, a one-way analysis of variance for repeated measurements was used to compare the three different time points, followed by a post hoc Bonferroni method of multiple comparisons. The same strategy was used for ordinal variables, assuming a constant difference between values. If variables were not normally distributed, differences were assessed using nonparametric tests for three related samples (Friedman test). For comparisons between two time points, a paired sample t-test or a Wilcoxon signed-rank test was used for normally distributed and skewed data, respectively. A two-sided P-value of 0.42 did not change significantly. After sutureless implantation of the bioprosthesis, concentric remodelling, concentric and eccentric LV hypertrophy did not change during the follow-up. A subgroup analysis was performed comparing patients with (n = 19) and those without diabetes (n = 59) to evaluate LVMI regression. In both groups, a marked reduction in LVMI from baseline to followup was observed (from 155.3 ± 52 to 123 ± 44.2 g/m2 and from 146.2 ± 36 g/m2 to 117.6 ± 41.5 g/m2 in diabetic and non-diabetic patients, respectively). No statistically significant difference between groups was reported (P = 0.455). Another subgroup analysis was performed to evaluate the evolution of LV hypertrophy in patients with more severe symptoms at baseline [Canadian Cardiovascular Society (CCS) class ≥2, n = 13] compared with the other subjects (CCS class 1, n = 65). A greater, though not statistically significant, reduction in LVMI was observed at follow-up in
Table 3: Left ventricular echocardiographic data Variables
LV dimensions Interventricular septum (mm) Posterior wall (mm) LVEDD (mm) LVESD (mm) LVEDVI (cm3/m2) LVESVI (cm3/m2) LVM (g) LVMI (g/m2) LV hypertrophya RWTb RWT >0.42 LV geometry Normal geometry Concentric remodeling Eccentric hypertrophy Concentric hypertrophy LV function Ejection fraction
Baseline (n = 78)
Discharge (n = 77)
Follow-up (n = 74)
13.9 ± 2.3
13.7 ± 2.9
12.1 ± 1.6 49.8 ± 8.7 33.1 ± 8.5 121.6 ± 46.0 50.5 ± 24.6 274.5 ± 85.2 148.4 ± 46 62 (79.5) 0.49 ± 0.1 57 (73.1)
P-value Baseline vs discharge
Discharge vs follow-up
Baseline vs follow-up
12.1 ± 2.8
0.06
0.02
0.02
11.8 ± 1.7 49.5 ± 8.5 33.7 ± 8.8 131 ± 50 57.1 ± 25 260.7 ± 90 140.9 ± 48.6 61 (79.2) 0.45 ± 0.1 49 (63.6)
11.3 ± 1.3 48 ± 10 34 ± 9.8 135 ± 50 59 ± 26 221.4 ± 71.3 119.7 ± 38.5 47 (63.5) 0.43 ± 0.08 39 (52.7)
0.04 0.31 0.45 0.14 0.01 0.59 0.44 NS 0.12 0.24
0.32 0.9 0.67 0.01 0.02 0.008 0.04 0.09 0.19 0.34
0.04 0.67 0.04 0.02 0.04 0.001 0.002 0.09 0.012 0.06
8 (11) 12 (15) 16 (20) 42 (54)
11 (14) 4 (5) 16 (21) 46 (60)
12 (16) 15 (20) 24 (33) 23 (31)
0.29 0.29 NS 0.29
NS 0.1 0.30 0.06
0.29 0.18 0.30 0.19
0.58 ± 0.44
0.56 ± 0.64
0.57 ± 0.43
0.78
0.63
0.55
Values are means ± SD or numbers (%). LV: left ventricular; LVEDD: left ventricular end-diastolic diameter; LVEDVI: left ventricular end-diastolic volume index; LVESD: left ventricular end-systolic diameter; LVESVI: left ventricular end-systolic volume index; LVM: left ventricular mass; LVMI: left ventricular mass index; RWT: relative wall thickness; NS: not significant. a LV hypertrophy: LVMI males >115 g/m2, females >95 g/m2. b RWT: 2 × (posterior wall thickness)/(LVEDD).
patients with CCS class 1 compared with patients in CCS class ≥2 (from 150 ± 50 to 121 ± 40.2 g/m2 and from 159.8 ± 46 to 144.1 ± 48.5 g/m2, respectively; P = 0.09). LV systolic function did not change significantly. However, a significant clinical improvement was observed in the majority of patients during follow-up: NYHA class improved from 2.9 ± 0.5 to 1.2 ± 0.5 (P < 0.001), and no major cerebral and cardiovascular events were reported. Mean pressure gradient decreased significantly from 49.5 ± 15.8 mmHg preoperatively to 8.3 ± 4.4 mmHg at follow-up (P < 0.001). At discharge, mild intravalvular leakage occurred in 2 patients (2.6%), persisting in 1 patient at follow-up (Table 4).
DISCUSSION This study shows a significant regression of LV mass at follow-up (mean 13.5 months) after sutureless bioprosthesis implantation in 78 patients undergoing isolated AVR. The good results obtained regarding mortality, morbidity and haemodynamic performance are consistent with several previous reports [9–12], but the impact of sutureless bioprostheses on LV mass has never been analysed. Aortic valve disease is associated with substantial haemodynamic stress on the left ventricle in terms of pressure and volume overload [16]. In such circumstances, the left ventricle hypertrophies to normalize systolic wall stress, and dilates in response to diastolic stress. AVR results in improved haemodynamics as the stenotic or
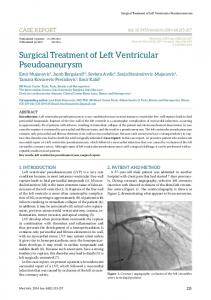
Figure 1: Changes in left ventricular (LV) mass between baseline, discharge and follow-up.
41
regurgitant valve is replaced with a prosthetic valve with a relatively stenotic orifice. The compensatory response to volume and pressure overload develops over a prolonged period, which may last years or even decades as the body grows and the disease progresses. The rate and extent of postoperative regression of the patterns of hypertrophy and dilatation seen with these disorders have not been defined. LV mass regression after AVR is a prolonged process, with major changes in the intermediate postoperative period, and further changes occurring later after LV load reduction [7]. In our experience with sutureless AVR, the results at follow-up seem to be encouraging with a decrease in mean LVMI from 148.4 ± 46 g/m2 at baseline to 119.7 ± 38.5 g/m2 at follow-up (P = 0.002). The limited follow-up period may account for the incomplete LV mass regression. In addition, due to their advanced age, it is likely that patients have been exposed to the adverse effects of severe AS for many years, suffering from long-standing LV hypertrophy, which eventually becomes irreversible due to myocardial fibrosis [17, 18]. Moreover, 83.3% of patients had a history of hypertension. Despite optimal medical treatment, reduced systemic arterial compliance may have contributed to incomplete LV mass regression [19]. Finally, genetic factors may have played a role [20]. A significant reduction in LV mass was also evidenced by Kennedy et al. [21], but 1.5 years postoperatively, patients with aortic valve disease showed persistent LV hypertrophy compared with control subjects. In the study of Monrad et al. [7], regression of myocardial hypertrophy was accompanied by a significant reduction in the pattern of concentric hypertrophy, but this pattern persisted even 9 years postoperatively. In the study of Duncan et al. [22], regression of myocardial hypertrophy was mainly attributable to a reduction in wall thickness rather than a reduction in chamber dimensions, suggesting a concentric pattern of LV hypertrophy. Although concentric anatomy is a risk factor for mortality in patients with severe AS, our study was underpowered to detect its prognostic impact on 1-year mortality. These changes in myocardial mass and configuration were associated with remarkable improvements in resting haemodynamics and clinical status at follow-up (NYHA class improved from 2.9 ± 0.5 to 1.2 ± 0.5; P < 0.001). Although the pacemaker implantation rate was relatively high in our study, it should be noted that in several patients this complication was related to preoperative risk factors (e.g. rhythm conduction disorders, diffuse subcritical coronary artery disease). Moreover, the Perceval S aortic valve has been designed to minimize protrusion into the LV outflow tract, and thus, it is expected that the prosthesis will not interfere with the atrioventricular conduction system. The use of the sutureless Perceval S aortic valve bioprosthesis represents an innovative approach for surgical AVR, enabling
Table 4: Aortic valve echocardiographic data and clinical status Variables
Mean aortic gradient (mmHg) Paravalvular leakage Intravalvular leakage NYHA class (1–4)
Baseline
49.5 ± 15.8
Values are means ± SD or numbers. NYHA: New York Heart Association.
2.9 ± 0.5
Discharge
11.6 ± 5.1 0 2
Follow-up
8.3 ± 4.4 0 1 1.2 ± 0.5
P-value Baseline vs discharge
Discharge vs follow-up
Baseline vs follow-up