interactivity. The BBC Big Screens is a good example of a ... locations around the UK. The research .... runtime service discovery, user authentication and hosting of application ... and leisure services (web pages), which can reside on any web server in .... hotspot dedicated for testing each software update before they are ...
Lessons Learned from the Deployment and Maintenance of UBI-hotspots Tommi Heikkinen, Tomas Lindén, Timo Ojala, Hannu Kukka, Marko Jurmu and Simo Hosio MediaTeam Oulu, Department of Electrical and Information Engineering University of Oulu, Finland {tommihe, tomasl, skidi, hkukka, mjurmu, zion}@ee.oulu.fi Abstract—We provide an experience report of the deployment and maintenance of urban computing infrastructure called UBI-hotspot. It is effectively a large interactive public display embedded with other computing resources such as access points of different wireless networks. We have installed a network of 12 UBI-hotspots in key indoor and outdoor locations around downtown Oulu, Finland. We describe the remote monitoring and management tools we have adopted for the maintenance of the UBI-hotspots. We conclude with a discussion on our lessons learned which should be valuable for other researchers planning similar deployments in public urban spaces. Ubiquitous computing; urban computing; interactive public display; remote monitoring; remote management; availability
I.
INTRODUCTION
Large digital displays are becoming an integral part of public urban spaces thanks to their powerful visual capacity. The digital signage industry is busy populating streets, shopping centers, airports, buses and bus stops with displays for the purpose of commercial broadcast, with no or limited interactivity. The BBC Big Screens is a good example of a large-scale commercial deployment of giant public displays with rudimentary interaction with the audience in 21 locations around the UK. The research community has been actively exploring opportunities for enriching the interactivity of public displays via different interaction modalities such as touch screens and mobile devices. A number of research projects have studied the challenges related to large public displays with laboratory and semi-public campus prototypes. For example, the eCampus project deployed a network of interactive public displays on the Lancaster University campus [1]. Similarly, the iDisplays project has deployed situated displays on the University of Münster campus [2]. However, while laboratory and campus prototypes may be sufficient for research purposes, the vision of ubiquitous computing is not truly realized without deployment and evaluation in an authentic setting as promoted in [3-6]. In this paper we provide an experience report on the deployment and management of so-called UBI-hotspots (later hotspot, Fig. 1). In our long-term vision the urban space is populated with hotspots, which provide rich interaction between the physical, virtual and social spaces. We do not offer our hotspots as solutions to specific (research) problems at downtown Oulu, which undoubtedly would survive just fine without the hotspots. Instead, we
promote our hotspots as ‘heavyweight’ urban probes [9] and research enablers. The hotspots facilitate longitudinal, realworld case studies of system usage in authentic urban setting with real users and with sufficient scale and time span. Such studies are important because real-world ubiquitous computing systems are culturally situated, which cannot be reliably assessed with lab studies detached from the realworld context. Infrastructure and time are needed to establish the required technical and cultural readiness and the critical mass of users, before a ubiquitous computing system can be evaluated ‘(un)successful’ [8]. Our hotspot is effectively a large public display embedded with other co-located computing resources such as access points of three different wireless networks. A hotspot offers various information and leisure services via different interaction modalities including mobile. We have deployed a network of 12 hotspots in pivotal indoor and outdoor locations around downtown Oulu, Finland. The hotspots are not off-the-shelf products but unique customized versions of a commercial DID (Digital Information Display) product. The hotspots are subjected to constant evaluation in authentic environment via 24/7 exposure and availability to the general public. In the current lifecycle model the hotspots are expected to stay functional till October 2016 so that their operational expenses are covered by the profits generated by the hotspots.
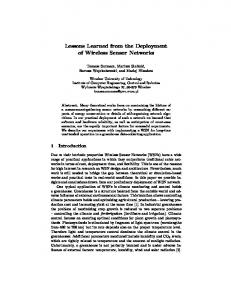
Figure 1. An outdoor UBI-hotspot in the main square of Oulu.
After describing the hardware and software components of a hotspot, we report how we employ existing open source
monitoring and management tools to manage the hotspots. We focus especially on the challenges the public space, the targeted 24/7 availability and the current lifecycle model have imposed on the deployment and maintenance of the hotspots. While doing that, we revisit some of the 13 lessons Storz et al. [1] reported from the deployment of three experimental display systems in their eCampus project. We conclude the paper with a discussion on the lessons we have learned so far. II.
configuration of the system [7]. The Layout Manager controls the actual layout of the screen rendered by the Browser in full screen mode which is partitioned into virtual screens assigned to different web applications identified by their URLs [10]. The control server is responsible for runtime service discovery, user authentication and hosting of application metadata.
Cameras
UBI-HOTSPOT
A. Hardware The hotspot is a customized version of the Icon57 DID product manufactured by Symbicon Ltd. The customization included both the desired visual appearance and equipping the DID with additional hardware components. A key component of the hotspot is the 57” landscape TFT LCD panel with full HD resolution. The landscape orientation was chosen to facilitate touch screen based interaction with the whole panel. The panel is protected against vandalism by a 6 mm hardened safety glass. Behind the glass is a projected capacitive touch screen foil. The panel is controlled by an industrial grade quad core PC equipped with 4 GB of RAM. Persistent local data storage is provided by 500 GB RAID1 disk. A loudspeaker is implemented by a transducer that transforms the front cover to a loudspeaker. A NFC/RFID reader is attached behind a plastic window in the front of the case and two cameras are integrated to the top frame of the case. A Bluetooth access point, a WLAN access point and a WSN access point are placed inside the DID case, and their antennas are integrated into the roof of the casing (Fig. 2). The hotspot comes in two different versions for outdoor and indoor use. While the indoor version is one-sided with one LCD panel, the outdoor version is two-sided with two LCD panels back-to-back and separate control PC’s for each panel. The LCD panels are confined in a weatherproof aluminum casing with heating and cooling systems. The indoor version has IP30 enclosure rating and the additional components are installed inside the pedestal (Fig. 2). The outdoor version has IP65 enclosure rating and the additional components are placed inside a weatherproof equipment box installed inside the pedestal. B. Software The conceptual software architecture of the hotspot and related components is illustrated in Fig. 3. The underlying operating system (OS) is Windows Embedded POSReady, which is based on Windows XP Pro SP3. POSReady is optimized for full-featured retail POS devices and kiosks, to seamlessly connect point-of-service solutions with peripherals, servers and services. At this point it is noteworthy to point out that this OS does not support multiuser mode, which has its implications on the maintenance. The Resource Manager controls the temporal and spatial allocation of the screen estate of the LCD panel between competing applications. It receives events from different context wrappers and instructs the Layout Manager according to the management policies set forth in the
57" Full HD LCD panel 6 mm safety glass with capacitive touch screen foil panOULU WLAN AP panOULU WSN AP Control PC panOULU BT AP
NFC/RFID reader Loudspeaker
500 GB RAID 1 disk
Figure 2. The internal structure of an indoor UBI-hotspot.
In the current interaction model the hotspot alternates between a passive broadcast mode and an interactive mode. The transition to the interactive mode is triggered by the following events produced by the context wrappers: a user touches the touch screen, user present an RFID tag to the RFID reader, or a face is detected from the video feed of the two overhead cameras. The end of the interaction is determined with a timeout since the last interaction event, after which the hotspot returns to the broadcast mode. We refer to these interaction periods commonly as sessions. In the broadcast mode the whole screen constitutes a single virtual screen allocated to a digital signage service called UBI-channel. A local player repeats a playlist, which is generated and uploaded to the hotspot together with the actual media files by an external digital signage server. The playlist is configurable on per hotspot basis. In the transition to the interactive mode the UBI-channel is smoothly squeezed into the upper left hand part of the screen and two additional virtual screens are created, one assigned for a touch screen portal called UBI-portal and another assigned for mobile services [11]. The UBI-portal is effectively a web portal of various information and leisure services (web pages), which can reside on any web server in
the public Internet. The default view of the UBI-portal can be configured on per hotspot basis. [12]
EXTERNAL 3RD PARTY SERVICES Application Application Application server Server Server
UBI-portal
Layout Manager Web Server
Resource Manager
Context wrappers Face detector
RFID reader Java Virtual Machine
Browser
Touch screen
Windows Embedded POSReady
Happy Page server
Nagios server
UBI-HOTSPOT
UBI-channel player
UBIchannel server
Control server
VNC RDC
SYSADM MANAGEMENT Figure 3. The conceptual software architecture of our installation.
III.
DEPLOYMENT
A. Urban planning Hotspots are a visible and functional change to the urban space in small scale. Therefore, the design of their visual appearance and locations was of great importance in many respects. For example, the design was subject to formal approval by the City’s cityscape committee, a group of architects, who preview all installations with impact on the cityscape. Further, we had to obtain an installation permit for each hotspot from the City’s Chief Engineer, which covered issues such as public safety and the availability of electricity and fiber optic cable conduits in the desired locations. The design of the visual appearance of a hotspot was guided by a number of external requirements. The most fundamental was the range of available suitable devices from the vendor winning the contract via public tender. While an
indoor hotspot was going to be one-sided allowing placement against walls, the City required an outdoor hotspot to be two-sided so that no ‘dead’ backside surfaces would be created. The City also imposed on the hotspot its directions regarding the colors of outdoor furniture in the city center. A 3-D virtual model of the hotspot was created for communicating its appearance to different stakeholders. The design of the locations of the hotspots was a rather complicated process with a large number of external requirements such as the visibility and accessibility of the hotspot, vehicular and pedestrian flows, lighting (both ambient lighting and the light pollution caused by the hotspot itself), public safety, street maintenance, availability of electricity and fiber conduits under the street level, and the many other uses of the urban space (e.g. benches, flower basins, restaurant patios, and ice-cream kiosks). First, a large number of candidate indoor and outdoor locations were identified around the City by observing the pedestrian flows. Then the final locations were selected together with the City administration. Photorealistic illustrations of each hotspot were prepared for the permit process and communication with different stakeholders. B. Installation of hotspots We installed 11 hotspots, six outdoors and five indoors, between May 28 and July 1, 2009. The sixth indoor hotspot was installed at the beginning of November 2009. While the portable indoor displays required only cabling for electricity and Internet connection, the installation of fixed outdoor displays was a much more complex process. First, the cobblestone pavement was temporarily removed from all areas subject to excavation. Then, a local ISP installed a fiber optic cable and a local energy company a power cable. A concrete base weighing 1.8 tons was installed below the street level to provide sufficiently sturdy structure with respect to wind load. The base was equipped with eight thread bar anchors, to which the DID vendor fastened the hotspot. Once the fiber optic and power cables were connected by the respective contractors, the hotspot was ready for software installation. As the final step the pavement was restored. C. Lifecycle model All infrastructure deployments are subject to study of their financial sustainability. Many academic infrastructure deployments have fallen apart, because they did not have any long-term financial basis for covering operational expenses and renewal of the infrastructure. While public sources (ERDF, City of Oulu) have covered the capital expenditure of the hotspots, we do not have public funding for their operational expenses or renewal. The conditions of our ERDF funding state that the infrastructure has to remain functional five years after the completion of the project, which in our case translates to October 2016, about seven years from now. For example, the manufacturer gives the LCD panels an expected lifetime of 50000 hours, i.e. 5.7 years with 24/7 use. The operational expenses of the 100 Mbps Internet connection, electricity, daily cleaning and insurance total
roughly 500 eur per hotspot in a month at the moment. To cover them we are selling a portion of the capacity of the UBI-channel for commercial digital signage with 3-4 month long contracts sold via public tenders. This commercial dimension by default reduces our freedom in changing the fundamental system functionality. IV.
MAINTENANCE
A. Conventions The hardware maintenance is divided between the vendor and us so that the vendor is responsible for all components inside the IP-rated enclosure while we take care of the additional components placed inside the pedestal. To extend the lifetime of the LCD panels and to decrease the night time lighting pollution created by the hotspots, the panels are configured to go into power save mode between 1am and 7am. However, a panel is turned on if an interactive session is initiated e.g. via somebody touching the screen. The hotspots are configured to come up automatically after a boot and to reboot themselves every morning just before 7am. We have contracted a cleaning company to clean the panels in outdoor hotspots every day, as a dirty panel would not invite people to touch it. The panels of indoor hotspots are cleaned by the respective locations. The software is installed as a complete image created with the Acronis True Image software. The image-based software installation allows fast system setup and eliminates human errors in comparison to sequential installation of a number of individual software components. Any hotspot specific configurations are made separately after the installation of the image. An obvious limitation of this approach is that a particular image works only with a particular hardware configuration. As our hotspots have identical hardware, this has not yet become an issue. However, we foresee deployments where it would be advantageous to have more flexibility in this respect. To prevent uncontrolled evolution of the software, all automatic software updates are disabled. The obvious tradeoff is the risk of falling behind with critical security patches. We have in our lab an exact replica of an indoor hotspot dedicated for testing each software update before they are propagated to the hotspots at downtown (a lesson from [1]). An important real-life fact in our case is that the university campus and thus our lab are located about 5 km from downtown Oulu and the hotspots. This makes each maintenance visit to the hotspots very expensive. Therefore, we have actively deployed and developed tools for remote monitoring and management of the hotspots.
components. It supports also automatic notifications of service or host problems which can be resolved via customizable methods. We have deployed a Nagios server to monitor the hotspots. Nagios works well in detecting that something has truly failed, e.g. a hotspot has shut down completely or a specific component has not sent a heartbeat. However, as failures of this magnitude are rare, sysadmins tend to pay less attention to Nagios over time. In case of grave problems, “the voice from the streets” typically reached us before anyone detected the problem via Nagios. Further, while Nagios provides ample amounts of monitoring information on individual components, according to our experience the information does not necessarily allow establishing a comprehensive picture of the actual state of a hotspot. For example, Nagios is not really able to detect situations where our web-based user interface is in a faulty state. Nagios supports arbitrary custom tests to be integrated into monitoring, but it is hard to know beforehand what could go wrong. Storz et al. [1] came to a similar conclusion that monitoring the state of individual distributed components might not be enough to tell that the ubiquitous computing system is fully functional as a whole. The component level monitoring is probably better suited for server clusters than public displays with interactive elements. However, Nagios has still a valuable role in detecting performance shortcomings in component and system level, e.g. memory leaks. 2) “Happy page” To address the monitoring of the user interface of a distributed ubiquitous computing system, Storz et al. [1] promoted the idea of “See what the public sees”, e.g. by pointing a camera towards the displays. As deploying additional cameras would not have been feasible in our case, we implemented this functionality by configuring each hotspot to store periodic screen captures on their local web server. The “Happy page” server fetches the images from the hotspots and renders them as a collage on a web page (Fig. 4). We call this page “Happy page” as with just a quick glance the system administrator can obtain a comprehensive overview of all 18 panels in the hotspots, i.e. to see if the system is indeed happy.
B. Remote monitoring tools 1) Nagios Nagios is a popular open source computer and network monitoring software. It allows remote monitoring of multiple computers simultaneously, reporting important metrics such as CPU load, memory usage, and network services. It can be extended to monitor custom metrics from various
Figure 4. “Happy page”, a collage of screenshots of hotspots.
We display the “Happy page” on one of our large displays in the lab to allow people to observe quickly the current state of the hotspots as they walk by. In addition, the “Happy page” is browsable anywhere from the Internet. The information provided in a single screenshot is surprisingly rich as it effectively reveals the current visual state of the user interface of a hotspot. The “Happy page” scales to a large number of monitored hotspots, though obviously only so many screenshots can be squeezed onto a single page. Monitoring of the visual state of the hotspots with the “Happy page” has proven very useful for us. However, a particular visual state does not necessarily guarantee that the overall state of the hotspots is indeed valid. For example, we have had situations where the external UBI-channel server had uploaded wrong spots to the hotspots due to a fault. Further, a (partially) unresponsive touch screen would not be detected via visual monitoring, either. C. Remote management tools After a fault has been detected and diagnosed, it has to be addressed. A fault might be local in a particular hotspot, while a fault in a centralized resource could affect all the hotspots simultaneously. The most expensive maintenance task is a visit to the hotspots. In addition to the 5 km travel, a hotspot needs to be dismantled to a certain degree for access to the physical interfaces of the control PC. It is a time consuming task especially with the outdoor hotspots, since the cover is attached by throughout-bolt coupling. Therefore, it is important that the hotspots can be maintained remotely. Our single user OS is not ideal from remote management point of view, since it is primarily meant for a desktop usage and does not allow another users to login simultaneously. This effectively leaves two choices: 1. local user session is cancelled during remote maintenance, or 2. remote maintenance shares the session with the local user. 1) RDC (Remote Desktop Connection) The POSReady OS comes with a native RDC support that provides full access to a remote computer like it was local. While the remote session is on, the local session is logged off. This is both a disadvantage and an advantage. A clear disadvantage is that the hotspot is not usable during a remote maintenance session. Further, it is relatively difficult to get the hotspot back into the normal operational mode after a maintenance session. Our workaround is to force a system reboot after the maintenance is done. Logging out the local user is beneficial in case we do not want the users to see what is happening during the maintenance session. 2) VNC (Virtual Network Computing) VNC allows sharing of the graphical desktop utilizing OS independent RFB protocol. We chose to use Tight VNC, which comprises of a VNC server and a VNC viewer client. The VNC server also supports an Applet client that allows maintenance by any browser supporting Java. Tight VNC supports also file transfers between the managing and managed computers. We use VNC mainly for remote maintenance, but it also has a role in monitoring for two reasons. First, it allows a shared session with the monitored
computer, i.e. the local user session is not logged out during the remote connection. Second, VNC supports a view only mode, where we can monitor a panel without intervening with any ongoing user sessions. In practice we open a VNC connection first in the view only mode and after detecting that nobody is using the hotspot we take control over the hotspot. In the maintenance mode anyone looking at the hotspot can see everything done during the maintenance. Thankfully, local inputs can be disabled in the maintenance mode. VNC is best suited for quick fixes such as refreshing the Browser if it has somehow ended up in a faulty state, for example. 3) Remote Control Card The hotspot comes with an integrated remote control card that allows access to low level functions such as forcing a shutdown or reboot of a halted system, disabling the screen backlight, disabling the touch screen, etc. These functions are available for the onboard PC in the hotspots and for remote clients via a web interface provided by the card. However, we have not yet taken these cards into everyday use due to a security hole of the web interface not having any user authentication. D. Evolution of hotspot availability We have been systematically collecting data on the usage of hotspots since July 17, 2009. This is done by logging each relevant event in the Resource Manager and the Layout Manager. On average the indoor hotspots have ~50 sessions per day, while both panels of the double-sided outdoor hotspots have ~60 sessions per day. We first define a rather crude and somewhat optimistic measure of system availability. A panel is considered to have been available for a given day if it had at least one interactive session on that day. Using this measure the average availability of the 17 panels was 92.6% during the 107-day period from July 17 till October 31, 2009. The monthly average availability of the 17 panels has improved steadily: July 78.0%, August 89.4%, September 96.5% and October 99.2%. Four panels had full 100% availability during the observation period. The low availability in July and August is mainly explained by various hardware and software problems that have since been solved. Availability in September would be very close to that of October, if the safety glass of an outdoor hotspot had not been vandalized, incurring two weeks of downtime and 7000 euros of repair expenses. V.
DISCUSSION
We conclude with a discussion on the lessons we have learned from the deployment and maintenance of the hotspots in a public urban space. A. Prepare a holistic deployment plan with a pessimistic schedule Urban spaces can be very dynamic, diverse and dense with complex ownership and decision making. While you may have full control of your own lab, you do not have full control of a public space. Instead, you are on the mercy of the municipal decision making bureaucracy and the
contributions of external contractors. The best way to guard against all possible contingencies is a holistic deployment plan with a pessimistic schedule. The plan should include each and every deployment task with ample time for taking care of them. Of course, things can still go badly wrong. For example, the summer trainee driver of a truck hauling a group of outdoor hotspots (35000 eur a piece) from the manufacturer’s factory to Oulu did not strap up the devices properly upon loading. The hotspots fell during the transportation and two hotspots were damaged beyond repair, introducing a one month delay to their installation.
Our current maintenance model is point-to-point, i.e. we do not have any automatic mechanism for distributing for example software updates or conducting other bulk operations to the whole network of hotspots. While the image based software installation was practical in the initial roll out, using images to propagate small updates has proven to be overkill. Installing an image takes roughly an hour, thus distributing the software to the 18 control PC’s corresponds to roughly three days of work. We are currently working on a framework for automatic pull/push based distribution of arbitrary installation packages.
B. Design the lifecycle (business) model of your deployment beforehand Before you make any deployments, you should have a clear understanding of who is responsible for which capital and operational expenditure, both during and after your research project. A natural partner is the municipality, if you manage to convince them about the potential benefits of your installation. If you have a commercial dimension in your deployment, then you have to understand the relevance of existing business practices and value networks to your business model. Further, the commercial dimension may impose restrictions on the research component, as illustrated by the commercial use of our UBI-channel. Public deployments can be very expensive in terms of engineering cost. There is a huge gap between a one-time steering group demo and months or even years long deployment exposed to the diverse general public, which assumes 24/7 availability.
ACKNOWLEDGMENTS
C. Allocate sufficient and designated maintenance resources A public deployment requires manpower for maintenance. Allocating designated maintenance personnel is highly recommended, if you can afford it. If the researchers have to take care of maintenance, then you need to specify clear roles for them. Having researchers taking care of maintenance can lead to confrontations between longterm research tasks such as writing papers and short-term maintenance tasks such as fixing a faulty network card promptly. D. Automate maintenance The maintenance expenses and the availability of the deployment can be greatly optimized by automating maintenance. Our “Happy page” provides immediate insight to the current visual state of the hotspots, assuming that someone just remembers to take a look. Any deviations are then handled manually with remote management tools if possible. We have to develop this procedure further in two respects. First, we have to introduce reliable mechanisms for generating alerts to alleviate need for constant visual monitoring, particularly outside normal working hours. Second, we are not able to reboot an unresponsive hotspot remotely, but doing it requires an expensive site visit. We look forward addressing this with the remote control cards.
The financial support of the Finnish Funding Agency for Technology and Innovation, the European Regional Development Fund, the City of Oulu, and the UBI (UrBan Interactions) consortium is gratefully acknowledged. A video illustrating the functionality of the UBI-hotspot 1.0 is available at http://www.ubioulu.fi/node/133. REFERENCES [1]
O. Storz, A. Friday, N. Davies, J. Finney, C. Sas, and J. Sheridan, "Public Ubiquitous Computing Systems: Lessons from the e-Campus Display Deployments," IEEE Pervasive Computing, vol. 5, no. 3, July-September 2006, pp. 40-47. [2] J. Müller, O. Paczkowski, and A. Krüger, "Situated public news and reminder displays," in Ambient Intelligence 2007, Darmstadt, Germany, pp. 248-265. [3] G. D. Abowd and E. D. Mynatt, "Charting past, present, and future research in ubiquitous computing," ACM Trans. Comput.-Hum. Interact., vol. 7, no. 1, pp. 29-58, March 2000. [4] N. Davies and H. W. Gellersen, "Beyond prototypes: challenges in deploying ubiquitous systems," IEEE Pervasive Computing, vol. 1, no. 1, pp. 26-35, 2002. [5] D. Fitton, K. Cheverst, C. Kray, A. Dix, M. Rouncefield, and G. Saslis-Lagoudakis, "Rapid prototyping and user-centered design of interactive display-based systems," IEEE Pervasive Computing, vol. 4, no. 4, pp. 58-66, 2005. [6] R. Sharp, "Deploy or die: A choice for application-led ubiquitous computing research," in 2005 UbiApp Workshop:What makes for good application-led research in ubiquitous computing?, Munich, Germany. [7] M. Jurmu, S. Boring and J. Riekki, “ScreenSpot: Multidimensional resource discovery for distributed applications in smart spaces,” in MobiQuitous'08, Dublin, Ireland. [8] S. Greenberg and B. Buxton, “Usability evaluation considered harmful (some of the time),” in CHI 2008, Florence, Italy, 111-120. [9] E. Paulos and T. Jenkins, “Urban Probes: Encountering our emerging urban atmospheres,” in CHI 2005, Portland, OR, USA, 341-350. [10] T. Lindén, T. Heikkinen, T. Ojala, H. Kukka and M. Jurmu, “Webbased framework for spatiotemporal screen real estate management of interactive public displays”, in WWW 2010, Raleigh, NC, USA, 12771280. [11] S. Hosio, M. Jurmu, H. Kukka, J. Riekki and T. Ojala, “Supporting distributed private and public user interfaces in urban environments”, in HotMobile 2010, Annapolis, MD, USA, 25-30. [12] T. Ojala, H. Kukka, T. Lindén, T. Heikkinen, M. Jurmu, S. Hosio and F. Kruger, “UBI-hotspot 1.0: Large-scale long-term deployment of interactive public displays in a city center”, in ICIW 2010, Barcelona, Spain, 285-294.