The firmware of the router can be replaced with an open source ... 1) are used to control and monitor all the routers of our deployment through the wired interfaces. They also serve as traffic source and sink for most of the tests (we assess.
Lessons Learned from the Deployment of a Multihop IEEE 802.11g Testbed Using COTS Devices Pablo Serrano, Carlos J. Bernardos, Antonio de la Oliva and Ignacio Soto Departamento de Ingenier´ıa Telem´atica Universidad Carlos III de Madrid Avda. Universidad, 30, 28911, Legan´es, Spain Email: email: {pablo, cjbc, aoliva, isoto}@it.uc3m.es
Abstract—A lot of attention has been given to multihop wireless networks lately, but further research is needed. This attention has motivated an increase in the number of 802.11based deployments, both indoor and outdoor. These testbeds are used to run measurements in order to analyze and understand the limitation and differences between analytical or simulationbased figures and the results from real-life experimentation. In this paper we describe the lessons learned from the deployment of a wireless multihop testbed under the false floor of a laboratory in our Computer Science building. We assess the radio shielding provided by the false floor panels, and run exhaustive and controlled experiments to analyze the performance limits of commercial off-the-shelf hardware. The results obtained confirm that experimental measurements can severely deviate from the expected theoretical values.
I. I NTRODUCTION Nowadays, there are many 802.11-based deployments, both indoor [1]–[3] and outdoor [4], [5], this being primarily motivated by the low cost and wide availability of Wireless LAN (WLAN) devices. These deployments are used for a variety of purposes, e.g., to provide communication in rural areas [6]–[8], as a distributed infrastructure for the supervision of enterprisesized WLANs [9], [10], to build community mesh networks, both by private companies or by universities [11], [12], and so on. Although there is a widespread deployment of 802.11-based networks, research on all aspects of how to manage these deployments is still quite active, specially when they involve multi-hop wireless links. Most of the research on wireless networks has been based on simulation, but as highlighted above and because the field is becoming more mature, there is an increasing interest in experimental results from realistic testbeds. However, having realistic wireless testbeds is not an easy task. The cost of the equipment, the required physical space, the interference with other wireless networks, and the management and configuration of the testbed, are all burdens that have to be addressed by researchers (e.g., [1], our previous work of [13]). In this paper we present a testbed that is comprised of 12 commercial off-the-shelf (COTS) wireless routers which are installed under the false floor in one of the rooms of our
Computer Science (CS) building. Out of the potential locations for such a medium-size testbed (e.g., wiring closets, lowered ceilings, private offices), we decided to deploy it under the false floor because of: i) the availability of the space, ii) the physical protection provided by the false floor, and iii) the gridded power and wired connectivity (sockets are usually uniformly distributed through the room). Once the devices have been deployed and connected, we proceed to characterize the testbed, to determine how the environment (interference from other wireless devices, isolation through metal in the floor) can impact experiments. We also assess the devices’ performance under large frame-per-second rates, and investigate if transmission power can be used as a means to emulate a variety of multi-hop scenarios in the testbed. The rest of the paper is organized as follows: Section II describes the testbed, equipment, costs, and configuration. Section III assess the impact of the environment on the performance figures values, analyzing the presence of interference sources as well as the isolation provided by the false floor panels. Finally, Section IV is devoted to the assessment of the COTS devices, i.e., analyzing their performance limits, while Section V lists the lessons learned during the set up of the testbed and the experiments and Section VI concludes the paper. II. D ESCRIPTION
OF THE
T ESTBED
In this section we describe the wireless mesh testbed deployed under the false floor of one of the labs of our CS building. A. Experimental setup FloorNet is composed of 12 routers, as shown in Fig. 1. Since cost is a key factor that determines the feasibility of mesh deployments, we use commercial off-the-shelf (COTS) wireless routers to assess the performance that can be achieved with non-specialized hardware. In particular, we use the Linksys WRT54GL v1.1 router. This is a small and very popular home and office broadband router, equipped with a 200 MHz processor, an IEEE 802.11b/g WLAN interface and an IEEE
offices/laboratories where computer equipment is installed). With this deployment we are able to run automatized experiments with little human interaction and maintenance. An estimation of the overall cost of the testbed is 1500e. Fig. 2.
Available 802.11g channels in Spain.
802.3 Ethernet interface connected to a Virtual LAN (VLAN) capable 5-port switch. The firmware of the router can be replaced with an open source Linux-based firmware. We install the OpenWRT 1 [14] Kamikaze 7.09 distribution with a Linux-2.4 kernel in the routers. This firmware gives us more flexibility in the use and configuration of the routers than the original firmware. A wired interface of each of the routers is used to perform several control and management plane operations, such as the global synchronization of the local time of all the routers, the remote execution of tests and the retrieval of the results for off-line processing. Two central nodes (PCs, not shown in Fig. 1) are used to control and monitor all the routers of our deployment through the wired interfaces. They also serve as traffic source and sink for most of the tests (we assess the impact of the entity generating traffic in Section IV-A). This way, management traffic does not interfere with the actual measurement data on the wireless medium. All the routers and the central nodes are connected to 24-port Gigabit D-LINK DGS-1224T switch (not shown in Fig. 1). We use private addressing for all the network interfaces (wired and wireless). The particular addressing and routing can be changed by remote script execution from the central nodes. The wireless parameters (e.g., SSID, mode, transmission power, etc) can also be changed remotely. This allows us to dynamically modify the network topology as required by the different experiments. We configure all the devices to use the country settings for Spain. This has an impact on the channels that can be used –Fig. 2 shows the 802.11b/g channels for Spain– and on the maximum allowed transmission power levels. We disable 802.11b compatibility mode by setting the GOnly flag, but we keep the devices’ rate adaptation [15] algorithms enabled. This way, we have a smoother transition between connectivity and no connectivity situations, while we avoid performance drops caused by the use of 802.11b compatibility mode in 802.11g networks [16]. B. Cost One of the key features of FloorNet is that it is a cheap but powerful testbed. The following list gives an overview on the estimated cost of the equipment used: • Linksys WRT54GL v1.1: 52e per unit. • Desktop PC: 400e per unit. • Gigabit Ethernet switch: 200e In addition to the previous equipment, we the wiring and a room with false floor (which is quite common in 1 http://www.openwrt.org/
III. I MPACT
OF THE
E NVIRONMENT
Given that we are using 802.11g devices operating in the 2.4 GHz band for the deployment of our testbed, we expect the presence of many potential sources of interference (other 802.11g devices, Bluetooth devices, etc). To assess the extent to which this indeed constitutes a risk and may introduce a bias in the measurement process, we first estimate the presence and impact of other 802.11 sources. Then, we analyze if the false floor panels can provide some degree of isolation from these sources. A. Impact of the time of the day In order to check for possible interference sources which may affect the results from our testbed, we measure the performance obtained with a pair of devices during a 24-hour period. This way, with the results from this analysis we are able to select the most appropriate time window to perform measurements. We analyze the performance of a unidirectional wireless communication between two Linksys devices using 802.11g. To that aim, we use iperf2 to generate traffic from one desktop machine to the other desktop machine, using the wireless link between the devices R011 and R012 (see Fig. 1). The traffic generated consists of a UDP flow of 35 Mbps, using frames of 1500 bytes during an interval of 30 seconds. In order to test every possible channel, after each 30-second sample the channel used is changed to the next one, using the full set of available channels in Spain which span from channel 1 to channel 13. Apart from this two devices, we also configure R008 in monitor mode to capture all traffic from external sources in the considered channel. The results obtained are shown in Fig. 3, where we plot the bandwidth obtained and the detected frames from other traffic sources observed during the experiment. The maximum theoretical achievable bandwidth for IEEE 802.11g and for a packet size of 1500 bytes is above 30 Mbps [17]. As shown in Fig. 3, this maximum achievable bandwidth is never obtained. Results from this test for a 24-hour time span can be summarized as follows: • The achievable bandwidth varies between two distinct states. The first state corresponds to bandwidth rates in the order of 20-25 Mbps, spanning between the nighttime up to 9h and between 14h and 18h. The second state corresponds to lower bandwidth rates, between 10 and 15 Mbps, spanning between 9h and 14h and between 18h and 21h. • In the fist state (from 21h to 9h and from 14h to 18h), the performance is quite stable. Note that the achieved bandwidth is approximately the same at night hours than 2 http://sourceforge.net/projects/iperf/
Throughput (Mbps)
Fig. 1.
Physical deployment of FloorNet.
25 20 15 10 5 0
1 2 3 4 5 6 7
8 9 10 11 12 13
•
5000
Frames
4000 3000 2000
night, corresponding to the different ubiquitous WLAN networks of the building. In the second state (from 9h to 14h and 18h to 21h) performance is quite unpredictable. During these periods of time, the number of frames from external sources increases, showing also the instability trend across all channels. We argue that this time period matches perfectly with the schedule of the undergrad students using the lab for research activities (e.g., Bluetooth devices): students arrive at 9h, working until lunch time (14h), and resuming after classes from 18h to 21h.
1000 0 0:00
Fig. 3.
B. False floor isolation 6:00
12:00 Time of the day
18:00
24:00
Performance of 802.11g in our testbed.
from 14h to 18h. To relate performance to the influence of external interference sources, we also plot in Fig. 3 the number of frames from traffic sources other than ours. This graph shows how the number of frames detected is quite high, explaining the constant drop in performance across all the results, also showing how the number of frames is quite stable during night and slightly more unstable from 14h to 18h. This amount of interference is due to the fact of the testbed being deployed in a CS lab, where interference sources are always active, even at
Apart from the physical protection, another key feature of our deployment under the false floor is that it should provide to some extent isolation from other 802.11 devices3 . To assess the impact of this protection, we perform the following experiment. First, we put a pair of devices over the false floor (namely, the pair {R009, R010} and measure the throughput obtained with a UDP unidirectional communication for 30 seconds. We repeat the measurement 5 times for two values of the transmission power. We also record the RSSI value4 reported by the wireless device. Next, we place both devices 3 Note that the false floor in our laboratory is composed of two thin metal layers separated by a 2 cm chipboard layer. 4 RSSI, Received Signal Strength Indication, is a measurement, reported by the receiving device, of received signal strength. The value of RSSI is vendor dependent and has not units.
TABLE I I MPACT OF THE FALSE FLOOR ON THE LINK PERFORMANCE . Tx Power 1 dBm 19 dBm
RSSI -39.0 -28.0
Above Throughput 17.8 Mbps 19.5 Mbps
RSSI -53.4 -42.3
Below Throughput 21.2 Mbps 22.7 Mbps
•
24
The behavior where both devices are above the false floor corresponds to an interference-prone scenario (like, e.g., RoofNet [19]) that suffers from “RF-pollution” (as discussed in [18]). This is causing a bias in the measurement of the RSSI values: only those packets successfully received are considered. Out of these measurements, therefore, we derive two main conclusions: i) the false floor does provide our testbed with some shielding from external sources, and ii) for indoor testing one has to be cautious when relating RSSI and throughput.
Throughput (Mbps)
22 20 18 16 14 12 Above Below 10 -60 -55
RSSI value –this would be the “expected” behavior in interference-free environments, as proved in [18]. When both devices are above the false floor, indeed the RSSI’s reported are larger, but there is more variation both in the RSSI values and in the throughput obtained. Furthermore, throughput is smaller than in the previous case.
-50
-45
-40
-35
-30
-25
-20
RSSI
Fig. 4. Performance of a single 802.11g link above and below the false floor.
under the false floor, and repeat the process. The average values of the 5 runs for each configuration are presented in Table I. Out of the results of the table, it is clear that the false floor has some impact on the values obtained for each configuration. Considering throughput, it is clear that the throughput values obtained when both devices are placed under the false floor are noticeable larger (> 15%) than when both devices are above the floor. Therefore, it seems that the false floor provides a better environment for the performance of experiments5. Considering the reported RSSI values of Table I, a first (and expected) result is that, for the same scenario, the larger the transmission power used, the larger the RSSI. However, there is a second and non-intuitive result: the RSSI values are smaller when both devices are “protected” by the false floor. Furthermore, there is an apparent contradiction: for the largest RSSI value, the throughput is smaller than for the smallest RSSI value. To analyze this result, we repeat the experiments considering 5 different values for the transmission power (namely: 1, 5, 10, 15 and 19 dBm). Each measurement is repeated five times. Then we plot the values of throughput obtained vs. the reported RSSI values in Fig. 4, where we use circles to represent values when both devices are below, and black squares to represent values when both devices are above the floor. We observe the following results: • When both devices are below the false floor, the throughput values are larger and present less variability, and there seems to be a small positive correlation with the 5 We performed additional experiments to assess the ability of the false floor panels to attenuate a wireless communication, and indeed crossing the false floor resulted in a throughput degradation of approximately 30%.
IV. D EVICE A SSESSMENT With the information from the previous measurements, we are able to select the most appropriate time windows to perform measurements. We then proceed to assess the performance of the COTS devices, by using different configurations of i) the frame size used and the device that generates traffic, and ii) the channel separation between devices and the transmission power used. A. Impact of the entity generating traffic In our testbed, as described in Section II-A, we use PCs to generate traffic while wireless devices are used only to forward it to the final destination. This closely resembles real wireless deployments. An alternative configuration, that can be quite tempting, is to generate the traffic in the wireless routers, this way reducing the equipment needed and the corresponding management operations. This alternative configuration would be feasible only if generating the traffic in the wireless devices does not affect the observed behavior. The concern is that traffic generation can impose a severe burden to the (typically small) capacity of the COTS devices used in the testbed. To assess the extent to which traffic generation can reduce the forwarding ability of these devices, we perform the following experiment. Using the PCs to generate traffic with iperf, we measure the maximum UDP bandwidth achievable for different frame sizes (i.e., different frames per second). In this way, the frames generated by one of the PC are sent through the wired Ethernet to a first wireless device, that sends it over the wireless medium to the second device, that finally forwards the frames to the receiving PC. The devices used were R004 and R008. After we finish this round of experiments, we repeat the measurement, but it this case using the wireless devices themselves to generate the traffic. This way, the frames are generated at the wireless router and sent over the wireless medium to be received at the other wireless device. We also
Throughput (Mbps)
30
30
Maximum Devices PCs
25 Throughput (Mbps)
35
25 20 15 10
15
10
5
5 0
0 200
Fig. 5.
20
400
600 800 1000 Frame size (Bytes)
1200
1400
Impact of using the wireless devices to generate traffic.
measure using cyclesoak6 the CPU utilization in all cases, this being always larger than 90% which confirms that the CPU usage is a limiting factor for throughput. We perform the same measurement 5 times to obtain the average, maximum and minimum value. The results from these experiments, also compared against the maximum theoretical performance [17], are given in Fig. 5. We highlight the following results: • The entity used to generate traffic can have a significant impact on the performance. Therefore, in general it is not safe to generate traffic using COTS wireless devices and assume that the scenario is closely resembling the performance of real wireless deployments –in these, traffic is generated by the end hosts, while the devices are devoted to forwarding. • The relative performance of each approach depends on the frame size: for small frame sizes, the largest throughput is obtained using the wireless routers to generate traffic; for large frame sizes, the largest throughput is obtained using the desktop machines. We conjecture that this is caused because the wireless device is not able to cope with the processing burden of receiving-forwardingtransmitting a large number of small frames per second. The main conclusion from the above results is that, indeed, the entity generating traffic can introduce a bias in the performance obtained, and therefore before running extensive measurements in a testbed great care has to be put in the performance assessment of the devices. Note that from now on all experiments are performed using a frame size of 1500 bytes and using the PCs to generate traffic.
1 5 10 15 19
dBm dBm dBm dBm dBm 20
40
60 80 Link #
100
120
Fig. 6. Impact of the transmission power on the connectivity of the 802.11g testbed.
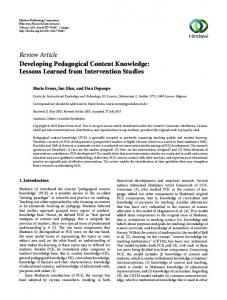
Then, for each of the N × (N − 1) available links, we measure the bandwidth obtained for a 30-second UDP unidirectional run. That is, for each of the 12 Linksys nodes, we measure the bandwidth between that node and each of the other 11 nodes, with only one link active at a time. Note that with 12 nodes we have a total of 132 unidirectional links. We repeat each measurement 5 times, and compute the average, minimum and maximum values of throughput per link. Then we sort the resulting list of average bandwidth rates from largest to smallest and plot the results. The experiment is repeated for different transmission power levels, with the results depicted in Fig. 6. (We plot the minimum and maximum values obtained every 10 links for clarity reasons.) Fig. 6 shows that a high degree of connectivity is achieved in 802.11g even with the lowest transmission power. Actually, most of the results overlap, and changing the transmission power affects the performance of only about 30% of the links. This means that 802.11g, with its larger transmission range, does not support the creation of diverse layer-2 connectivity patterns in our testbed. During the measurements we also sample the RSSI reported by the receiving device. Then we plot in Fig. 7 the relation between the bandwidth and the relative quality measurement. The figure shows that once a certain RSSI is achieved, we get the maximum bandwidth in the link, and therefore (because of the shielding provided by the false floor) it can be used to predict the link performance (as reported in [8]). Another interesting consideration is that the dispersion in very large, with a lot of variation in the bandwidth achieved. C. Impact of the Channels Used
B. Impact of the transmission power In this section we measure the ability of the transmission power to modify the connectivity pattern in our testbed. We first set all the N nodes to use the same transmission power. 6 We had to download the source code of the tool from http://www.tux.org/ pub/sites/www.zip.com.au/\%257Eakpm/linux/zc.tar.gz and cross-compile it to run on the MIPS architecture of the devices.
In this section, we take advantage of our testbed to run extensive automatized experiments to analyze deployments where two different links are active at the same time. Note that we are talking about relative distances between the sender, the intended receiver and potential interferer(s). Still, in all cases the absolute distances between each pair of devices are substantially larger than the far-field threshold, to prevent
Risingle+Rjsingle
25 50
Throughput (Mbps)
Throughput (Mbps)
20
15
10
5
0 -90
40 d=0 d=5 d=10
30 Riboth+Rjboth 25
20
15 -80
-70
-60
-50
-40
-30
-20
RSSI
2
4
6
8 10 12 Tx Power (dBm)
14
16
18
Fig. 7. Relation between the obtained bandwidth and the reported RSSI by the 802.11g devices.
Fig. 8. 802.11g links: Impact of the channel distance and transmission power on the total throughput.
close-field interference (as reported by, e.g., [20]). This farfield threshold d is given by [21]:
that these results could be expected, given the little impact of the transmission power on the variety of links that we already observed in Fig. 6. • Channels always interfere, regardless of the configuration used. Note that for d = 0 the assumed behavior would be a channel sharing of approximately 50% (depending on the capture effect and the efficiency of the CSMA/CA mechanism), and indeed this is approximately the case: together, the sum of rates is approximately 18 Mbps, while in case they do not transmit at the same time the total throughput is around 40 Mbps. • On the other hand, the cases of d = 5 and d = 10 are quite unexpected as non-overlapping channels (see Fig. 2) are assumed to not interfere at far distances, but we find that instead they do severely interfere with each other7 . Motivated by the “notch” at 7 dBm, we next extensively analyze the performance of a single link for different values of the transmission power used. To this aim, we run the 30second UDP tests between two devices for a sweep of the values of the transmission power between 5 dBm and 10 dBm, repeating each experiment 10 times. The results are depicted in Fig. 9. Indeed, the figure shows that the Linksys devices introduce a drop in performance when using a transmission power close to 7 dBm: even the best performance out of 10 measurements for the {6,7,8} dBm values is well below the worst performance of the other values. Therefore, not only the Linksys devices interfere with each other when using non-overlapping channels, but also they can introduce a bias in performance depending on the values of the transmission power used. The key conclusions that we draw from the above experiments using the off-the-shelf 802.11g equipment are: i) the equipment suffers from severe interference, even when nonoverlapping channels are used, and ii) there is an unexpected drop in performance that depends on the transmission power
2D2 λ where D is the antenna diameter and λ is the wavelength of the radio wave. We consider three different configurations, a) both links i and j are using channel 13, i.e., channel distance d = 0; b) the channels are configured at a distance d = 5, more specifically, link i uses channel 13 and link j uses channel 8; and c) the configured channels are 13 and 3, respectively, resulting in a channel distance d = 10. For each of these configurations we change the transmission power each device is using, from 1 dBm to 19 dBm in steps of 2 dBm, and measure four different throughput rates: j i • Rsingle (Rsingle ): the bandwidth measured in link i (link j) when only one link is active. j i • Rboth (Rboth ): the bandwidth measured in link i (link j) when the two links are active. The above is repeated 5 times. We then plot in Fig. 8 the sum of the bandwidth for both links when they are transmitting j i i simultaneously (Rboth +Rboth ) or at different times (Rsingle + j Rsingle ), for the three different channel separation scenarios (we also plot in the figure the minimum and maximum values measured). Note that the comparison of these two metrics is a proper estimation of the impact of the interference between the two links. Indeed, in absence of interference the two sums will take the same value, while in case the links interfere with each other, the sum of bandwidth rates will be smaller when j i +Rboth ) than when both links are simultaneously active (Rboth j i + Rsingle ). they are not (Rsingle From the results shown in Fig. 8, we make the following observations: • The transmission power does not have a noticeable impact on the performance, as all values look relatively flat (apart from a “notch” at 7 dBm that we will analyze next). Note d=
7 We repeated the experiment for different configurations of the channels used in links i and j obtaining similar results.
21
Throughput (Mbps)
20
19
18
17
16
15 5
6
7 8 Tx Power (dBm)
9
10
Fig. 9. Impact of the transmission power configured on the performance of a single 802.11g link.
used8 . Despite the fact that it is well-known that multiinterface devices typically suffer from inter-card interference (see, e.g., [20], [22], [23]), and that the use of directional antennae may aggravate the adjacent channel interference as well (e.g. [24]), our results are indeed unexpected as devices are placed at distances much larger than the far field threshold. Furthermore, we have not found in the literature any reference to this faulty performance that depends on the configured transmission power. These results, that constitute part of the main contributions of the paper, adds to the growing evidence of deviations from expected behavior of off-the-shelf 802.11 devices (e.g., [25]–[27]). V. L ESSONS L EARNED In this section, we enumerate the most important lessons learned from the design, deployment and assessment of the testbed. 802.11 indoor testbeds suffer from interferences, both intra (i.e., neighboring wireless networks) and inter technology (e.g., Bluetooth). This is particularly evident for the case of 802.11b/g WLANs that operate in the over-populated 2.4 GHz band. External interference measurement or estimation is crucial to understand experimental results. Along with the devices used to perform a given experiment, the deployment of a parallel infrastructure to monitor all the activity in the channel is helpful to understand possible deviations from the expected results. The false floor provides shielding from external radio sources, which is particularly convenient for the crowded 2.4 GHz band. Despite we believe that the physical protection from the false floor is enough motivation to deploy testbeds like FloorNet, this comes with the added benefit of partial radio isolation. 8 We
repeated the measurements using different pairs of Linksys devices and we obtained similar performance. We also measured the reported RSSI values, and they did not show any relation with the transmission power used.
Careful node placement is crucial. The distance between antennae/nodes has to be larger than the far-field threshold to avoid near-field unpredictable effects, which are hard to identify. Off-the-shelf routers have very limited resources. Note that this has huge impact on (and therefore conditions) the types of tests and measurements that can be conducted in a testbed. For instance, these routers are not powerful enough to generate, process and/or forward frames at some traffic rates. Wiring also deserves some attention. We found that using cheap Ethernet switches (like common 5 to 8-port home switches) causes unexpected performance drops, such as intermittent disconnections or throughput bottlenecks. Therefore, instead of using cheap switches it is better to spend the money on wiring and use high-performance switches with star-alike topologies. Periodic soft rebooting of the testbed is useful. Off-theshelf devices are more prone to software bugs and hardware problems, thus their up-times are typically short, and after some days operating under stressing conditions (e.g., at full forwarding speed) they start to malfunction or even halt. Therefore, it is recommended to perform a soft reboot between series of tests. Be careful when changing wireless settings, since some particular combinations of the, e.g., iwconfig command may not result in the desired configuration. It is therefore very important to verify applied changes and to identify conflicting settings. Do not always use the same “SSID”. It is better to use different network names every time a new test is initiated or a new network has to be created. Using always the same SSID might cause that several stations remain joined to an old network or re-join it despite a change of frequency, leading to unexpected problems. VI. S UMMARY In this paper we have presented a wireless mesh testbed deployed under the false floor that is based on COTS equipment. We have analyzed and assessed its unique characteristics, that we believe constitute strong support for the deployment of these type of testbeds –despite that, for the COTS devices used, performance figures deviate from the expected behavior. First, the false floor provides the testbed with physical protection, a feature that saves a lot of time because of, e.g., the absence of wire disconnections. We believe this feature itself constitutes a major reason for the deployment of testbeds like ours. Second, despite the relatively small size of the deployment, we claim it is a valuable research tool. One of the major findings we have derived by means of the testbed is the nonideal behavior of off-the-shelf hardware, as seen in both i) the impact of the entity generating traffic in the measurements, and in ii) the strong interference between (assumed) nonoverlapping channels. ACKNOWLEDGMENTS The authors would like to thank Francisco Ramos and Miguel Flores for their support in setting up the testbed in-
frastructure. The research leading to these results has received funding from the European Community’s Seventh Framework Programme (FP7/2007-2013) under grant agreement n0 214994 (CARMEN project). It was also partly funded by the Ministry of Science and Innovation of Spain, under the QUARTET project (TIN2009-13992-C02-01). R EFERENCES [1] H. Lundgren, K. Ramachandran, E. Belding-Royer, K. Almeroth, M. Benny, A. Hewatt, A. Touma, and A. Jardosh, “Experiences from the Design, Deployment, and Usage of the UCSB MeshNet Testbed,” IEEE Wireless Communications, vol. 13, no. 2, pp. 18–29, 2006. [2] V. Navda, A. Kashyap, and S. Das, “Design and Evaluation of iMesh: An Infrastructure-mode Wireless Mesh Network,” in Sixth IEEE International Symposium on a World of Wireless Mobile and Multimedia Networks, 2005. WoWMoM 2005, 2005, pp. 164–170. [3] J. De Bruyne, W. Joseph, L. Verloock, and L. Martens, “Evaluation of Link Performance of an Indoor 802.11g Network,” in 5th IEEE Consumer Communications and Networking Conference, CCNC 2008, January 2008. [4] J. Camp, J. Robinson, C. Steger, and E. Knightly, “Measurement Driven Deployment of a Two-tier Urban Mesh Access Network,” in Proceedings of the 4th international conference on Mobile systems, applications and services. ACM New York, NY, USA, 2006, pp. 96–109. [5] Y. Takahashi, Y. Owada, H. Okada, and K. Mase, “A Wireless Mesh Network Testbed in Rural Mountain Areas,” in Proceedings of the the second ACM international workshop on Wireless network testbeds, experimental evaluation and characterization. ACM New York, NY, USA, 2007, pp. 91–92. [6] K. Chebrolu and B. Raman, “FRACTEL: A Fresh Perspective on (Rural) Mesh Networks,” in ACM SIGCOMM Workshop on Networked Systems for Developing Regions, NSDR’07, August 2007. [7] D. Gokhale, S. Sen, K. Chebrolu, and B. Raman, “On the Feasibility of the Link Abstraction in (Rural) Mesh Networks,” in IEEE INFOCOM 2008. The 27th Conference on Computer Communications, 2008, pp. 61–65. [8] B. Raman and K. Chebrolu, “Experiences in Using WiFi for Rural Internet in India,” IEEE Communications Magazine, vol. 45, no. 1, pp. 104–110, 2007. [9] D. Gupta, P. Mohapatra, and C. Chuah, “Efficient Monitoring in Wireless Mesh Networks: Overheads and Accuracy trade-offs,” in 5th IEEE International Conference on Mobile Ad Hoc and Sensor Systems, 2008. MASS 2008, 2008, pp. 13–23. [10] Y.-C. Cheng, J. Bellardo, B. P., A. C. Snoeren, G. M. Voelker, and S. Savage, “Jigsaw: Solving the Puzzle of Enterprise 802.11 Analysis,” ACM SIGCOMM Computer Communication Review, vol. 36, no. 4, 2006. [11] X. Li, R. Stewart, S. Murphy, E. Fallon, A. Hanley, and S. Roy, “Performance Evaluation of Meraki Wireless Mesh Networks,” IT&T 2007 General Chairs Letter, p. 156.
[12] B. Milic and M. Malek, “Analyzing Large Scale Real-world Wireless Multihop Network,” IEEE Communications Letters, vol. 11, no. 7, p. 580, 2007. [13] P. Serrano, A. De La Oliva, C. J. Bernardos, I. Soto, A. Banchs, and A. Azcorra, “A CARMEN Mesh Experience: Deployment and Results,” in IEEE Workshop on Hot Topics in Mesh Networking, HotMESH’09, June 2009. [14] F. Fainelli, “The OpenWrt Embedded Development Framework,” in Free and Open Source Software Developers European Meeting, 2008. [15] M. Lacage, M. Manshaei, and T. Turletti, “IEEE 802.11 Rate Adaptation: A Practical Approach,” in Proceedings of the 7th ACM international symposium on Modeling, analysis and simulation of wireless and mobile systems. ACM New York, NY, USA, 2004, pp. 126–134. [16] C. J. Bernardos, I. Soto, and A. Banchs, Medium Access Control in Wireless Networks. Nova Science Publishers, Inc., 2008, ch. IEEE 802.11 Standards. [17] M. Bredel and M. Fidler, “A Measurement Study of Bandwidth Estimation in IEEE 802.11 g Wireless LANs Using the DCF,” Lecture Notes in Computer Science, vol. 4982, p. 314, 2008. [18] B. Raman, K. Chebrolu, D. Gokhale, and S. Sen, “On the feasibility of the link abstraction in wireless mesh networks,” IEEE/ACM Trans. Netw., vol. 17, no. 2, pp. 528–541, 2009. [19] D. Aguayo, J. Bicket, S. Biswas, G. Judd, and R. Morris, “Link-level Measurements from an 802.11b Mesh Network,” SIGCOMM Comput. Commun. Rev, vol. 34, no. 4, pp. 121–132, 2004. [20] C. Cheng, P. Hsiao, H. Kung, and D. Vlah, “Parallel Use of Multiple Channels in Multi-hop 802.11 Wireless Networks,” in Military Communications Conference, 2006. MILCOM 2006, 2006, pp. 1–9. [21] C. Balanis, “Antenna Theory and Design,” John Wiley&Sons, Inc, pp. 249–347. [22] J. Robinson, K. Papagiannaki, C. Diot, X. Guo, and L. Krishnamurthy., “Experimenting with a Multi-Radio Mesh Networking Testbed.” in 1st workshop on Wireless Network Measurements (Winmee), Riva del Garda, Italy, April 2005. [23] P. Fuxjager, D. Valerio, and F. Ricciato, “The Myth of Non-Overlapping Channels: Interference Measurements in IEEE 802.11,” in Proc. Fourth Annual Conference on Wireless on Demand Network Systems and Services WONS07, 2007, pp. 1–8. [24] V. Angelakis, N. Kossifidis, S. Papadakis, V. Siris, and A. Traganitis, “The effect of using directional antennas on adjacent channel interference in 802.11a: Modeling and experience with an outdoors testbed,” in WiOPT - 6th International Symposium on Modeling and Optimization in Mobile, Ad Hoc, and Wireless Networks, 2008. [25] G. Bianchi, A. D. Stefano, C. Giaconia, L. Scalia, G. Terrazzino, and I. Tinnirello, “Experimental Assessment of the Backoff Behavior of Commercial IEEE 802.11b Network Cards,” in INFOCOM, 2007, pp. 1181–1189. [26] D. Giustiniano, G. Bianchi, L. Scalia, and I. Tinnirello, “An Explanation for Unexpected 802.11 Outdoor Link-level Measurement Results,” INFOCOM 2008. The 27th Conference on Computer Communications. IEEE, pp. 2432–2440, April 2008. [27] P. Serrano, M. Zink, and J. Kurose, “Assessing the Fidelity of COTS 802.11 Sniffers,” INFOCOM 2009. The 28th Conference on Computer Communications. IEEE, April 2009.