LABORATORY TESTING PROGRAM FOR F.E. CRASH ANALYSES OF PARATRANSIT BUSES. Hongyi Li ... mechanics of paratransit buses. ... realistically represent the vehicle dynamic ... sample of the bus skin with 100 mm long and 13.
LABORATORY TESTING PROGRAM FOR F.E. CRASH ANALYSES OF PARATRANSIT BUSES Hongyi Li Jeff Siervogel Cezary Bojanowski Jerry W. Wekezer FAMU-FSU College of Engineering United States Jerzy W. Kownacki Motor Transport Institute Poland Leslaw Kwasniewski Warsaw University of Technology Poland Paper Number 07-0539
ABSTRACT An extensive validation program was developed and implemented in support of computational mechanics of paratransit buses. The program is based on laboratory testing of coupons for material characterization (test level 1, TL 1) and connection tests (TL 2). Experimental data obtained from TL 1 tests were used for development of the finite element (F.E.) models of several structural components and connections of a paratransit bus selected for this study. The segments, critical for crashworthiness performance of the entire bus, included: a wall-to-floor, a wall-to-roof, and a sidewall panel of the bus. Resistance functions, relating a force applied vs. resulting displacement, were developed for each component. They were obtained from experimental tests (at TL 2) and from computational mechanics F.E. analyses. Comparison of the resistance functions and the failure mechanisms provided a good validation of the F.E. models of the major structural components which, in turn, were included in F.E. models of the entire paratransit bus. A model of the paratransit bus, with 600,000 finite elements, was developed for crashworthiness and safety assessment of the bus. AutoCAD files, material samples and components for testing were provided by the bus manufacturer to aid in the model development and validation processes. The Ls-Dyna nonlinear commercial code was used as major tools for numerical analyses. Two impact scenarios were considered: a rollover of a bus from 800 mm, and a 90o side impact of the bus by a pickup truck at 48 km/h. 1
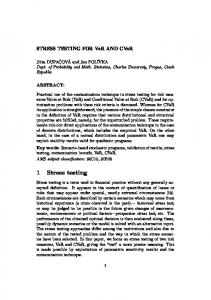
Australia. Paratransit services are offered by public transit agencies, community groups, schools and churches, and they are often used to transport students and passengers with disabilities [1]. Even though the significant mass of these buses makes them invulnerable in front- and rear-end collisions, roof crash and side impact collisions remain two major concerns for crashworthiness and safety assessment. Paratransit buses are usually built in two stages. The chassis and the cab are first assembled by one manufacturer, and then the body and relevant equipment are installed by another manufacturer. Since there are no well-defined industry standards for paratransit buses in the US, especially for the bodies built at the second stage, each body manufacturer has its own body design and connection details. Therefore, there is a need for conducting crash and safety assessment of this kind of bus. It is recognized that finite element simulation provides viable information of the bus structural performance in crash scenarios if the FE models are validated. This paper concentrates on laboratory testing of coupons for material characterization and component testing for connection strength implemented in support of the development of the FE models of a selected bus (Figure 1).
INTRODUCTION
Paratransit buses are defined as smaller buses usually carrying from 9 to 24 passengers. They are also known as public service vehicles (PSV) in England, minibuses in Europe, and omnibuses in
Figure 1. A picture of a paratransit bus.
Li 1
2
MATERIAL COUPON TESTING
LS-DYNA, a nonlinear, dynamic finite element code, is used for the crash simulation. In order to realistically represent the vehicle dynamic behavior, reliable material parameters should be first determined from laboratory tests. Four material types were selected for laboratory structure-property quantification, including:
2.
3.
4.
A metal sheeting 0.58 mm thick used as the outermost layer of the passenger compartment. The metal sheeting is glued with a thin layer of plywood to form a sandwich-like cover. This composite is further covered with foam for improved insulation and vibration damping. Structural material used for the passenger compartment includes box tubing sections (HSS) and C channels that are welded together to form a distinct cage. A ¾ inch plywood sheeting is typically used as a floor structure.
The steel coupons from the outer skin were prepared after removing the plywood part. For the structural steel, the test specimens were cut from the hollow section HSS 38.1x38.1x1.6mm which represents most of the bus body. A Computer Numeric Controlled (CNC) milling machine with a jig and a high tolerance cut (of 0.05 mm) was used to reduce the residual stresses in the test specimens. For steel coupons, spark spectrometry tests were first performed to determine their types. The spectro-max machine indicated that the materials were SAE 10xx series steel. Tensile tests were next conducted using an Instron 5865 machine, which is an electro-mechanical material testing machine using a PID feedback loop to monitor the extension of the specimen for a constant strain rate on the specimen. Figure 2 shows the setup of the steel coupon testing.
Figure 2. A coupon test of an outer layer of the bus wall. The stress strain relationship is presented in Figure 3, and the material parameters, along with the MatWeb data [2], are listed in Table 1.
Stress (MPa)
1.
500 450 400 350 300 250 200 150 100 50 0
structural steel skin steel
0
5
10
15
20
25
Strain (%)
Figure 3. Stress vs. strain diagram from tensile tests of the outer skin steel and structural steel.
Table 1. Material characteristics for skin steel and structural steel Ultimate strength (MPa)
Yield strength (MPa)
Elongation at break (%)
Reduction of area (%)
Modulus of elasticity (GPa)
MatWeb data for AISI 1010 Outer skin steel
365
305
20
40
205
463.2
346.38
23.9
37.95
186.66
Structural steel
345.54
315.49
25.8
43.9
165.17
For structural steel, the ultimate strength and yield strength are close to those of AISI 1010 steel, while the Young’s modulus is significantly lower.
However, both the ultimate strength and yield strength of the skin steel are higher than the AISI 1010 values. This is due to the work hardening of steel during successive rolling processes required to obtain a very thin sheet.
Li 2
30
The external wall of the bus is made of a thin steel sheet (0.58 mm thickness) glued with a thin layer of plywood (3.45 mm thickness). The properties of the metal part were determined by the tensile test as described above. Further testing was needed to find the properties of the thin layer of plywood. Due to the significant difference of compression and tension resistance of both materials, a tension test was judged as inappropriate since the plywood would crush in tensile testing machine grips. A sample of the bus skin with 100 mm long and 13 mm wide was cut for three-point bending test. This test was performed per ASTM C-393 standards in a test fixture and loaded using the Instron 5869. The support span was set as L = 80 mm, and a mid-span deflection was recorded as a function of the load applied at the midpoint of the beam. The force vs. deflection relationship is shown in Figure 4.
deflection curve which matches well with the tested curve shown in Figure 4. Inexpensive 7-ply plywood is a common material for the bus floors. Due to the construction of the wall-to-floor connection, it was found that the floor (plywood with unknown grade) contributed to the load transfer from the sides of the bus to the frame during side impact and rollover accidents. A segment of plywood was cut into 50.8 mm wide and 610 mm long for four- point bending beam test. The test setup is depicted in Figure 5.
100
Force (N)
80
60
40
20
Figure 5. A four point bending test of a plywood sample from the bus floor.
0 0
1
2
3
4
5
Deflection (mm)
Figure 4. Force vs. deflection diagram from the three-point bending test of the outer skin consisting of steel and plywood. From the force-deflection relationship, along with the known material properties of the steel layer, the properties of the plywood are determined with the assumption of elastic-plastic material. The parameters are listed in Table 2. Table 2. Material properties of the plywood in outer skin Initial modulus (MPa)
Tangent modulus (MPa)
Yield strength (MPa)
Failure strength (MPa)
1500
300
14.81
20.0
A simple finite element model of the composite skin was developed with LS-DYNA to verify the obtained properties. With the steel properties and plywood properties assigned to corresponding layers, finite element analysis generated the force
6
MTS LX 500 laser extensometer was used to measure the displacement at the mid span of the plywood sample (Figure 5). The measurement error was limited to +/- 0.001 mm. The flexure modulus of elasticity is 7.42 GPa and the maximum stress at break is 22.58 MPa. 3
COMPONENT TESTING
Simple pendulum testing can provide valuable information about actual dynamic properties of segments cut off from the bus body structure. Not only it will indicate how stiff the panel is under impact loading, but also it provides data for finite element model validation. A representative body panel was cut off and supported by two steel I shape beams (Figure 6). The impacting energy should be carefully selected. For example, an underestimated impacting mass leads to small deflections and poor validation of the assumed nonlinear material models. Excessive deflections due to overestimated impacting mass are useless for numerical simulation – the tested element is damaged, and no sufficient information about its behavior can be obtained. The best approach is to create FE models of the tested panels and run computer simulations first before the experiment. In this way some of the experiment parameters
Li 3
such as an impacting mass and its initial position can be estimated. The experimental setup for the bus wall panel, as well as the FE model is shown in Figure 6.
between the window and the bottom of the panel. After 1.5 seconds, the displacements approach constant values which indicate the permanent deflections. The calculated deflections at point A and point B are 47 mm and 49 mm, respectively. The strengths of wall-to-floor and wall-to-roof connections play an important role for the crashworthiness of the entire bus. Each manufacturer has its own method of building the connections. Figure 8 shows the details of the wallto-floor connection and Figure 9 presents the setup of the wall-to-floor testing.
Vertical tube Z bar
Floor
Point B
Point A
Spotwelds connecting Z bar and C channel C channel
C channel
Figure 6. An impact hammer test of a bus wall panel and the FE simulation. The impacting beam was 2.45 m long. The length of the arms was 3.02 m. The total mass of the hammer was 70.8 kg. In the testing, the hammer was raised to a height of 3.0 m and released. Before the hammer touched the panel, the impact velocity was about 7.67 m/s. The measured permanent deflections are 46 mm at point A and 48 mm at point B. Figure 7 shows the results of FE simulation.
Figure 8. Details of the wall-to-floor connection in FE analysis.
pulling forces
Figure 9. Setup of the wall-to-floor test.
Figure 7. Displacement response of point A and point B on the panel under hammer impact from FE simulation. It is found that the dynamic response of the panel is not symmetric because a non-symmetric internal square tubing is located across the lower part
Finite element models of the components were developed to simulate the testing process. The plywood floor was built from fully integrated solid elements with 8 nodes. The steel C channels, Z bars and vertical tubes were modeled with the 4node fully integrated shell elements which are considered computationally efficient and stable. The average element size is chosen as 20mm after trading off between the accuracy and time step. PIECEWISE_LINEAR_PLASTICITY material model was used for the steel with the material parameters obtained from the tests as shown in Table 1. The model of the component consists of 34,000 finite elements (Figure 10).
Li 4
[6-7]. After the bus has been overturned onto the edge of its roof, a defined survival space (Residual space) must be intact. The vehicle is placed on a horizontal platform and then tilted (without rocking and without dynamic effects, angular velocity shall not exceed 5 degrees per second) until it rolls over. The tilt table is elevated by 800 mm above the concrete floor (Figure 12).
Figure 10. FE model of the wall-to-floor connection. The calculated moment vs. rotation curve is compared with that from the test as shown in the Figure 11. 1800
Figure 12. Rollover testing defined by UN ECE Regulation 66.
LS-DYNA for wall-to-floor connection
1600 1400
Experiment for wall-to-floor connection
Moment (N-m)
1200 1000 800 600 400 200 0 0
6
12
18
24
30
36
Angle (degree)
Figure 11. Resistance function for the wall-tofloor connection. Experimental data vs. finite element simulation.
42
UN ECE Regulation 66 requires that the superstructure of the vehicle shall have sufficient strength to ensure that the residual space during and after the rollover test on the complete vehicle is uncompromised. This space is defined in [5]. This requirement constitutes a major pass/fail criterion established to provide a minimum survivable volume within the bus that is judged as necessary for mitigation of passengers’ injuries. UN ECE Regulation 66 recognizes the need for finite element simulations as a viable source of information regarding crash and safety assessment of buses.
The wall-to-roof connection was also tested using the same setup, and analyzed by FE models. 4 ROLLOVER AND SIDE IMPACT TESTING AND SIMULATION Most developed bus testing standards can be found in the European Union (EU directives [3-4]) and the United Nations’ Economic Commission for Europe (UN ECE Regulations [5]). Two UN ECE Regulations apply to the passive safety of coaches: Regulation 66 (Strength of Superstructure) and Regulation 80 (Strength of Seats and their Anchorages). Although these regulations are not yet mandatory in all of Europe, they are seriously considered by bus manufacturers during development and approval testing of new buses. UN ECE Regulation 66 describes rollover testing
Figure 13. Setup for side impact by a pickup truck.
Li 5
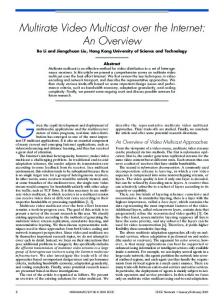
Another major concern about paratransit bus safety is side impact by a midsize pickup truck or an SUV. Due to the design tendency of lowering the bus floors coupled with the high location of bumpers in modern SUVs and pickup trucks, this impact scenario should not be ignored from the comprehensive bus crash and safety assessment program (Figure 13). The tested material properties and validated component models were implemented in the whole bus model. A Ford Econoline chassis model, developed by the National Crashworthiness Analysis Laboratory (NCAC), was adopted to reflect that of the cutaway vehicle used for building the Champion buses. Modifications included extension of the wheelbase, adding wheels, new spring leaves and several others. The model of the bus body was separately developed based on the CAD drawings and was assembled with the chassis model. In the model development process, many questions arose considering mostly connections between the structural elements and their computational representation in the FE model. The model consisted of over 600,000 finite elements, and is described in detail in [8]. It was used to analyze two accident scenarios, 48 km/h, 90o side impact by a pickup truck (Figure 14), and rollover test per Regulation 66 (Figure 15). The results will be presented in future publications.
5
Material characterization and component testing were conducted for a selected paratransit bus. The testing process, setup and results were presented in this paper. Material characterization from laboratory coupon tests was applied for the FE analysis which required reliable material parameters. Connection tests were used in turn for validation of the assumed material models, material properties and contact description at the component level. The validated connection models were implemented in the entire bus model dedicated for comprehensive analysis of the dynamic response of the bus during rollover and side impact accidents. The testing process also allows for close investigation of the major connections which are responsible for keeping the residual space uncompromised per Regulation 66. It is highly possible that a bus with a strong passenger compartment but weak connections will fail the R 66 test. Good balance between the strength of structural members and the strength of connections is recommended for increased crashworthiness and energy absorbing. Comprehensive crashworthiness and safety assessment of the bus in rollover and side impact accidents using the developed FE model is ongoing. The results will be discussed in our next papers. 6
Figure 14. 48 km/h, 90o side impact of the bus by a pickup truck.
CONCLUSION
ACKNOWLEDGEMENT
The study reported in this paper was supported by a grant from the Transit Office of the Florida Department of Transportation titled: “Crashworthiness Assessment of Paratransit Buses”, FSU Project No. 018679, FDOT project BDD 30. Opinions and views expressed in this paper are those of the authors and not necessarily those of the sponsoring Agency. The authors would like to express their appreciation for this generous support and wish to acknowledge the assistance and support from Robert Westbrook, the Project Manager. Thanks are also due to Paul Johnson of the FDOT Transit Office for his commitment, advice, and technical support during this project. Material characterization part of this study was conducted at the Center for Advanced Vehicular Systems (CAVS) at Mississippi State University, while the large-scale connection tests were made at the Structures Laboratory of the Florida Department of Transportation.
Figure 15. Rollover simulation of the bus from a tilt table, per Regulation 66.
Li 6
REFERENCES [1] Paratransit. Wikipedia, http://en.wikipedia.org/wiki/Paratransit. Last modified: August 2006. [2] MatWeb, Material Property Data, online database, http://www.matweb.com. Last accessed: October 2006. [3] Official Journal of the European Communities: Directive 2001/85/EC, November 2001. [4] Office for Official Publications of the European Communities, CONSLEG 2001L0085, http://europa.eu.int/eurlex/en/consleg/pdf/2001/en_ 2001L0085_do_001.pdf, February 13, 2002. [5] Strength of the superstructure of large passenger vehicles, Regulation 66, Revision 1, http://www.unece.org/trans/main/wp29/wp29regs/r 066r1e.pdf, United Nations, February 22, 2006. [6] C S Parenteau et al. 2003. “Field relevance of a suite of rollover tests to real-world crashes and injuries.” Accident Analysis and Prevention, Pergamon Press. 35 103-110. [7] D C Viano, C S Parenteau. 2004. “Rollover Crash Sensing and Safety Overview.” SAE Technical Paper Series, 2004-01-0342. [8] Jeff Siervogel, Leslaw Kwasniewski, Cezary Bojanowski, Jerry Wekezer. 2007. “Parametric study of roll-over test on a paratransit bus,” 15th Anniversary Polish-Ukrainian-Lithuanian Conference, “Theoretical Foundation of Civil Engineering”. Warsaw, Poland.
Li 7