1961 JThB36.pdf
Limits of Maximum-Likelihood Sequence Estimation in Chromatic Dispersion Limited Systems A. Napoli1,2, S. Savory1, B. C. Thomsen1, V. Curri2, P. Poggiolini2, P. Bayvel1, and R. I. Killey1 1. Optical Networks Group, Department of Electronic and Electrical Engineering, University College London, Torrington Place, London WC1E 7JE, UK 2. OptCom, Politecnico di Torino, Corso Duca degli Abruzzi, 24, 10129, Torino, Italy,
[email protected],
[email protected]
Abstract: We experimentally investigated the performance of MLSE in chromatic dispersionlimited 10 Gb/s links, and assessed the limits in terms of the number of states and A/D converter sample rate, up to 40 GSa/s.
© 2006 Optical Society of America OCIS codes: (060.4510) Optical communications; (120.7000) Transmission; (060.2360) Fiber optics links and subsystem
1. Introduction During the last decade, there has been growing interest in electronic equalization (EE) techniques as a means to compensate optical fiber transmission impairments. In particular, linear effects causing intersymbol interference (ISI) such as chromatic dispersion (CD) and polarization mode dispersion (PMD) have been studied in depth. The work started after the publication of [1] by Winters and Gitlin in 1990, in which the authors introduced for the first time the concept of using EE in optical communication systems. Initially, the research dealt with feed-forward equalizers (FFE) and decision feedback equalizers [2]. These equalization techniques were based on finite impulse response (FIR) filters, where an important issue concerns the coefficients optimization. Although FFE and DFE allow performance improvements, due to their quasi-linearity, they cannot fully compensate the ISI generated by CD in optical communication systems. In fact, due to the photodiode square-law conversion, the ISI produced by CD becomes non-linear, even though the effect generating is linear. Recently, maximum-likelihood sequence estimation techniques (MLSE) [3, 4], that have been widely used in radio frequency systems, have been applied to optical communication systems [2, 5, 6]. A receiver implementing MLSE results in the optimum receiver as it calculates the most likely received sequence, but presents as a main drawback time-consuming processing, which can be reduced by applying the Viterbi algorithm (VA) [3, 4]. In this work we assess the performance of an MLSE based receiver in chromatic dispersion limited links at 10Gbit/s with respect to the number of states and samples/bit (Sa/b) in order to understand the limits of the MLSE technique. 2. System Setup We considered an optically uncompensated link, carrying a PRBS1 of length 27-1, at a bit-rate of 10 Gb/s and with a launched power of 0 dBm, in order to keep non-linearities negligible. The NRZ-OOK format signal was transmitted through standard SMF (Dispersion 17ps/nm/km), with lengths varied from 0 km (back-toback) up to 211 km, in steps of approximately 40 km. Noise loading at the receiver was carried out by coupling a variable amount of ASE with the signal before the receiver. The receiver consisted of an EDFA followed by an optical filter with a bandwidth of 0.6 nm. The OSNR was measured before the gaussian optical filter within a 0.1nm bandwidth. After the optical filter, the signal was detected by a PIN and then filtered by a 5th order low pass Bessel filter, with a bandwidth of 7 GHz. Finally, we used an ADC converter (Tektronix TDS6154C real-time oscilloscope) with a sample rate of 40 GSa/s, with an effective number of 4.3 bits of quantization at 10 GHz, and stored the samples in memory. The MLSE was carried out offline 1
We point out that as we considered a maximum of 32 states with the MLSE, the 27-1 PRBS length results in each possible sequence occurring 4 times over the wordlength, with the only exception of 00000 which occurs 3 times.
1961 JThB36.pdf
using Matlab. We considered MLSE implementations with 2 (equivalent to optimal threshold), 4, 8, 16 and 32 states, and with 1, 2 and 4 Sa/b. For the case with 1 Sa/b we chose the optimum sampling instant, while for the case with 2 Sa/b, we randomly selected one set of values, from the two available from the 40 GSa/s measurement, with a uniform spacing of 50 ps. Finally, for the case with 4 Sa/b, we used all the samples, separated in time by 25 ps. The MLSE was implemented by means of the Viterbi algorithm [3, 4]. We approximated the noise statistics with the standard Gaussian model, in which mean and variance were evaluated for every single case by transmitting a training sequence. The considered metric used in the trellis code was m(i, j ) = ∑ (ri − µ i ) 2 /( 2σ i ) + m(i, j − 1) samples
where ri stands for received bit, µι and σι are the mean and variance of the currently received bit, and m(i,j1) is the metric of the old states. The first part of the expression can take into account all the considered samples (1, 2 or 4) 40 GSa/s (Tektronix scope)
ADC
TX
MLSE
Optical link EDFA
ASE source
Attenuator
Optical Filter
Electrical Filter
( BW = 0.6 nm )
( BW = 7 GHz )
Optical Filter BW = 3 nm
Fig. 1 Experimental setup. The 40 GSa/s ADC was carried out using a Tektronix TDS6154C real-time oscilloscope
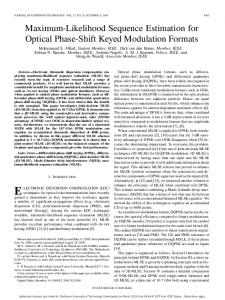
3. Results We evaluated the system performance in terms of required OSNR [dB] as a function of the distance [km], at a measured BER of 10-3, representing the limit for FEC. Fig. 2(a) shows the calculated log10(BER) vs. number of states used in the MLSE when we consider 2 Sa/b as the link length is varied from 40-210km. The OSNR at the receiver was fixed at 12.5dB. The MLSE is performed over 32000 bits and the BER is evaluated by error counting in order to achieve a confidence interval of 95 % at a BER of 10-3 [7]. We see that the system performance is improved in all cases as the number of states is increased, however there is a tradeoff between BER performance and processing complexity which grows exponentially with the number of states. In fact, by considering the maximum distance considered in the experiments (211.7 km) and an input optical spectrum of about 0.16 nm, we conclude that dispersion will lead to ISI that is spread over about 5 bits (3505 ps/nm at 211.7 km), implying the use of 32 states. In Fig. 2(b) we plot the required OSNR to give a BER of 10-3 as a function of the link distance obtained from experiments. Firstly, we observe that a MLSE receiver with 1 Sa/b provides only a slight improvement to the performance obtained by considering FFE and DFE [2]. In particular, considering the distance reached with an OSNR penalty of 2dB, in the case of 1Sa/b, this distance was approximately 100 km (i.e. 1700 ps/nm), in agreement with [6]. Finally, we measured in this case similar performance for 4, 8, 16, and 32 states. In contrast, the dashed curves, implementing 2Sa/b, show a considerable improvement in compensation performance. We report an improvement (compared to the case with only one sample per bit) at a 2dB OSNR penalty of 50km for the case with 4 and 8 states, of about 90km for the case with 16 states, and for 32 states, we observe an improvement of 110 km, allowing a transmission distance of 211.7 km with BER=10-3. Beside the significant improvement with more than 1 Sa/b, adding more states consistently allows further gains. In particular, we measured a gain of more than 100 km when increasing the number of states from 4 to 32. Fig. 2 (b) also plots the results with 4Sa/b, clearly showing that little further improvement is apparent when implementing a MLSE with more than 2Sa/b. We observed in this case only slight variations compared
1961 JThB36.pdf
to the case with 2Sa/b, however this may change if we were to consider the correlation between the samples. These results provide a set of rules concerning the trade-off between the number of states and the number of bits to be considered, with 2 Sa/b being sufficient to obtain the best performance when combined with 16 or 32 states.
16 w ithout MLSE
15
lo g 1 0 (B E R )
Required OSNR [dB]
increasing link length
-2
40 km 80 km 120 km 170 km 210
increasing the number of states 14
4 16
8
1 sa/bit 13
32
-3 12
2/4 sa/bit
-4 0
4
8
16 Number Of States
32
11
0
50
Fig. 2 a
100
150
200
Length [km]
Fig. 2 b
Fig. 2 (a). Simulations results investigating the choice of the minimum value for the number of states to be considered, (b) Required OSNR0.1nm [dB] versus fibre length [km], with 1 Sa/b (dashed lines), 2 Sa/b (solid lines) and 4 Sa/b (dot-dashed lines). The solid line on the left side shows the case without MLSE (i.e. 2 states MLSE)
4. Conclusions For the first time, to the best of our knowledge, we report a comprehensive analysis of the performance of maximum likelihood sequence estimation on an experimental chromatic dispersion limited system, when the number of states and the A/D converter sampling rate are varied. We find that the MLSE provides near optimum performance with 2Sa/b and 16 states, allowing for transmission over 210km of uncompensated standard single mode fiber with an OSNR penalty of only 2.60dB. In addition it is shown that further increasing the sampling rate does not provide significant improvement. Acknowledgements This work was supported by UK EPSRC and the EU FP6 Network of Excellence E-Photon/ONe, WP5 and WP10 References [1] J.H. Winters and R.D. Gitlin, “Electrical signal processing techniques in long-haul fiber-optic systems”, IEEE Transactions on Communications, vol. 38 , no. 9, 1990, pp. 1439 – 1453. [2] H. Bülow, “Electronic equalization of transmission impairments”, in Proc. OFC 2002, pp. 24 - 25 [3] S. Benedetto and E. Biglieri, “Principles of Digital Transmission with Wireless, Applications”, chap. 7, Prentice Hall, 1987 [4] D. Forney, “Maximum-Likelihood Sequence Estimation of Digital Sequences in the Presence of Intersymbol Interference”, IEEE Trans. On Information Theory, vol. IT-18, n. 3, may 1972 [5] M. Cavallari, C.R.S. Fludger, P.J. Anslow, “Electronic Signal Processing for Differential Phase Modulation Formats”, in Proc. OFC 2004, paper TuG2 [6] A. Faebert et al. “Performance of a 10.7 Gb/s receiver with digital Equaliser using Maximum-Likelihood Sequence Estimation”, in Proc. ECOC 2004, Proceedings PD-Th4.1.5, Stockholm, Sweden [7] Jeruchim M, “Techniques for Estimating the Bit Error Rate in the Simulation of Digital Communication Systems”, IEEE Journal on Selected Areas in Communications, vol. SAC-2, n. 1, January, 1984