Limits on routine wavefront sensing with NIRCam on JWST Anand Sivaramakrishnana , Ernie C. Morsea , Russell B. Makidona , Louis E. Bergerona , Stefano Casertanoa , Donald. F. Figera , D. Scott Actonb , Paul D. Atchesonb , and Marcia J. Riekec a Space b Ball c Steward
Telescope Science Institute, 3700 San Martin Drive, Baltimore, MD, USA
Aerospace and Technology Company, P. O. Box 1062, Boulder, CO 80631, USA Observatory, University of Arizona, 933 N. Cherry Avenue, Tucson AZ 85721, USA ABSTRACT
The James Webb Space Telescope (JWST) will be a segmented, deployable, infrared-optimized 6.5m space telescope. Its active primary segments will be aligned, co-phased, and then fine-tuned in order to deliver image quality sufficient for the telescope’s intended scientific goals. Wavefront sensing used to drive this fine tuning will come from the analysis of defocussed phase diverse images taken with its near-IR science camera, NIRCam. Here we concentrate on routine maintenance of the JWST primary, as might be expected to occur on a more or less monthly timescale after the telescope is commissioned. We carry out an end-to-end optical and wavefront sensing simulation, starting from the primary mirror figure, calculating a noiseless point-spread function as it would appear on the detector, inject noise sources due to photon statistics, as well as detector and electronics characteristics (as measured in Rockwell HAWAII-2RG detectors in the lab), and reduce the data with a simple scheme to create one realization of a full wavefront sensing operation. We generate JWST point-spread functions for a given OPD map on a JWST pupil with -6, -3, 3, and 6 waves of focus, and simulate three realizations of the same exposure. We start with a mirror figure that provides a point-spread function (PSF) that is just under the acceptable specification for JWST’s Strehl ratio, which is 80% at 2 microns in NIRCam. We do not include zodiacal light, diffuse sources, or contamination by other stars in our simulation. Our up-the-ramp exposures include a model of cosmic ray contamination of the data. We calibrate the image to account for dark current and flat field variation, and process the images with an implementation of the Misell-Gerchberg-Saxton algorithm assuming a known pupil support function. Our entire process is described here, to document a tool that helps to verify our intended method of maintaining the JWST PSF within specificatiuons during routine science operations. Keywords: JWST wavefront sensing and control, NIRCam image simulation, HAWAII-2RG detector noise, phase-diversity, focus-diversity, Misell Gerchberg-Saxton phase retrieval
1. INTRODUCTION The 6.5m James Webb Space Telescope (JWST) is required to use image-based wavefront sensing to maintain a Point-Spread Function (PSF) that possesses a Strehl ratio of 80% at a 20% bandwidth filter centered at 2 microns. An early design decision to use data obtained by JWST’s near-IR camera, NIRCam, as the wavefront sensing camera was made. We report on early results of an experiment to determine how well the JWST optical path delay (OPD) can be characterized given actual laboratory measurements of NIRCam detector behavior. Detector characteristics were measured in the STScI/JHU Independent Detector Testing Laboratory (Figer et al.1 ). We combine these results with assumptions of JWST pupil geometry and primary mirror segment control, as well as a knowledge of the read patterns and data reduction methods of the NIRCam detectors. We use the model for cosmic ray rates taken from Offenberg et al..2 Further author information: (Send correspondence to A.S.: E-mail:
[email protected])
Optical, Infrared, and Millimeter Space Telescopes, edited by John C. Mather, Proceedings of SPIE Vol. 5487 (SPIE, Bellingham, WA, 2004) 0277-786X/04/$15 · doi: 10.1117/12.551243
909
This work is a continuation of the project described by Sivaramakrishnan et al..3 Our work differs from other studies of this topic in that it utilizes actual detector noise rather than an abstract, algorithmic, ‘noise model’ for JWST data simulations. Our simulations incorporate real electronics read noise and various detector and electronics non-linearities using measured properties of HAWAII-2RG HgCdTe focal plane array detectors, in addition to realizations of Poisson statistics and cosmic ray effects, Our interest is in creating a tool which can be used to study the NIRCam data and calibration quality required to enable wavefront measurements which meet requirements set by JWST science drivers. Once we establish the basic approach to this problem, future studies can use our methods to develop detailed quantitative estimates to flow high level JWST wavefront sensing and control requirements down to the detector and calibration levels. We produce the first data-based estimate of the accuracy with which we can sense the JWST PSF during science operations, using actual detector data rather than a theoretical ‘noise model’ for the detector.
2. NIRCAM AS A WAVEFRONT SENSOR NIRCam is a near-IR imaging camera sensitive to a wavelength range of 0.6–5.0 microns (see e.g., McCullough et al.4 ). Its short wavelength arm (0.6–2.3 micron) is to be used for wavefront sensing (WFS) in order to maintain PSF quality on JWST, using image-based focus-diverse wavefront sensing. NIRCam possess a filter wheel and a pupil wheel. The pupil wheel has four slots which contain weak lenses intended to introduce different amounts of defocus into the beam. This provides the diversity in phase for wavefront sensing purposes. The Misell-Gerchberg-Saxton algorithm5, 6 with a known pupil geometry is used to recover the JWST OPD as seen from the field point in question. We do not treat field-dependent aberrations here. In order to model the NIRCam PSF, we assume a Nyquist pixel scale at a wavelength of 2 microns of 0.031 arcseconds per pixel, although we accounted for the pixel modulation transfer function (pixel MTF) when generating our monochromatic images. Future studies can address the case of broad band focus-diverse WFS with NIRCam.
3. POINT-SPREAD FUNCTION SIMULATION Our PSFs are generated with -6, -3, 3 and 6 waves of defocus to create a noiseless image which is a probability density function describing the distribution of a single photon on the detector. A single realization of phase errors over the 18-segment, 6.5 m diameter JWST pupil was created, using a set of segment phase aberrations which produce a marginally acceptable JWST PSF, with a Strehl ratio of 78% This is 2% below the stated 80% Strehl ratio required of JWST at 2 microns. Figures 1 and 2 shows the OPD and PSF used. Segment gaps are not modelled in this study — the mirror surface is assumed to be continuous except at the edges of the primary, and the edge around the missing central segment. Structures supporting the secondary were also not modelled.
4. DETECTOR SIMULATION The more defocussed PSFs (with 6 waves of defocus) were boosted in strength relative to the smaller 3-wave defocus PSFs by a factor of 6, in order to create the same count rates when they were all placed on the same detector and read out. This relative weighting means that a 60 second exposure on an image containing all four PSFs will correspond to 60 seconds of exposure on the 3-wave defocus PSFs, and a 360 second exposure on the 6-wave defocus PSFs. Placing all four PSFs on the same simulated detector (see Figure 3) enabled a single chip read to be simulated on a pixel-by-pixel basis, thus reducing the computational time and disk space required for the study. Details of our detector read simulation can be found in Sivaramakrishnan et al..3 The Python code described there was rewritten in IDL, and improved in its ability to reproduce the pixel domains of the four output amplifiers that will be used in NIRCam. Since our laboratory results were acquired with an analog-to-digital converter
910
Proc. of SPIE Vol. 5487
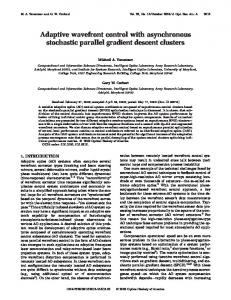
Figure 1. A linear greyscale rendition of the optical path delay (OPD) map used to describe the JWST pupil at the NIRCam short wavelength arm wavefront sensing field location. The variance of the phase is of t he order of 0.25 square radians.
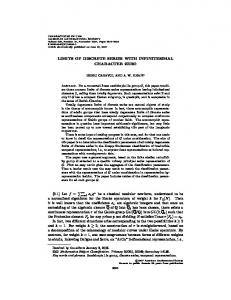
Figure 2. Left: A logarithmically-stretched image of the monochromatic point-spread function (PSF) generated from the OPD map in Figure 1. The numerical sampling of the PSF array is twice the Nyquist sampling at a wavelength of 2 microns. The Strehl ratio of this PSF is 78%, just below 80%, the lowest acceptable 2 micron Strehl for JWST/NIRCam. Right: the PSF after error-free segment actuation to fix the correctable part of the measured wavefront aberration. This final corrected image has a Strehl ratio of over 99%, with 11.3 nm rms error in the phase measurement. Detector noise adds about 10 nm rms compared to the noiseless case.
Proc. of SPIE Vol. 5487
911
Figure 3. Top right: noiseless point-spread functions (PSFs) generated on a Nyquist-sampled spatial scale with four different amounts of defocus (shown on a linear stretch). From the bottom left, in clockwise order, the defocus is -6, -3, 3, and 6 waves of defocus at the edge of a circumscribing circle around the pupil. The bottom PSFs, with 6 waves of defocus, have been multiplied by a factor of 6 relative to the two upper PSFs, in order to keep the average brightness of pixels in the images similar. This image is then read by a detector simulator. Top left and bottom row: simulated HAWAII-2RG raw 16-bit signed integer data from three independent exposures corresponding to similar mean intensities in the cores of the defocussed PSF. The total number of photo-electrons recorded in the smaller PSFs (with 3 waves of defocus) is 1.0e7. The larger PSFs, with 6 waves of defocus, have six times more exposure. This is simulated by multiplying the more extended PSFs by a factor of 6 relative to the smaller PSFs, rather than simulating a full read sequence with six times more exposure (see text for details). A 60 second exposure on this composite 4-PSF image is simulated.
912
Proc. of SPIE Vol. 5487
(ADC) that saturated at 60,000 electrons we used this as the limit of exposure depth in our simulated PSFs. NIRCam detectors will be usable up to 80,000 electrons in a pixel before saturation starts to occur. The electronics settling time is determined by the effective RC time constant of the electrical connection between a pixel and the ADC. This is expected to be primarily due to cables, though multiplexer (MUX) and pixel capacitances could also be a contributing factor. The electronics settling time was set to 600 ns in these simulations, in accordance with lab measurements. The pixel read period to be used on NIRCam is 10 microseconds, 17 times longer than the in-lab settling time. Further discussion on this topic can be found in Sivaramakrishnan et al..3 Starting with the four appropriately scaled defocussed PSFs on a single chip, we created a ‘countrate’ file which produced 60,000 photoelectrons in the brightest pixel of the entire image when read out after a minute. The detector was read over a simulated 60 second exposure with a total of 6 reads after an initial full-chip reset, following the pattern used in our lab data. We added each simulated read sequence to existing individual dark frames, thus introducing real electronics noise to the simulated data. The effects of pixel-to-pixel sensitivity variation was also folded in by way of multiplication by a unitymedian flat field taken from lab measurements. The flat for a particular temperature was constructed from three normalized flats (using J, H, and K filters). Each of these normalized flats was made by median filtering 3 double-correlated sample frames in each filter, rescaling each filter’s flat to be a unity-median frame, and then calculating the arithmetic mean of the three frames. Our cosmic ray model mimics that of Offenberg et al.,2 although we changed the geometry of that model to distribute cosmic rays uniformly in solid angle. This resulted in more grazing angle cosmic ray hits than were predicted with the Offenberg et al. code. We rewrote the cosmic ray simulation code in IDL to maintain uniformity of language, and to understand the algorithms properly. Our simulation understimates the effects of cosmic rays in the longer exposures, since we increased the brightness of the larger, fainter PSFs by a factor of six and placed them on the same image as the smaller PSFs to enable a single chip read simulation to create an entire wavefront sensing exposure. Future work can determine whether this underestimation of cosmic ray hits is significant. We generated three independent realizations of an exposure containing the four defocussed PSFs in the simulation, with single instances of actual dark current frames being added to each exposure on a read-by-read basis.
5. DATA REDUCTION The three exposures were median-filtered to reduce cosmic ray effects (Figure 4). The appropriate dark current was subtracted from the raw data: we median-filtered 6 dark frames with the same exposure pattern as our data to create the dark current calibration image. (Figure 5). We note that our lab data acquisition paradigm was tailored to the longer, 1000 s, 10-read sample-up-theramp science exposures that might be commonly used on NIRCam. In order to utilize this lab data we used the first 6 reads in the up-the-ramp, non-destructive read sequence to provide us with real detector noise for a 6-read sequence up the ramp, even though the intervals between our simulated reads was of the order of 10 s rather than the in-lab value of 100 s. If amplifier glow is significant our simulated read sequence will have different noise properties than the actual read sequence. However, a two-read 60 s exposure is likely to possess similar noise properties to the patterns used in the lab, all other factors remaining the same. We created a double-correlated sampling by subtracting the starting read from the last read (Figure 6). In reality other exposure sequences could be used to increase the dynamic range and data quality (e.g., Fowler and Gatley7 ). Letting some pixels saturate during the exposure, and averaging groups of multiple reads together (see the read patterns described in McCullough et al.4 for details) can substantially improve data quality. The double-correlated, cleaned, dark-subtracted, data are then corrected by division by a flat field image (Figure 7). Since flat field structure depends on temperature as well as wavelength, it is possible for us to use the ‘wrong’ flat in this step to determine WFS sensitivity to incorrect temperature flats or flats taken with spectra that differ from the WFS target star. In this exercise we used the correct flat field — i.e., the same flat we
Proc. of SPIE Vol. 5487
913
Figure 4. Median filtering of the three exposures shown in Figure 3 removes most of the cosmic ray contamination. For longer exposures, more exposures may be required to filter out cosmic rays more effectively.
Figure 5. Subtraction of the dark current image for the same read patern used to collect the data in Figure 3.
914
Proc. of SPIE Vol. 5487
Figure 6. Subtraction of the last read from the first read of the detector produces the double-correlated sample (DCS) image shown here. Electronic read noise can be reduced (up to a point) by averaging several non-destructive reads at the start and end of the exposure. We simulate the worst case of a single read at each endpoint of the exposure duration.
used to introduce the pixel-to-pixel variation in our data. This kind of temperature sensitivity study may be more relevant to commissioning the JWST telescope, when temperatures could still be changing secularly as the entire structure cools down. In order to study the sensitivity of the WFS process to spectral differences between calibration data and the target star, more lab data will have to be taken, or we will have to model the process using existing J, H, and K flat field data.
6. CONCLUSION Even with our simple data reduction of simulated raw NIRCam WFS data we are able to measure the JWST wavefront aberrations well enough to improve the PSF considerably. The rms difference between the actual phase and the estimate of the phase is 11.3 nm rms, with detector noise contributing 10 nm rms to this error. However, there is room for considerable improvement in data quality and calibration in the wavefront sensing scheme described here. The data reduction process we used in this study is rudimentary compared to the HST NICMOS data reduction pipeline (Bushouse et al.8 ). Bad pixels can be removed using dithered observations, or with more sophisticated interpolation over known locations. Up-the-ramp image processing is also better at detecting and removing the effects of cosmic rays, and can be used in combination with dithering (STScI NICMOS Instrument Team,9 Dickinson et al.10 ). It can also provide better signal over a larger photometric dynamic range than is present in these simulated data. Multiple end-point reads (three to six non-destructive reads at each end point) will reduce electronic read noise in each image without increasing data volume, as end-point averaging will be probably be done on board the spacecraft. With the same observing strategy used in this study (three exposures per PSF), small dithers between the exposures will help reduce the effect of flat field calibration errors further. If more improvement in flat field quality is still desired, flat fields using light whose spectrum matches the target star spectrum better
Proc. of SPIE Vol. 5487
915
Figure 7. Dividing by the flat field of the detector accounts for pixel-to-pixel quantum efficiency variations in the detector. This image shows the presence of dead or unreliable pixels that exist on the detector used to create the flat field image in the lab. The pixels that show up as bright spots will be removed by JWST pipeline processing of NIRCam data. Here they are flagged by being given artificially high values to indicate their positions in the image. If such pixels are a problem, exposures can be dithered to filter out their effects more efficiently.
can be used. Furthermore, the flat fields used in our study have not had their reference pixels used to remove bias drifts, and could therefore be improved upon. Sensitivity of WFS to the temperature-dependence of flat fielding accuracy can be studied using our methods, since the STScI/JHU Independent Detector Testing Laboratory has measured this variation. More work is needed to quantify the way the JWST OPD measurement depends on detector and electronics properties as well as data reduction methods. The basic premise of using NIRCam imaging data and the MisellGerchberg-Saxton algorithm to retrieve the JWST phase has been demonstrated to some degree here with real infrared focal plane array data. With reduction of detector noise by about a factor of two compared to our simulated data, routine wavefront sensing should be able to meet its allocated wavefront error budget. We have developed a tool for the JWST project to explore this routine WFS issue, although our simulations can also be used in other WFS contexts. The existence of this tool enables a refinement current science exposure time estimates, as well as a study of the way the JWST Fine Guidance System will perform — we are able to perform each pixel read in a manner consistent with the exact timing and exposure pattern that will be implemented by the control electronics reading out all of JWST’s HAWAII-2RG detectors.
ACKNOWLEDGMENTS We thank John Krist for helpful advice during the course of this investigation. Some software used in this study was developed with support from Space Telescope Science Institute’s Director’s Discretionary Research Fund and Research Programs Office, NSF grant AST-0088316, and the National Science Foundation Science and Technology Center for Adaptive Optics, managed by the University of California at Santa Cruz under cooperative agreement No. AST-9876783.
916
Proc. of SPIE Vol. 5487
REFERENCES 1. D. F. Figer, B. J. Rauscher, M. W. Regan, J. C. Balleza, R. H. Barkhouser, L. E. Bergeron, G. R. Greene, S. Kim, S. R. McCandliss, E. Morse, R. Pelton, T. Reeves, U. Sharma, P. Stemniski, H. S. Stockman, and M. Telewicz, “Independent detector testing laboratory and the NGST detector characterization project,” in IR Space Telescopes and Instruments. Edited by John C. Mather. Proceedings of the SPIE, Volume 4850, pp. 981-1000 (2003)., pp. 981–1000, Mar. 2003. 2. J. D. Offenberg, R. J. Hanisch, D. J. Fixsen, H. S. Stockman, M. A. Nieto-Santisteban, R. Sengupta, and J. C. Mather, “Multi-readout data simulator,” LANL Archives arXiv:astro-ph/0005403, 2000. 3. A. Sivaramakrishnan, R. B. Makidon, D. F. Figer, R. I. Jedrzejewski, H. A. Bushouse, J. E. Krist, H. S. P. Stockman, P. Hodge, N. M. Dencheva, B. J. Rauscher, V. G. Laidler, C. M. Ohara, D. C. Redding, M. Im, and J. D. Offenberg, “NIRCAM image simulations for NGST wavefront sensing,” in IR Space Telescopes and Instruments. Edited by John C. Mather. Proceedings of the SPIE, Volume 4850, pp. 388-397 (2003)., pp. 388–397, Mar. 2003. 4. P. McCullough, S. Horner, D. Kelly, and M. J. Rieke in JWST NIRCam Operations Concept NIRCam DRD-OPS-11 JWST-OPS-002843 NIRCam007, 2003. 5. R. H. Gerchberg and H. O. Saxton, “A practical algorithm for the determination of phase from image and diffraction plane pictures,” Optik 35(2), pp. 237–246, 1972. 6. D. L. Misell, “A method for the solution of the phase problem for electron microscopy,” J. Phys. D 6, pp. L6–L9, 1973. 7. A. M. Fowler and I. Gatley, “Demonstration of an algorithm for read-noise reduction in infrared arrays,” Astrophysical Journal Letters 353, pp. L33+, Apr. 1990. 8. H. A. Bushouse, C. Skinner, and J.MacKenty, “The STScI NICMOS pipeline CALNICA, single image reduction,” in STScI Instrument Science Reports: NICMOS ISR-97-029, Space Telesecope Science Institute, 1997. 9. STScI NICMOS Instrument Team in NICMOS Instrument Handbook for Cycle 12, Baltimore STScI, 2002. 10. Dickinson, M. E. et al. in HST NICMOS Data Handbook v. 5.0, B. Mobasher, ed., Baltimore STScI, 2002.
Proc. of SPIE Vol. 5487
917