Linear Invariant Tensor Interpolation Applied to Cardiac Diffusion Tensor MRI Jin Kyu Gahm1,2 , Nicholas Wisniewski3 , Gordon Kindlmann5 , Geoffrey L. Kung1 , William S. Klug4 , Alan Garfinkel3 , and Daniel B. Ennis1 1
Department of Radiological Sciences, UCLA, CA 90095, USA Department of Computer Science, UCLA, CA 90095, USA 3 Department of Medicine (Cardiology), UCLA, CA 90095, USA Department of Mechanical and Aerospace Engineering, UCLA, CA 90095, USA Computer Science Department, University of Chicago, Chicago, IL 60637, USA
[email protected] 2
4 5
Abstract. Purpose: Various methods exist for interpolating diffusion tensor fields, but none of them linearly interpolate tensor shape attributes. Linear interpolation is expected not to introduce spurious changes in tensor shape. Methods: Herein we define a new linear invariant (LI) tensor interpolation method that linearly interpolates components of tensor shape (tensor invariants) and recapitulates the interpolated tensor from the linearly interpolated tensor invariants and the eigenvectors of a linearly interpolated tensor. The LI tensor interpolation method is compared to the Euclidean (EU), affine-invariant Riemannian (AI), log-Euclidean (LE) and geodesic-loxodrome (GL) interpolation methods using both a synthetic tensor field and three experimentally measured cardiac DT-MRI datasets. Results: EU, AI, and LE introduce significant microstructural bias, which can be avoided through the use of GL or LI. Conclusion: GL introduces the least microstructural bias, but LI tensor interpolation performs very similarly and at substantially reduced computational cost.
1
Introduction
Diffusion tensor magnetic resonance imaging (DT-MRI) [1] is a technique that permits the non-destructive evaluation of the self-diffusion tensor (D) of water within small volumes of soft tissues. The measured diffusion tensor can be used to characterize local microstructural tissue properties, including diffusive shape and microstructural orientation. Diffusion tensor shape and orientation properties are important components of computational models of cardiac mechanics and electrophysiology that require closely spaced nodes that do not necessarily lie at lattice points. DT-MRI data are, however, acquired at lattice points within a three-dimensional imaging volume, therefore tensor interpolation methods are needed. Each diffusion tensor is a three-dimensional rank-2 symmetric, positive definite tensor that can be decomposed into a system of eigenvalues (λi ) and eigenvectors (ei ), which correspond to tensor shape and orientation respectively. N. Ayache et al. (Eds.): MICCAI 2012, Part II, LNCS 7511, pp. 494–501, 2012. c Springer-Verlag Berlin Heidelberg 2012 ⃝
Linear Invariant Tensor Interpolation Applied to Cardiac DT-MRI
495
In particular, tensor shape can be described by families of tensor invariants [2, 3], which saliently decompose tensor shape into the magnitude-of-isotropy (tensor trace, determinant or norm), magnitude-of-anisotropy (fractional or relative anisotropy) and mode-of-anisotropy (transversely isotropic vs. orthotropic) components. The primary eigenvector corresponds to the direction of fastest diffusion, which has been shown to align with the long axis of the myocytes that comprise the heart [4]. The secondary and tertiary eigenvectors correspond to the crossfiber-within-sheet direction and the sheet normal direction, respectively [4]. Because these shape and orientation characteristics directly correspond to microstructural features that are observed with histology, it is judicious to linearly interpolate all of these tensor properties directly. The simplest tensor interpolation method is the Euclidean (EU) method, but it suffers from the swelling effects due to non-monotonic interpolation of tensor determinant (DET), and does not preserve the positive definiteness of diffusivity. The Riemannian approaches [5–8] overcome this problem, and more recently the log-Euclidean (LE) method [9] has been shown to be a computationally efficient approximation to the affine-invariant (AI) Riemannian approach [8]. Kindlmann et al. [10] proposed a geodesic-loxodrome (GL) approach that guarantees monotonic interpolation of orthogonal tensor invariants, and demonstrated that the EU, AI and LE approaches fail to monotonically interpolate all the tensor invariants including tensor trace (TR), fractional anisotropy (FA) and tensor mode (MODE). The geodesic-loxodrome approach, however, is computationally expensive, and monotonic interpolation of the tensor invariants needs to be evaluated using experimentally measured DT-MRI data. Recent studies have examined different methods to interpolate separately tensor shape and orientation [11, 12]. Bi et al. [11] proposed a method to linearly interpolate eigenvalues and rotation angles between tensor orientations. This results in monotonic interpolation only for TR. Bi et al. did not provide a way to resolve the sign ambiguity of the eigenvectors. Yang et al. [12] proposed a method to resolve the sign ambiguity problem by finding the minimum rotation path between tensor orientations, but the minimum rotation path may not be the best way to resolve the sign ambiguity problem. Firstly, we propose a new linear invariant (LI) tensor interpolation method, which linearly interpolates components of tensor shape (tensor invariants). We also define for the first time the necessary mathematics for converting the tensor invariants to eigenvalues, which enables recapitulation of the interpolated tensor from the linearly interpolated tensor invariants and the eigenvectors of a linearly interpolated tensor. The LI tensor interpolation method is simple to implement, fast, and perfectly commutative. Secondly, we determine which tensor interpolation scheme introduces the least microstructural bias to the shape and orientation of the interpolated tensors. To do so the LI tensor interpolation method is compared to the EU, AI, LE and GL methods of tensor interpolation using both a synthetic tensor field that reflects important myocardial tensor field attributes, and three experimentally measured DT-MRI datasets from rabbit, pig and human hearts.
496
2
J.K. Gahm et al.
Theory
A tensor invariant set composed of TR (K1 , magnitude-of-isotropy), FA (R2 , magnitude-of-anisotropy) and MODE (R3 , mode-of-anisotropy) fully decompose the shape of a tensor D defined by [2, 3]: ! √ " R3 (D) = 3 6 det(D/| " D|) " , (1) K1 (D) = tr(D), R2 (D) = 32 |D|/|D|,
where tr() and det() are the trace and determinant operators respectively, |D| # represents the magnitude (Frobenius norm) of D defined by |D| = tr(DDT ), " represents the anisotropic (deviatoric) part of D defined by D " = D− and D tr(D)I/3. Linear invariant (LI) interpolation of tensor CLI from tensors A and B with weighting coefficient t ∈ [0, 1] starts by linearly interpolating the tensor invariants: K1 (CLI ) = (1 − t)K1 (A) + tK1 (B), Rj (CLI ) = (1 − t)Rj (A) + tRj (B) , (2) for j = 2, 3. Without derivation we define the mathematics for converting the tensor invariants into the eigenvalues by solving the cubic characteristic polynomial for a tensor: $ % arccos (R3 ) + Pi 2K1 R2 1 cos λi = 3 K1 + # , (3) 3 3 3 − 2R22
where Pi = 0, −2π, 2π for i = 1, 2, 3. Then Eq. 3 permits converting the tensor invariants of CLI into the eigenvalues λi (CLI ). To define the eigenvectors for CLI , we use linear (EU) tensor interpolation CEU = (1 − t)A + tB, then decompose CEU into the eigenvector and eigenvalue matrices REU and ΛEU where CEU = REU ΛEU RTEU . We can use AI, LE or GL tensor interpolation, but EU is the simplest and fastest, and introduces a similar bias in tensor orientation recovery, as will be shown later in Section 4. Finally the interpolated tensor CLI is constructed using the eigenvalue matrix ΛLI = diag (λi (CLI )) from the linearly interpolated tensor invariants, and the eigenvector matrix REU from the linearly interpolated tensor : CLI = REU ΛLI RTEU .
3
(4)
Methods
Synthetic Tensor Field. Using the EU, LE, GL and LI tensor interpolation methods, bilinear interpolation was performed between tensors that approximate the sheet shape of (K1 , R2 , R3 ) = (7, 0.6, 0.5) and fiber shape of (6, 0.7, 1) observed in cardiac DT-MRI data, and range of tensor orientations. Real Cardiac DT-MRI Acquisition. The rabbit heart DT-MRI data was acquired in a formalin fixed rabbit heart using a 7T Bruker Biospin scanner and a 3D fast spin echo sequence. Five non-diffusion weighted and twenty-five diffusion
Linear Invariant Tensor Interpolation Applied to Cardiac DT-MRI
497
weighted (b-value = 1000 s/mm2 ) imaging volumes were used to estimate the local D without zero padding and with linear regression. The imaging parameters were TE/TR = 29.1/550 ms, RARE factor two, FOV = 35 × 35 × 35 mm, and a 96 × 96 × 72 encoding matrix – resulting in 365 × 365 × 528 µm spatial resolution. The porcine heart DT-MRI data was acquired using 2D multislice readout segmented EPI, similar encoding directions and reconstruction method with the following imaging parameters: TE/TR = 80/6800 ms, FOV = 150 × 150 × 129 mm, and an 150×150×43 encoding matrix – resulting in 1×1×3 mm spatial resolution. The high-resolution human heart DT-MRI data was downloaded from Johns Hopkins University [13]. The FOV was 110 × 110 × 110 mm, the encoding matrix size was 256 × 256 × 134, and the spatial resolution was 0.430 × 0.430 × 1.0 mm. Interpolation Evaluation. Each DT-MRI volume was segmented to identify the myocardium using thresholding and morphologic operations on the nondiffusion weighted image volume. To evaluate each interpolation method the measured (“truth”) tensor volume was first downsampled in each direction by a factor of 2 for the rabbit and porcine heart data, and by a factor of 4 for the high-resolution human heart data. Subsequently tensors were trilinearly interpolated at the positions of the removed tensors using the remaining data. This permits a direct, paired comparison of the interpolated tensors to the “truth” tensors using data de-correlation and bootstrap statistics (see below). This comparison was made for six tensor scalar measures (TR, FA, MODE, DET, angle difference between primary eigenvectors, and log-Eugclidean tensor distance [9]) computed at each location of the interpolated tensors using each of the tensor interpolation methods. Tensor Statistics. The distributions of the six tensor scalar measures contain correlated data, are non-Gaussian, and have non-uniform variances. The use of ANOVA and t-test statistics, however, requires that the data in each population are not correlated, are Gaussian distributed (negligible skewness, kurtosis, etc.), and have similar variances; hence de-correlation and bootstrap methods are required. De-correlation. The population of each tensor scalar measure was spatially decorrelated by computing the autocorrelation (AC) length for every dimension using the fully sampled data and the mask. For each of the x−, y− and z−directions, all lines having at least four continuous myocardial points were found within the mask. For each line, the data values of the line were subtracted from their average, and then the AC sequence was computed. The AC length, which is the lag value at the first zero-crossing of the AC curve, was computed. The interpolated and original tensor data were conservatively decimated by the minimum integer value greater than or equal to all the median AC lengths for the tensor scalar measures in every dimension in order to spatially de-correlate the data. Bootstrap Statistics. A paired comparison of each scalar tensor measure between the de-correlated interpolated tensors and the de-correlated original “truth” tensors was made using bootstrap methods. The population of paired differences between the scalar tensor measures (interpolated minus “truth” values)
498
J.K. Gahm et al.
(a) EU interpolation
(b) LE interpolation
(c) GL interpolation EU
LE
GL
LI
(d) LI interpolation EU
7
LE
GL
LI
5
0
(e) TR EU
LE
GL
(f) FA LI
EU
1
LE
GL
1
(g) MODE
0.7
LI
12
4
(h) DET
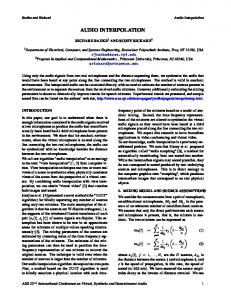
Fig. 1. Superquadric glyph rendering of the tensor field obtained from Euclidean (a), log-Euclidean (b), geodesic-loxodrome (c), and linear invariant (d) bilinear interpolation between the four myocardial tensors at the vertices. Maps of tensor trace (e), FA (f), tensor mode (g), and tensor determinant (h) from the resultant interpolated tensor fields are shown for each interpolation method. The front left edge in the tensor glyph images corresponds to the bottom of the tensor invariant images.
was computed, and 1000 randomly resampled populations with replacement were constructed from the paired difference dataset. From each randomly resampled population the median was calculated. The 1000 median measures were sorted, and the asymmetric 95% confidence interval (CI) about the median was computed from the distribution for each tensor scalar measure. When this method is applied to paired angle differences between the primary eigenvectors or logEuclidean tensor distances, only unsigned differences or distances can be computed. The median of the scalar tensor measure differences and the bootstrapped 95% CI of the median were compared to the zero-bias line (null hypothesis). If the paired differences are not significant, then the 95% Cl will overlap with the zero-bias line. When the paired difference CI does not overlap with the zero-bias line, then the respective tensor interpolation method introduces a significant bias to the tensor field.
Linear Invariant Tensor Interpolation Applied to Cardiac DT-MRI
4
499
Results
Synthetic Example. Fig. 1 shows an example of bilinear interpolation between the four myocardial tensors at the vertices using the EU, LE, GL and LI methods. The tensors are visualized using superquadric glyphs [14]. Each edge represents a microstructural transformation that can be observed both histologically and with DT-MRI. EU only monotonically interpolates TR. EU negatively biases FA and positively biases DET (i.e. the so-called tensor swelling effect [9]). LE negatively biases TR and FA, and only monotonically interpolates DET. Both EU and LE heterogeneously bias MODE. GL monotonically and LI linearly interpolate all the tensor invariants including DET. In order to establish that monotonic or linear interpolation of the tensor invariants is the best interpolation method, we evaluated each tensor interpolation method using the experimentally measured DT-MRI datasets as follows. Autocorrelation. The AC procedure resulted in AC lengths of 3 in all the directions for the rabbit heart data; 4 in the x− and y−directions, and 2 in the z−direction for the porcine heart data; and 8 in the x− and y−directions, and 6 in the z−direction for the human heart data. To ensure that the data was de-correlated, the data was decimated by the AC length in each dimension. Bootstrap Statistics. Figure 2 shows that EU does not introduce a significant bias to TR nor DET, but it does negatively bias FA and positively bias MODE. AI and LE are nearly identical and show a negative bias for TR, FA, and DET;
!
!
!
!
Degree
!
×10 − 1 1 mm6 /s 3
×10 − 5 mm2 /s
10
0.3 0.2
5
0.1 0
!
0 EU AI LE GL LI
!
!
!
!
Degree
!
×10 − 1 1 mm6 /s 3
×10 − 5 mm2 /s
10
0.2 5 0.1 0
!
0 EU AI LE GL LI
!
!
!
(a) TR
!
(b) FA
Degree
×10 − 1 7 mm6 /s 3
×10 − 7 mm2 /s
10
!
0.2 5 0.1 0 EU AI LE GL LI
(d) DET
EU AI LE GL LI 0.3
0
!
(c) MODE
EU AI LE GL LI 0.3
(e) 1st EV
EU AI LE GL LI
(f) LE dist
Fig. 2. Bootstrap statistics for tensor measures. The upper row corresponds to the rabbit heart data, the middle row to the porcine heart data, and the lower row to the human heart data. Results of the paired comparison for tensor trace (a), FA (b), tensor mode (c), tensor determinant (d), angle difference between primary eigenvectors (e), and log-Euclidean tensor distance (f) are shown for each interpolation method. Each black horizontal line represents the median of each measure, and each box represents the bootstrapped 95% confidence interval of the median. The light gray horizontal lines at zero represent the zero bias.
500
J.K. Gahm et al.
and a positive bias for MODE. GL shows no significant bias for TR, FA, MODE, nor DET. LI does not introduce a significant bias for TR, FA, nor DET, but it does negatively bias MODE. All of the tensor interpolation methods produce an equivalent and positive bias for the primary eigenvector and the log-Euclidean tensor distance metric.
5
Conclusion
The bootstrap comparison results demonstrate that GL and LI outperform EU, LE and AI in terms of tensor shape recovery. The bias introduced by AI and LE for recovery of TR and DET is a small (≈ 2%) change relative to the absolute measures. Furthermore, current models do not make use of the TR information from the DT-MRI data because the conductivity tensor’s eigenvalues have to be rescaled, hence this bias is not likely to be significant. The bias in FA introduced by EU, AI and LE is larger (≈ 8%), and may significantly impact simulations when this data is incorporated into the computational model to rescale the conductivity tensor in regions of fibrosis and scar. Hence, accurate recovery of FA is important. The magnitude of the bias in MODE by EU, AI, LE, and LI is similar (≈ 4%). Only GL shows a distinct advantage as it interpolates MODE with no bias. Both electrophysiologic activation and mechanical tissue properties are known to be orthotropic, therefore accurate interpolation of MODE (lower bias) is likely beneficial. For computational electrophysiology and mechanical modeling of the heart, orientation recovery is very important because the primary eigenvector (myofiber direction) strongly governs the direction of electrical activation and active contraction. All of the tested tensor interpolation methods introduce a ≈ 5◦ − 8◦ bias, which may introduce notable fiber “disarray” into computational models. A tensor interpolation method that better recovers tensor orientation is still needed. The path interpolated by LI (respectively, GL) between two tensors lies in the 6-dimensional nonlinear manifold of tensors; this path has a projection onto the 3-manifold of tensor invariants (losing the directionality information). Here we interpolate on the 3-manifold, to linearly (respectively, monotonically) preserve the tensor shape attributes. The use of direct linear interpolation does not imply, nor is it motivated by, assumptions about global linearity, but naturally follows by considering the small neighborhood around a point to be homeomorphic to Euclidean space (valid for short distances), as given by the manifold structure. The paths are demonstrably close approximations of each other, and our fundamental ignorance of the true physical path on the tensor manifold makes it difficult to describe either LI or GL as “more meaningful.” We therefore tested all the methods on real data. In conclusion, if MODE recovery is important then GL should be used despite the computational cost. If MODE recovery is not critical then LI interpolation is an otherwise equivalent tensor interpolation method with reduced computational
Linear Invariant Tensor Interpolation Applied to Cardiac DT-MRI
501
cost, which is important when interpolating tensors to the coordinates of 5 to 25 million computational nodes found in whole heart electrophysiology models. EU, AI, and LE tensor interpolation have no distinct advantage for the interpolation of tensor shape and orientation information based on the comparisons presented herein.
References 1. Basser, P.J., Mattiello, J., Le Bihan, D.: Estimation of the Effective Self-Diffusion Tensor from the NMR Spin Echo. J. Mag. Res. B 103, 247–254 (1994) 2. Ennis, D.B., Kindlmann, G.: Orthogonal Tensor Invariants and the Analysis of Diffusion Tensor Magnetic Resonance Images. Mag. Res. Med. 55, 136–146 (2006) 3. Kindlmann, G., Ennis, D.B., Whitaker, R.T., Westin, C.F.: Diffusion Tensor Analysis with Invariant Gradients and Rotation Tangents. IEEE Trans. Med. Imaging 26(11), 1483–1499 (2007) 4. Kung, G.L., Nguyen, T.C., Itoh, A., Skare, S., Ingels Jr., N.B., Miller, D.C., Ennis, D.B.: The Presence of Two Local Myocardial Sheet Populations Confirmed by Diffusion Tensor MRI and Histological Validation. J Mag. Res. Imaging 34(5), 1080–1091 (2011) 5. Batchelor, P.G., Moakher, M., Atkinson, D., Calamante, F., Connelly, A.: A Rigorous Framework for Diffusion Tensor Calculus. Mag. Res. Med. 53(1), 221–225 (2005) 6. Fletcher, P.T., Joshi, S.: Riemannian Geometry for the Statistical Analysis of Diffusion Tensor Data. Signal Processing 87(2), 250–262 (2007) 7. Lenglet, C., Rousson, M., Deriche, R., Faugeras, O.: Statistics on the Manifold of Multivariate Normal Distributions: Theory and Application to Diffusion Tensor MRI Processing. J. Math. Imaging Vis. 25(3), 423–444 (2006) 8. Pennec, X., Fillard, P., Ayache, N.: A Riemannian Framework for Tensor Computing. Int. J. Comp. Vis. 66(1), 41–66 (2006) 9. Arsigny, V., Fillard, P., Pennec, X., Ayache, N.: Log-Euclidean Metrics for Fast and Simple Calculus on Diffusion Tensors. Mag. Res. Med. 56, 411–421 (2006) 10. Kindlmann, G., San Jos´e Est´epar, R., Niethammer, M., Haker, S., Westin, C.-F.: Geodesic-Loxodromes for Diffusion Tensor Interpolation and Difference Measurement. In: Ayache, N., Ourselin, S., Maeder, A. (eds.) MICCAI 2007, Part I. LNCS, vol. 4791, pp. 1–9. Springer, Heidelberg (2007) 11. Bi, C., Takahashi, S., Fujishiro, I.: Interpolating 3D Diffusion Tensors in 2D Planar Domain by Locating Degenerate Lines. In: Bebis, G., Boyle, R., Parvin, B., Koracin, D., Chung, R., Hammoud, R., Hussain, M., Kar-Han, T., Crawfis, R., Thalmann, D., Kao, D., Avila, L. (eds.) ISVC 2010, Part I. LNCS, vol. 6453, pp. 328–337. Springer, Heidelberg (2010) 12. Yang, F., Zhu, Y.M., Magnin, I.E., Luo, J.H., Croisille, P., Kingsley, P.B.: FeatureBased Interpolation of Diffusion Tensor Fields and Application to Human Cardiac DT-MRI. Med. Image Anal. 16(2), 459–481 (2012) 13. Helm, P.A., Raimond, L.: Winslow at the Center for Cardiovascular Bioinformatics and Modeling and Dr. Elliot McVeigh at the National Institute of Health for provision of data 14. Ennis, D.B., Kindlmann, G., Rodriguez, I., Helm, P.A., McVeigh, E.R.: Visualization of Tensor Fields using Superquadric Glyphs. Mag. Res. Med. 53, 169–176 (2005)