Sep 14, 2012 - [4] L. Breiman and J. H. Friedman. Predicting ... Lawrence K. Saul, Yair Weiss, and Léon Bottou, editors, in Proceedings of Neural Information.
Link Prediction in Graphs with Autoregressive Features
arXiv:1209.3230v1 [stat.ML] 14 Sep 2012
Emile Richard CMLA UMR CNRS 8536, ENS Cachan, France
Stéphane Gaïffas CMAP - Ecole Polytechnique & LSTA - Université Paris 6
Nicolas Vayatis CMLA UMR CNRS 8536, ENS Cachan, France
Abstract In the paper, we consider the problem of link prediction in time-evolving graphs. We assume that certain graph features, such as the node degree, follow a vector autoregressive (VAR) model and we propose to use this information to improve the accuracy of prediction. Our strategy involves a joint optimization procedure over the space of adjacency matrices and VAR matrices which takes into account both sparsity and low rank properties of the matrices. Oracle inequalities are derived and illustrate the trade-offs in the choice of smoothing parameters when modeling the joint effect of sparsity and low rank property. The estimate is computed efficiently using proximal methods through a generalized forward-backward agorithm.
1 Introduction Forecasting systems behavior with multiple responses has been a challenging issue in many contexts of applications such as collaborative filtering, financial markets, or bioinformatics, where responses can be, respectively, movie ratings, stock prices, or activity of genes within a cell. Statistical modeling techniques have been widely investigated in the context of multivariate time series either in the multiple linear regression setup [4] or with autoregressive models [25]. More recently, kernel-based regularized methods have been developed for multitask learning [7, 2]. These approaches share the use of the correlation structure among input variables to enrich the prediction on every single output. Often, the correlation structure is assumed to be given or it is estimated separately. A discrete encoding of correlations between variables can be modeled as a graph so that learning the dependence structure amounts to performing graph inference through the discovery of uncovered edges on the graph. The latter problem is interesting per se and it is known as the problem of link prediction where it is assumed that only a part of the graph is actually observed [16, 9]. This situation occurs in various applications such as recommender systems, social networks, or proteomics, and the appropriate tools can be found among matrix completion techniques [22, 5, 1]. In the realistic setup of a time-evolving graph, matrix completion was also used and adapted to take into account the dynamics of the features of the graph [19]. In this paper, we study the prediction problem where the observation is a sequence of graphs adjacency matrices (At )0≤t≤T and the goal is to predict AT +1 . This type of problem arises in applications such as recommender systems where, given information on purchases made by some users, one would like to predict future purchases. In this context, users and products can be modeled as the nodes of a bipartite graph, while purchases or clicks are modeled as edges. In functional genomics and systems biology, estimating regulatory networks in gene expression can be performed by modeling the data as graphs and fitting predictive models is a natural way for estimating evolving networks in these contexts. A large variety of methods for link prediction only consider predicting from a single static snapshot of the graph - this includes heuristics [16, 21], matrix factorization [13], diffusion [17], or probabilistic methods [23]. More recently, some works have investigated using sequences of observations of the graph to improve the prediction, such as using regression on features extracted from the graphs [19], using matrix factorization [14], continuous-time regression [27]. Our main assumption is that the network effect is a 1
cause and a symptom at the same time, and therefore, the edges and the graph features should be estimated simultaneously. We propose a regularized approach to predict the uncovered links and the evolution of the graph features simultaneously. We provide oracle bounds under the assumption that the noise sequence has subgaussian tails and we prove that our procedure achieves a trade-off in the calibration of smoothing parameters which adjust with the sparsity and the rank of the unknown adjacency matrix. The rest of this paper is organized as follows. In Section 2, we describe the general setup of our work with the main assumptions and we formulate a regularized optimization problem which aims at jointly estimating the autoregression parameters and predicting the graph. In Section 3, we provide technical results with oracle inequalities and other theoretical guarantees on the joint estimation-prediction. Section 4 is devoted to the description of the numerical simulations which illustrate our approach. We also provide an efficient algorithm for solving the optimization problem and show empirical results. The proof of the theoretical results are provided as supplementary material in a separate document.
2 Estimation of low-rank graphs with autoregressive features Our approach is based on the asumption that features can explain most of the information contained in the graph, and that these features are evolving with time. We make the following assumptions about the sequence (At )t≥0 of adjacency matrices of the graphs sequence. Low-Rank. We assume that the matrices At have low-rank. This reflects the presence of highly connected groups of nodes such as communities in social networks, or product categories and groups of loyal/fanatic users in a market place data, and is sometimes motivated by the small number of factors that explain nodes interactions. Autoregressive linear features. We assume to be given a linear map ω : Rn×n → Rd defined by � � ω(A) = hΩ1 , Ai, · · · , hΩd , Ai , (1) where (Ωi )1≤i≤d is a set of n × n matrices. These matrices can be either deterministic or random in our theoretical analysis, but we take them deterministic for the sake of simplicity. The vector time series (ω(At ))t≥0 has autoregressive dynamics, given by a VAR (Vector Auto-Regressive) model: ω(At+1 ) = W0⊤ ω(At ) + Nt+1 , where W0 ∈ Rd×d is a unknown sparse matrix and (Nt )t≥0 is a sequence of noise vectors in Rd . An example of linear features is the degree (i.e. number of edges connected to each node, or the sum of their weights if the edges are weighted), which is a measure of popularity in social and commerce networks. Introducing XT −1 = (ω(A0 ), . . . , ω(AT −1 ))⊤ and XT = (ω(A1 ), . . . , ω(AT ))⊤ , which are both T × d matrices, we can write this model in a matrix form: XT = XT −1 W0 + NT ,
(2)
⊤
where NT = (N1 , . . . , NT ) . This assumes that the noise is driven by time-series dynamics (a martingale increment), where each coordinates are independent (meaning that features are independently corrupted by noise), with a sub-gaussian tail and variance uniformly bounded by a constant σ 2 . In particular, no independence assumption between the Nt is required here. Notations. The notations k ·kF , k ·kp , k ·k∞ , k ·k∗ and k ·kop stand, respectively, for the Frobenius norm, entry-wise ℓp norm, entry-wise ℓ∞ norm, trace-norm (or nuclear norm, given by the sum of the singular values) and operator norm (the largest singular value). We denote by hA, Bi = tr(A⊤ B) the Euclidean matrix product. A vector in Rd is always understood as a d × 1 matrix. We denote by kAk0 the number of non-zero elements of A. The product A ◦ B between two matrices with matching dimensions stands for the Hadamard or entry-wise product between A and B. The matrix |A| contains the absolute values of entries of A. The matrix (M )+ is the componentwise positive part of the matrix M, and sign(M ) is the sign matrix associated to M with the convention sign(0) = 0 2
Pr ⊤ If A is a n × n matrix with rank r, we write its SVD as A = U ΣV ⊤ = j=1 σj uj vj where Σ = diag(σ1 , . . . , σr ) is a r × r diagonal matrix containing the non-zero singular values of A in decreasing order, and U = [u1 , . . . , ur ], V = [v1 , . . . , vr ] are n × r matrices with columns given by the left and right singular vectors of A. The projection matrix onto the space spanned by the columns (resp. rows) of A is given by PU = U U ⊤ (resp. PV = V V ⊤ ). The operator PA : Rn×n → Rn×n given by PA (B) = PU B + BPV − PU BPV is the projector onto the linear space spanned by the matrices uk x⊤ and yvk⊤ for 1 ≤ j, k ≤ r and x, y ∈ Rn . The projector onto the orthogonal space is ⊥ given by PA (B) = (I − PU )B(I − PV ). We also use the notation a ∨ b = max(a, b). 2.1 Joint prediction-estimation through penalized optimization In order to reflect the autoregressive dynamics of the features, we use a least-squares goodness-offit criterion that encourages the similarity between two feature vectors at successive time steps. In order to induce sparsity in the estimator of W0 , we penalize this criterion using the ℓ1 norm. This leads to the following penalized objective function: 1 kXT − XT −1 W k2F + κkW k1 , dT where κ > 0 is a smoothing parameter. J1 (W ) =
Now, for the prediction of AT +1 , we propose to minimize a least-squares criterion penalized by the combination of an ℓ1 norm and a trace-norm. This mixture of norms induces sparsity and a low-rank of the adjacency matrix. Such a combination of ℓ1 and trace-norm was already studied in [8] for the matrix regression model, and in [20] for the prediction of an adjacency matrix. The objective function defined below exploits the fact that if W is close to W0 , then the features of the next graph ω(AT +1 ) should be close to W ⊤ ω(AT ). Therefore, we consider 1 kω(A) − W ⊤ ω(AT )k2F + τ kAk∗ + γkAk1 , d where τ, γ > 0 are smoothing parameters. The overall objective function is the sum of the two partial objectives J1 and J2 , which is jointly convex with respect to A and W : J2 (A, W ) =
1 . 1 kXT − XT −1 W k2F + κkW k1 + kω(A) − W ⊤ ω(AT )k22 + τ kAk∗ + γkAk1 , (3) L(A, W ) = dT d If we choose convex cones A ⊂ Rn×n and W ⊂ Rd×d , our joint estimation-prediction procedure is defined by ˆ W ˆ ) ∈ arg min L(A, W ). (A, (4) (A,W )∈A×W
d×d
It is natural to take W = R and A = (R+ )n×n since there is no a priori on the values of the feature matrix W0 , while the entries of the matrix AT +1 must be positive. In the next section we propose oracle inequalities which prove that this procedure can estimate W0 and predict AT +1 at the same time. 2.2 Main result The central contribution of our work is to bound the prediction error with high probability under the following natural hypothesis on the noise process. Assumption 1. We assume that (Nt )t≥0 satisfies E[Nt |Ft−1 ] = 0 for any t ≥ 1 and that there is σ > 0 such that for any λ ∈ R and j = 1, . . . , d and t ≥ 0: E[eλ(Nt )j |Ft−1 ] ≤ eσ
2
λ2 /2
.
Moreover, we assume that for each t ≥ 0, the coordinates (Nt )1 , . . . , (Nt )d are independent. The main result can be summarized as follows. The prediction error and the estimation error can be simultaneously bounded by the sum of three terms that involve homogeneously (a) the sparsity, (b) the rank of the adjacency matrix AT +1 , and (c) the sparsity of the VAR model matrix W0 . The tight bounds we obtain are similar to the bounds of the Lasso and are upper bounded by: 3
r
r r log d log n log n C1 kW0 k0 + C2 kAT +1 k0 + C3 rank AT +1 . T d2 d d The positive constants C1 , C2 , C3 are proportional to the noise level σ. The interplay between the rank and sparsity constraints on AT +1 are reflected in the observation that the values of C2 and C3 can be changed as long as their sum remains constant.
3 Oracle inequalities In this section we give oracle inequalities for the mixed prediction-estimation error which is given, for any A ∈ Rn×n and W ∈ Rd×d , by 1 . 1 kXT −1 (W − W0 )k2F . E(A, W )2 = k(W − W0 )⊤ ω(AT ) − ω(A − AT +1 )k22 + d dT
(5)
It is important to have in mind that an upper-bound on E implies upper-bounds on each of its two components. It entails in particular an upper-bound on the feature estimation error c − W0 )kF that makes k(W c − W0 )⊤ ω(AT )k2 smaller and consequently controls the kXT −1 (W b − AT +1 )k2 . prediction error over the graph edges through kω(A The upper bounds on E given below exhibit the dependence of the accuracy of estimation and prediction on the number of features d, the number of edges n and the number T of observed graphs in the sequence. Let us recall NT = (N1 , . . . , NT )⊤ and introduce the noise processes M =−
d X
(NT +1 )j Ωj and Ξ =
T +1 X
ω(At−1 )Nt⊤ ,
t=1
j=1
which are, respectively, n × n and d × d random matrices. The source of randomness comes from the noise sequence (Nt )t≥0 , see Assumption 1. If these noise processes are controlled correctly, we can prove the following oracle inequalities for procedure (4). The next result is an oracle inequality of slow type (see for instance [3]), that holds in full generality. ˆ W ˆ ) be given by (4) and suppose that Theorem 1. Let (A, τ≥
2α kM kop , d
γ≥
for some α ∈ (0, 1). Then, we have b W c )2 ≤ E(A,
inf
(A,W )∈A×W
2(1 − α) 2 kM k∞ and κ ≥ kΞk∞ d dT
(6)
o n E(A, W )2 + 2τ kAk∗ + 2γkAk1 + 2κkW k1 .
For the proof of oracle inequalities of fast type, the restricted eigenvalue (RE) condition introduced in [3] and [10, 11] is of importance. Restricted eigenvalue conditions are implied by, and in general weaker than, the so-called incoherence or RIP (Restricted isometry property, [6]) assumptions, which excludes, for instance, strong correlations between covariates in a linear regression model. This condition is acknowledged to be one of the weakest to derive fast rates for the Lasso (see [26] for a comparison of conditions). Matrix version of these assumptions are introduced in [12]. Below is a version of the RE assumption that fits in our context. First, we need to introduce the two restriction cones. The first cone is related to the kW k1 term used in procedure (4). If W ∈ Rd×d , we denote by d×d ΘW = sign(W ) ∈ {0, ±1}d×d the signed sparsity pattern of W and by Θ⊥ the W ∈ {0, 1} d×d orthogonal sparsity pattern. For a fixed matrix W ∈ R and c > 0, we introduce the cone n o . ′ ′ C1 (W, c) = W ′ ∈ W : kΘ⊥ ◦ W k ≤ ckΘ ◦ W k 1 W 1 . W This cone contains the matrices W ′ that have their largest entries in the sparsity pattern of W . 4
The second cone is related to mixture of the terms kAk∗ and kAk1 in procedure (4). Before defining it, we need further notations and definitions. For a fixed A ∈ Rn×n and c, β > 0, we introduce the cone n � �o . ⊥ ′ ′ ′ C2 (A, c, β) = A′ ∈ A : kPA (A′ )k∗ + βkΘ⊥ . A ◦ A k1 ≤ c kPA (A )k∗ + βkΘA ◦ A k1
This cone consist of the matrices A′ with large entries close to that of A and that are “almost aligned” with the row and column spaces of A. The parameter β quantifies the interplay between these too notions. Definition 1 (Restricted Eigenvalue (RE)). For W ∈ W and c > 0, we introduce n o µ µ1 (W, c) = inf µ > 0 : kΘW ◦ W ′ kF ≤ √ kXT +1 W ′ kF , ∀W ′ ∈ C1 (W, c) . dT For A ∈ A and c, β > 0, we introduce n µ2 (A, W, c, β) = inf µ > 0 : kPA (A′ )kF ∨ kΘA ◦ A′ kF
o µ ≤ √ kW ′⊤ ω(AT ) − ω(A′ )k2 , ∀W ′ ∈ C1 (W, c), ∀A′ ∈ C2 (A, c, β) . d
The RE assumption consists of assuming that the constants µ1 and µ2 are non-zero. Now we can state the following Theorem that gives a fast oracle inequality for our procedure using RE. ˆ W ˆ ) be given by (4) and suppose that Theorem 2. Let (A, 3(1 − α) 3 3α kM kop , γ ≥ kM k∞ and κ ≥ kΞk∞ d d dT for some α ∈ (0, 1). Then, we have n 25 b W c )2 ≤ E(A, W )2 + µ2 (A, W )2 rank(A)τ 2 + kAk0 γ 2 ) E(A, inf (A,W )∈A×W 18 o 25 + µ1 (W )2 kW k0 κ2 , 36 where µ1 (W ) = µ1 (W, 5) and µ2 (A, W ) = µ2 (A, W, 5, γ/τ ) (see Definition 1). τ≥
(7)
The proofs of Theorems 1 and 2 use tools introduced in [12] and [3]. Note that the residual term from this oracle inequality mixes the notions of sparsity of A and W via the terms rank(A), kAk0 and kW k0 . It says that our mixed penalization procedure provides an optimal trade-off between fitting the data and complexity, measured by both sparsity and low-rank. This is the first result of this nature to be found in literature. In the next Theorem 3, we obtain convergence rates for the procedure (4) by combining Theorem 2 with controls on the noise processes. We introduce d d
1 X
1 X
2 vΩ,op = Ω⊤ Ω Ωj Ω⊤ ∨
j j j , d j=1 d j=1 op op T +1 1 X ωj (At−1 )2 , j=1,...,d T + 1 t=1
d
1 X
2 Ωj ◦ Ωj , vΩ,∞ = d j=1 ∞
σω2 = max
which are the (observable) variance terms that naturally appear in the controls of the noise processes. We introduce also � PT +1 � 2 T +1 t=1 ωj (At−1 ) ∨ PT +1 ℓT = 2 max log log ∨e , 2 j=1,...,d T +1 t=1 ωj (At−1 )
which is a small (observable) technical term that comes out of our analysis of the noise process Ξ. This term is a small price to pay for the fact that no independence assumption is required on the noise sequence (Nt )t≥0 , but only a martingale increment structure with sub-gaussian tails. 5
ˆ W ˆ ) given by (4) with smoothing parameters given by Theorem 3. Consider the procedure (A, r r 2(x + log(2n)) 2(x + 2 log n) τ = 3ασvΩ,op , γ = 3(1 − α)σvΩ,∞ , d d r 1 2e(x + 2 log d + ℓT ) κ = 6σσω d T +1 for some α ∈ (0, 1) and fix a confidence level x > 0. Then, we have n 2(x + log(2n)) 2 bW c )2 ≤ E(A, W )2 + 25µ2 (A)2 rank(A)α2 σ 2 vΩ,op E(A, inf (A,W )∈A×W d 2(x + 2 log n) 2 + 25µ2 (A)2 kAk0 (1 − α)2 σ 2 vΩ,∞ d 2e(x + 2 log d + ℓT ) o + 25µ1 (W )2 kW k0 σ 2 σω2 d2 (T + 1) with a probability larger than 1 − 17e−x, where µ1 and µ2 are the same as in Theorem 2. The proof of Theorem 3 follows directly from Theorem 2 basic noise control results. In the next Theorem, we propose more explicit upper bounds for both the indivivual estimation of W0 and the prediction of AT +1 . Theorem 4. Under the same assumptions as in Theorem 3, for any x > 0 the following inequalities hold with a probability larger than 1 − 17e−x : 1 ˆ − W0 )k2F kXT (W dT o n1 25 (8) kω(A) − ω(AT +1 )k2F + µ2 (A, W )2 rank(A)τ 2 + kAk0 γ 2 ) ≤ inf A∈A d 18 25 + µ1 (W0 )2 kW0 k0 κ2 36 ˆ − W0 k1 ≤ 5µ1 (W0 )2 kW0 k0 κ kW r p 25 1 kω(A) − ω(AT +1 )k2F + µ2 (A, W )2 rank(A)τ 2 + kAk0 γ 2 ) + 6 kW0 k0 µ1 (W0 ) inf A∈A d 18 (9) p p kAˆ − AT +1 k∗ ≤ 5µ1 (W0 )2 kW0 k0 κ + (6 rank AT +1 + 5β kAT +1 k0 )µ2 (AT +1 ) r 25 1 kω(A) − ω(AT +1 )k2F + µ2 (A, W )2 rank(A)τ 2 + kAk0 γ 2 ) . × inf A∈A d 18
(10)
4 Algorithms and Numerical Experiments 4.1 Generalized forward-backward algorithm for minimizing L We use the algorithm designed in [18] for minimizing our objective function. Note that this algorithm is preferable to the method introduced in [19] as it directly minimizes L jointly in (S, W ) rather than alternately minimizing in W and S. Moreover we use the novel joint penalty from [20] that is more suited for estimating graphs. The proximal operator for the trace norm is given by the shrinkage operation, if Z = U diag(σ1 , · · · , σn )V T is the singular value decomposition of Z, proxτ ||.||∗ (Z) = U diag((σi − τ )+ )i V T .
Similarly, the proximal operator for the ℓ1 -norm is the soft thresholding operator defined by using the entry-wise product of matrices denoted by ◦: proxγ||.||1 = sgn(Z) ◦ (|Z| − γ)+ . 6
The algorithm converges under very mild conditions when the step size θ is smaller than L is the operator norm of the joint quadratic loss: Φ : (A, W ) 7→
2 L,
where
1 1 kXT − XT −1 W k2F + kω(A) − W ⊤ ω(AT )k2F . dT d
Algorithm 1 Generalized Forward-Backward to Minimize L Initialize A, Z1 , Z2 , W, q = 2 repeat Compute (GA , GW ) = ∇A,W Φ(A, W ). Compute Z1 = proxqθτ ||.||∗ (2A − Z1 − θGA ) Compute Z2 = proxqθγ||.||1 (2A − Z2 − θGA ) Pq Set A = 1q k=1 Zk Set W = proxθκ||.||1 (W − θGW ) until convergence return (A, W ) minimizing L 4.2 A generative model for graphs having linearly autoregressive features Let V0 ∈ Rn×r be a sparse matrix, V0† its pseudo-inverse such, that V0† V0 = V0⊤ V0⊤† = Ir . Fix two sparse matrices W0 ∈ Rr×r and U0 ∈ Rn×r . Now define the sequence of matrices (At )t≥0 for t = 1, 2, · · · by Ut = Ut−1 W0 + Nt and At = Ut V0⊤ + Mt for i.i.d sparse noise matrices Nt and Mt , which means that for any pair of indices (i, j), with high probability (Nt )i,j = 0 and (Mt )i,j = 0. We define the linear feature map ω(A) = AV0⊤† , and point out that � � � � 1. The sequence ω(At )⊤ = Ut + Mt V0⊤† follows the linear autoregressive relation t
t
ω(At ) = ω(At−1 ) W0 + Nt + Mt V0⊤† . ⊤
⊤
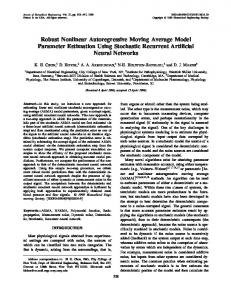
2. For any time index t, the matrix At is close to Ut V0 that has rank at most r 3. The matrices At and Ut are both sparse by construction. 4.3 Empirical evaluation We tested the presented methods on synthetic data generated as in section (4.2). In our experiments the noise matrices Mt and Nt where built by soft-thresholding i.i.d. noise N (0, σ 2 ). We took as input T = 10 successive graph snapshots on n = 50 nodes graphs of rank r = 5. We used d = 10 linear features, and finally the noise level was set to σ = .5. We compare our methods to standard baselines in link prediction. We use the area under the ROC curve as the measure of performance and report empirical results averaged over 50 runs with the corresponding confidence intervals in figure 4.3. The competitor methods are the nearest neighbors (NN) and static sparse and low-rank estimation, that is the link prediction algorithm suggested in [20]. The algorithm NN scores pairs of nodes with the number of common friends between them, which is given by A2 when A is the P fT = T At and the static sparse and low-rank estimation cumulative graph adjacency matrix A t=0 fT k2 + τ kXk∗ + γkXk1, and can be seen as the is obtained by minimizing the objective kX − A F closest static version of our method. The two methods autoregressive low-rank and static low-rank are regularized using only the trace-norm, (corresponding to forcing γ = 0) and are slightly inferior to their sparse and low-rank rivals. Since the matrix V0 defining the linear map ω is unknown we fT = U ΣV ⊤ is the SVD of A fT . The parameters τ consider the feature map ω(A) = AV where A and γ are chosen by 10-fold cross validation for each of the methods separately. 7
AUC
Link prediction performance 0.95
2
0.99 0.98
4
0.9
0.97 0.96 0.95
T
AUC
6 0.85
0.94 8 0.93 Autoregressive Sparse and Low−rank Autoregressive Low−rank Static Sparse and Low−rank Static Low−rank Nearest−Neighbors
0.8
0.75
2
3
4
5
6
7
8
9
0.92
10
0.91 0.9
12 0
10
T
10
20
30 rank A
40
50
60
70
T+1
Figure 1: Left: performance of algorithms in terms of Area Under the ROC Curve, average and confidence intervals over 50 runs. Right: Phase transition diagram.
4.4 Discussion 1. Comparison with the baselines. This experiment sharply shows the benefit of using a temporal approach when one can handle the feature extraction task. The left-hand plot shows that if few snapshots are available (T ≤ 4 in these experiments), then static approaches are to be preferred, whereas feature autoregressive approaches outperform as soon as sufficient number T graph snapshots are available (see phase transition). The decreasing performance of static algorithms can be explained by the fact that they use as input a mixture of graphs observed at different time steps. Knowing that at each time step the nodes have specific latent factors, despite the slow evolution of the factors, adding the resulting graphs leads to confuse the factors. 2. Phase transition. The right-hand figure is a phase transition diagram showing in which part of rank and time domain the estimation is accurate and illustrates the interplay between these two domain parameters. 3. Choice of the feature map ω. In the current work we used the projection onto the vector space of the top-r singular vectors of the cumulative adjacency matrix as the linear map ω, and this choice has shown empirical superiority to other choices. The question of choosing the best measurement to summarize graph information as in compress sensing seems to have both theoretical and application potential. Moreover, a deeper understanding of the connections of our problem with compressed sensing, for the construction and theoretical validation of the features mapping, is an important point that needs several developments. One possible approach is based on multi-kernel learning, that should be considered in a future work. 4. Generalization of the method. In this paper we consider only an autoregressive process of order 1. For better prediction accuracy, one could consider mode general models, such as vector ARMA models, and use model-selection techniques for the choice of the orders of the model. A general modelling based on state-space model could be developed as well. We presented a procedure for predicting graphs having linear autoregressive features. Our approach can easily be generalized to non-linear prediction through kernel-based methods. [Appendix : Proof of propositions]
A
Proofs of the main results
From now on, we use the notation k(A, a)k2F = kAk2F +kak22 and h(A, a), (B, b)i = hA, Bi+ha, bi for any A, B ∈ RT ×d and a, b ∈ Rd .
Let us introduce the linear mapping Φ : Rn×n × Rd×d → RT ×d × Rd given by � 1 � Φ(A, W ) = √ XT −1 W, ω(A) − W ⊤ ω(AT ) . T 8
Using this mapping, the objective (3) can be written in the following reduced way:
2 � � 1
1
L(A, W ) = √ XT , 0 − Φ(A, W ) + γkAk1 + τ kAk∗ + κkW k1 . d F T Recalling that the error writes, for any A and W : 1 1 kXT −1 (W − W0 )k2F , E(A, W )2 = k(W − W0 )⊤ ω(AT ) − ω(A − AT +1 )k2F + d dT we have 1 E(A, W )2 = Φ(A − AT +1 , W − W0 )k2F . d Let us introduce also the empirical risk
2 � � 1
1
Rn (A, W ) = √ XT , 0 − Φ(A, W ) . d F T The proofs of Theorem 1 and 2 are based on tools developped in [12] and [3]. However, the context considered here is very different from the setting considered in these papers, so our proofs require a different scheme. A.1 Proof of Theorem 1 First, note that ˆ W ˆ ) − Rn (A, W ) Rn (A, � 1� ˆ W ˆ )k2 − kΦ(A, W )k2 − 2h( √1 XT , 0), Φ(Aˆ − A, W ˆ − W )i . kΦ(A, = F F d T Since � 1� ˆ W ˆ )k2F − kΦ(A, W )k2F kΦ(A, d ˆ W ˆ )2 − E(A, W )2 + 2 hΦ(Aˆ − A, W ˆ − W ), Φ(AT +1 , W0 )i, = E(A, d we have ˆ W ˆ ) − Rn (A, W ) Rn (A,
ˆ W ˆ )2 − E(A, W )2 + 2 hΦ(Aˆ − A, W ˆ − W ), Φ(AT +1 , W0 ) − ( √1 XT , 0)i = E(A, d T 1 2 2 2 ˆ − W ), (− √ NT , NT +1 )i. ˆ W ˆ ) − E(A, W ) + hΦ(Aˆ − A, W = E(A, d T The next Lemma will come in handy several times in the proofs. Lemma 1. For any A ∈ Rn×n and W ∈ Rd×d we have 1 1 1 h( √ NT , −NT +1 ), Φ(A, W )i = h(M, Ξ), (A, W )i = hW, Ξi + hA, M i. T T T This Lemma follows from a direct computation, and the proof is thus omitted. This Lemma entails, together with (4), that ˆ W ˆ )2 ≤ E(A, W )2 + 2 hW ˆ − W, Ξi + 2 hAˆ − A, M i E(A, dT d b b 1 ) + κ(kW k1 − kW c k1 ). + τ (kAk∗ − kAk∗ ) + γ(kAk1 − kAk Now, using Hölder’s inequality and the triangle inequality, and introducing α ∈ (0, 1), we obtain � � � � ˆ W ˆ )2 ≤ E(A, W )2 + 2α kM kop − τ kAk ˆ ∗ + 2α kM kop + τ kAk∗ E(A, d d � � 2(1 − α) � � 2(1 − α) ˆ kM k∞ − γ kAk1 + kM k∞ + γ kAk1 + d d � � 2 � � 2 ˆ kΞk∞ − κ kW k1 + kΞk∞ + κ kW k1 , + dT dT which concludes the proof of Theorem 1, using (6). � 9
A.2 Proof of Theorem 2 Let A ∈ Rn×n and W ∈ Rd×d be fixed, and let A = U diag(σ1 , . . . , σr )V ⊤ be the SVD of A. n×n Recalling that ◦ is the entry-wise product, we have A = ΘA ◦|A|+Θ⊥ A ◦A, where ΘA ∈ {0, ±1} ⊥ n×n is the entry-wise sign matrix of A and ΘA ∈ {0, 1} is the orthogonal sparsity pattern of A.
ˆ W ˆ ) is equivalent to the fact that one can find G ˆ ∈ ∂L(A, ˆ W ˆ ) (an element The definition (4) of (A, ˆ W ˆ )) that belongs to the normal cone of A × W at (A, ˆ W ˆ ). This means of the subgradient of L at (A, ˆ and any A ∈ A and W ∈ W, we have that for such a G, ˆ (Aˆ − A, W ˆ − W )i ≤ 0. hG, (11) Any subgradient of the function g(A) = τ kAk∗ + γkAk1 writes � � � � ⊥ Z = τ Z∗ + γZ1 = τ U V ⊤ + PA (G∗ ) + γ ΘA + G1 ◦ Θ⊥ A
ˆ we have, by for some kG∗ kop ≤ 1 and kG1 k∞ ≤ 1 (see for instance [15]). So, if Zˆ ∈ ∂g(A), monotonicity of the sub-differential, that for any Z ∈ ∂g(A) ˆ Aˆ − Ai = hZˆ − Z, Aˆ − Ai + hZ, Aˆ − Ai ≥ hZ, Aˆ − Ai, hZ,
and, by duality, we can find Z such that b − Ai = τ hU V ⊤ , A b − Ai + τ kP ⊥ (A)k b ∗ + γhΘA , A b − Ai + γkΘ⊥ ◦ Ak b 1. hZ, A A
A
By using the same argument with the function W 7→ kW k1 and by computing the gradient of the empirical risk (A, W ) 7→ Rn (A, W ), Equation (11) entails that 2 b − AT +1 , W c − W0 ), Φ(A b − A, W c − W )i hΦ(A d 2 1 ⊥ b b − A, W c − W )i − τ hU V ⊤ , A b − Ai − τ kPA ≤ h( √ NT , −NT +1 ), Φ(A (A)k∗ (12) d T b − Ai − γkΘ⊥ ◦ Ak b 1 − κhΘW , W c − W i − κkΘ⊥ ◦ W c k1 . − γhΘA , A A
W
Using Pythagora’s theorem, we have b − AT +1 , W ˆ − W0 ), Φ(Ab − A, W c − W )i 2hΦ(A
b − AT +1 , W ˆ − W0 )k2 + kΦ(A b − A, W c − W )k2 − kΦ(A − AT +1 , W − W0 )k2 . = kΦ(A 2 2 2 (13) b − AT +1 , W − W0 ), Φ(A b − A, W c − W )i ≤ 0, then Theorem 2 trivially holds. It shows that if hΦ(A Let us assume that b − AT +1 , W − W0 ), Φ(A b − A, W c − W )i > 0. hΦ(A (14) Using Hölder’s inequality, we obtain |hU V ⊤ , Aˆ − Ai| = |hU V ⊤ , PA (Aˆ − A)i| ≤ kU V ⊤ kop kPA (Aˆ − A)k∗ = kPA (Aˆ − A)k∗ ,
|hΘA , Aˆ − Ai| = |hΘA , ΘA ◦ (Aˆ − A)i| ≤ kΘA k∞ kΘA ◦ (Aˆ − A)k1 = kΘA ◦ (Aˆ − A)k1 , ˆ − W i| ≤ kΘW ◦ (W ˆ − W )k1 . So, when (14) holds, we obtain and the same is done for |hΘW , W by rearranging the terms of (12): ⊥ b ⊥ b c τ kPA (A−A)k∗ + γkΘ⊥ A ◦ (A − A)k1 + κkΘW ◦ (W − W )k1 ˆ − W )k1 ≤ τ kPA (Aˆ − A)k∗ + γkΘA ◦ (Aˆ − A)k1 + κkΘW ◦ (W 2 1 b − A, W c − W )i. + h( √ NT , −NT +1 ), Φ(A d T Using Lemma 1, together with Hölder’s inequality, we have for any α ∈ (0, 1): 1 c − W )i = hM, Aˆ − Ai + 1 hΞ, W ˆ − Wi h( √ NT , − NT +1 ), Φ(Ab − A, W T T ≤ αkM kop kPA (Aˆ − A)k∗ + αkM kop kP ⊥ (Aˆ − A)k∗ A
ˆ + (1 − α)kM k∞ kΘA ◦ (Aˆ − A)k1 + (1 − α)kM k∞ kΘ⊥ A ◦ (A − A)k1 1 ˆ − W )k1 + kΘ⊥ ˆ + kΞk∞ (kΘW ◦ (W W ◦ (W − W )k1 ) . T 10
(15)
(16)
Now, using (15) together with (16), we obtain � � � � 2α 2(1 − α) ⊥ ˆ ˆ τ− (A − A)k∗ + γ − kM kop kPA kM k∞ kΘ⊥ A ◦ (A − A)k1 d d � � 2 ˆ + κ− kΞk∞ kΘ⊥ W ◦ (W − W )k1 dT � � � � 2α 2(1 − α) ≤ τ+ kM kop kPA (Aˆ − A)k∗ + γ + kM k∞ kΘA ◦ (Aˆ − A)k1 d d � � 2 ˆ + κ+ kΞk∞ kΘW ◦ (W − W )k1 dT which proves, using (7), that τ kP ⊥ (Aˆ − A)k∗ + γkΘ⊥ ◦ (Aˆ − A)k1 ≤ 5τ kPA (Aˆ − A)k∗ + 5γkΘA ◦ (Aˆ − A)k1 . A
A
ˆ This proves that A−A ∈ C2 (A, 5, γ/τ ). In the same way, using (15) with A = Aˆ together with (16), ˆ − W ∈ C1 (W, 5). we obtain that W Now, using together (12), (13) and (16) , and the fact that the Cauchy-Schwarz inequality entails √ √ kPA (Aˆ − A)k∗ ≤ rank AkPA (Aˆ − A)kF , |hU V ⊤ , Aˆ − Ai| ≤ rank AkPA (Aˆ − A)kF , p p kΘA ◦ (Aˆ − A)k1 ≤ kAk0 kΘA ◦ (Aˆ − A)kF , |hΘA , Aˆ − Ai| ≤ kAk0 kΘA ◦ (Aˆ − A)kF .
ˆ − W , we arrive at and similarly for W b − AT +1 , W ˆ − W0 )k2 + kΦ(A b − A, W c − W )k2 − kΦ(A − AT +1 , W − W0 )k2 kΦ(A 2 2 2 �√ � � 2α � 2α ⊥ ˆ kM kop + τ kM kop − τ kPA (A − A)k∗ ≤ rank AkPA (Aˆ − A)kF + d d � 2α �p � � 2α ˆ + kM k∞ + γ kM k∞ − γ kΘ⊥ kAk0 kΘA ◦ (Aˆ − A)kF + A ◦ (A − A)k1 d d �p � � 2α � ˆ − W )k1 , ˆ − W )kF + 2α kΞk∞ − κ kΘ⊥ ◦ (W kΞk∞ + κ + kW k0 kΘW ◦ (W W dT dT which leads, using (7), to 1 b − AT +1 , W ˆ − W0 )k2 + 1 kΦ(A b − A, W c − W )k2 − 1 kΦ(A − AT +1 , W − W0 )k2 kΦ(A 2 2 2 d d d √ p p 5γ 5κ 5τ ˆ − W )kF . rank AkPA (Aˆ − A)kF + kAk0 kΘA ◦ (Aˆ − A)kF + kW k0 kΘW ◦ (W ≤ 3 3 3 ˆ − W ∈ C1 (W, 5), we obtain using Assumption 1 and Since Aˆ − A ∈ C2 (A, 5, γ/τ ) and W 2 2 ab ≤ (a + b )/2: 1 b − AT +1 , W ˆ − W0 )k2 + 1 kΦ(A b − A, W c − W )k2 kΦ(A 2 2 d d 25 1 ≤ kΦ(A − AT +1 , W − W0 )k22 + µ2 (A, W )2 rank(A)τ 2 + kAk0 γ 2 ) d 18 25 1 2 2 b c − W )k22 , + µ1 (W ) kW k0 κ + kΦ(A − A, W 36 d which concludes the proof of Theorem 2. � A.3 Proof of Theorem 4 1 ˆ − W0 )k2 ≤ E(A, ˆ W ˆ )2 and use kXT −1 (W For the proof of (8), we simply use the fact that dT F Theorem 3. Then we take W = W0 in the infimum over A, W .
ˆ − W0 ∈ C1 (W0 , 5), we have (see the Proof of Theorem 2), For (9), we use the fact that since W p ˆ − W0 k1 ≤ 6 kW0 k0 kΘW ◦ (W ˆ − W0 )kF kW p √ ˆ − W0 )kF / dT ≤ 6 kW0 k0 kXT −1 (W p ˆ W ˆ ), ≤ 6 kW0 k0 E(A,
and then use again Theorem 3. The proof of (10) follows exactly the same scheme. 11
�
A.4 Concentration inequalities for the noise processes The control of the noise terms M and Ξ is based on recent developments on concentration inequalities for random matrices, see for instance [24]. Moreover, the assumption on the dynamics of the features’s noise vector (Nt )t≥0 is quite general, since we only assumed that this process is a martingale increment. Therefore, our control of the noise Ξ rely in particular on martingale theory. Proposition 1. Under Assumption 1, the following inequalities hold for any x > 0. We have r d
1 X
2(x + log(2n))
(NT +1 )j Ωj ≤ σvΩ,op
d j=1 d op
(17)
with a probability larger than 1 − e−x . We have
r d
1 X 2(x + 2 log n)
(NT +1 )j Ωj ≤ σvΩ,∞
d j=1 d ∞
(18)
with a probability larger than 1 − 2e−x , and finally
r T +1
2e(x + 2 log d + ℓT ) 1 X ⊤ ω(At−1 )Nt ≤ σσω T + 1 t=1 T +1 ∞
(19)
with a probability larger than 1 − 14e−x, where � PT +1 � 2 T +1 t=1 ωj (At−1 ) ∨ PT +1 ℓT = 2 max log log ∨e . 2 j=1,...,d T +1 t=1 ωj (At−1 ) Proof. For the proofs of Inequalities (17) and (18), we use the fact that (NT +1 )1 , . . . , (NT +1 )d are independent (scalar) subgaussian random variables. From Assumption 1, we have for any n × n deterministic self-adjoint matrices Xj that E[exp(λ(NT +1 )j Xj )] � exp(σ 2 λ2 Xj2 /2), where � stands for the semidefinite order on self-adjoint matrices. Using Corollary 3.7 from [24], this leads for any x > 0 to d � i � �X h x2 � (NT +1 )j Xj ≥ x ≤ n exp − 2 , P λmax 2v j=1
d
X
Xj2 . where v 2 = σ 2 j=1
op
(20)
Then, following [24], we consider the dilation operator L : Rn×n → R2n×2n given by � � 0 Ω . L(Ω) = Ω∗ 0 We have d
X
(NT +1 )j Ωj
op
j=1
d d � �X �� � �X (NT +1 )j L(Ωj ) = λmax (NT +1 )j Ωj = λmax L j=1
j=1
and an easy computation gives d
X
L(Ωj )2
j=1
op
d
X
Ω⊤ = j Ωj
op
j=1
So, using (20) with the self-adjoint Xj = L(Ωj ) gives d
h X
(NT +1 )j Ωj P j=1
op
d
X
Ωj Ω⊤ ∨ j . j=1
op
d d
X
X i � x2 �
≥ x ≤ 2n exp − 2 where v 2 = σ 2 Ωj Ω⊤ ∨ Ω⊤ Ω
j j , j 2v op op j=1 j=1
which leads easily to (17).
12
Inequality (18) comes from the following standard bound on the sum of independent sub-gaussian random variables: d i � h 1 X � x2 P (NT +1 )j (Ωj )k,l ≥ x ≤ 2 exp − 2 d j=1 2σ (Ωj )2k,l
together with an union bound on 1 ≤ k, l ≤ n.
Inequality (19) is based on a classical martingale exponential argument together with a peeling argument. We denote by ωj (At ) the coordinates of ω(At ) ∈ Rd and by Nt,k those of Nt , so that +1 � TX
ω(At−1 )Nt⊤
t=1
�
j,k
=
T +1 X
ωj (At−1 )Nt,k .
t=1
2
2
We fix j, k and denote for short εt = Nt,k and xt = ωj (At ). Since E[exp(λεt )|Ft−1 ] ≤ eσ λ for any λ ∈ R, we obtain by a recursive conditioning with respect to FT −1 , FT −2 , . . . , F0 , that +1 T +1 h � TX σ 2 θ2 X 2 �i E exp θ εt xt−1 − ≤ 1. x 2 t=1 t−1 t=1
/2
Hence, using Markov’s inequality, we obtain for any v > 0: +1 T +1 h TX i � X x2 � P εt xt−1 ≥ x, x2t−1 ≤ v ≤ inf exp(−θx + σ 2 θ2 v/2) = exp − 2 , θ>0 2σ v t=1 t=1 that we rewrite in the following way: +1 T +1 h TX i X √ P εt xt−1 ≥ σ 2vx, x2t−1 ≤ v ≤ e−x . t=1
t=1
PT +1
PT +1 Let us denote for short VT = and ST = t=1 εt xt−1 . We want to replace v by VT from the previous deviation inequality, and to remove the event {VT ≤ v}. To do so, we use a peeling argument. We take v = T + 1 and introduce vk = vek so that the event {VT > v} is decomposed into the union of the �disjoint sets {vk < VT ≤ vk+1 }. We introduce �P 2 t=1 xt−1
also ℓT = 2 log log
T +1 t=1
x2t−1 T +1
∨
+1 PTT +1 2 t=1 xt−1
∨e .
This leads to i h p p � X � P ST ≥ σ 2eVT (x + ℓT ), VT > v = P ST ≥ σ 2eVT (x + ℓT ), vk < VT ≤ vk+1 k≥0
q i X h = P ST ≥ σ 2vk+1 (x + 2 log log(ek ∨ e)), vk < VT ≤ vk+1 k≥0
≤ e−x (1 +
X
k≥1
k −2 ) ≤ 3.47e−x.
On {VT ≤ v} the proof is the same: we decompose onto the disjoint sets {vk+1 < VT ≤ vk } where this time vk = ve−k , and we arrive at h p � P ST ≥ σ 2eVT (x + ℓT ), VT ≤ v ≤ 3.47e−x. This leads to
P
� TX +1 t=1
�
ωj (At−1 )Nt,k ≥ σ 2e
T +1 X t=1
�1/2 � ωj (At−1 ) (x + ℓT,j ) ≤ 7e−x 2
for any 1 ≤ j, k ≤ d, where we introduced � � PT +1 ω (A )2 T +1 j t−1 t=1 ∨e . ℓT,j = 2 log log ∨ PT +1 2 T +1 t=1 ωj (At−1 )
The conclusion follows from an union bound on 1 ≤ j, k ≤ d. This concludes the proof of Proposition 1. 13
References [1] J. Abernethy, F. Bach, Th. Evgeniou, and J.-Ph. Vert. A new approach to collaborative filtering: operator estimation with spectral regularization. JMLR, 10:803–826, 2009. [2] A. Argyriou, M. Pontil, Ch. Micchelli, and Y. Ying. A spectral regularization framework for multi-task structure learning. Proceedings of Neural Information Processing Systems (NIPS), 2007. [3] P. J. Bickel, Y. Ritov, and A. B. Tsybakov. Simultaneous analysis of lasso and dantzig selector. Annals of Statistics, 37, 2009. [4] L. Breiman and J. H. Friedman. Predicting multivariate responses in multiple linear regression. Journal of the Royal Statistical Society (JRSS): Series B (Statistical Methodology), 59:3–54, 1997. [5] E.J. Candès and T. Tao. The power of convex relaxation: Near-optimal matrix completion. IEEE Transactions on Information Theory, 56(5), 2009. [6] Candès E. and Tao T. Decoding by linear programming. In Proceedings of the 46th Annual IEEE Symposium on Foundations of Computer Science (FOCS), 2005. [7] Th. Evgeniou, Ch. A. Micchelli, and M. Pontil. Learning multiple tasks with kernel methods. Journal of Machine Learning Research, 6:615–637, 2005. [8] S. Gaiffas and G. Lecue. Sharp oracle inequalities for high-dimensional matrix prediction. Information Theory, IEEE Transactions on, 57(10):6942 –6957, oct. 2011. [9] M. Kolar and E. P. Xing. On time varying undirected graphs. in Proceedings of the 14th International Conference on Artifical Intelligence and Statistics AISTATS, 2011. [10] V. Koltchinskii. The Dantzig selector and sparsity oracle inequalities. Bernoulli, 15(3):799– 828, 2009. [11] V. Koltchinskii. Sparsity in penalized empirical risk minimization. Ann. Inst. Henri Poincaré Probab. Stat., 45(1):7–57, 2009. [12] V. Koltchinskii, K. Lounici, and A. Tsybakov. Nuclear norm penalization and optimal rates for noisy matrix completion. Annals of Statistics, 2011. [13] Y. Koren. Factorization meets the neighborhood: a multifaceted collaborative filtering model. In Proceeding of the 14th ACM SIGKDD international conference on Knowledge discovery and data mining, pages 426–434. ACM, 2008. [14] Y. Koren. Collaborative filtering with temporal dynamics. Communications of the ACM, 53(4):89–97, 2010. [15] A. S. Lewis. The convex analysis of unitarily invariant matrix functions. J. Convex Anal., 2(1-2):173–183, 1995. [16] D. Liben-Nowell and J. Kleinberg. The link-prediction problem for social networks. Journal of the American society for information science and technology, 58(7):1019–1031, 2007. [17] S.A. Myers and Jure Leskovec. On the convexity of latent social network inference. In NIPS, 2010. [18] H. Raguet, J. Fadili, and G. Peyré. Generalized forward-backward splitting. Arxiv preprint arXiv:1108.4404, 2011. [19] E. Richard, N. Baskiotis, Th. Evgeniou, and N. Vayatis. Link discovery using graph feature tracking. Proceedings of Neural Information Processing Systems (NIPS), 2010. [20] E. Richard, P.-A. Savalle, and N. Vayatis. Estimation of simultaneously sparse and low-rank matrices. In Proceeding of 29th Annual International Conference on Machine Learning, 2012. [21] P. Sarkar, D. Chakrabarti, and A.W. Moore. Theoretical justification of popular link prediction heuristics. In International Conference on Learning Theory (COLT), pages 295–307, 2010. [22] N. Srebro, J. D. M. Rennie, and T. S. Jaakkola. Maximum-margin matrix factorization. In Lawrence K. Saul, Yair Weiss, and Léon Bottou, editors, in Proceedings of Neural Information Processing Systems 17, pages 1329–1336. MIT Press, Cambridge, MA, 2005. [23] B. Taskar, M.F. Wong, P. Abbeel, and D. Koller. Link prediction in relational data. In Neural Information Processing Systems, volume 15, 2003. 14
[24] J. A. Tropp. User-friendly tail bounds for sums of random matrices. ArXiv e-prints, April 2010. [25] R. S. Tsay. Analysis of Financial Time Series. Wiley-Interscience; 3rd edition, 2005. [26] S. A. van de Geer and P. Bühlmann. On the conditions used to prove oracle results for the Lasso. Electron. J. Stat., 3:1360–1392, 2009. [27] D.Q. Vu, A. Asuncion, D. Hunter, and P. Smyth. Continuous-time regression models for longitudinal networks. In Advances in Neural Information Processing Systems. MIT Press, 2011.
15