Xianbin Gu, Jeremiah D. Deng, Martin K. Purvis. Department of ..... 905, 2000. [5] Radhakrishna Achanta, Appu Shaji, Kevin Smith, Aure- lien Lucchi, Pascal Fua, ...
SUPERPIXEL-BASED IMAGE SEGMENTATION USING COVARIANCE MATRICES Xianbin Gu, Jeremiah D. Deng, Martin K. Purvis Department of Information Science, University of Otago, New Zealand ABSTRACT We propose an effective method for representation of superpixels with a covariance matrix and extract a new mid-level feature based on superpixels. With the incorporation of the new feature, a state-of-the-art superpixel-based image segmentation algorithm is able to outperform the other algorithms on the Berkeley image database. Furthermore, we show how to fuse the information given by different features and compare the performance of the different information fusion manners empirically. Index Terms— image segmentation, superpixel, covariance matrix, bipartite graph, information fusion
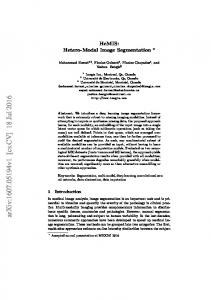
color covariance matrices. Unlike conventional color or texture features, the covariance matrices are not in Euclidean space but define a manifold that requires a Riemannian metric. Using the same graph-cut approach as in [8] we then propose several ways of merging similarity measured in two difference spaces, i.e., color and color covariance, when constructing the affinity graph. These methods are then tested in the experiments, and the final segmentation outcome is compared with the state-of-the-art algorithms. Fig.1 gives a quick comparison of our algorithm and SAS [8]. Note that the tiger is split into different chunks by SAS, but not by our method.
1. INTRODUCTION Superpixels, i.e., clusters of image pixels grouped together based on their perceptual similarity, are finding more and more applications in image processing. A number of clustering algorithms can be used to generate superpixels, e.g., density-based algorithms such as Mean Shift [1] and Quick Shift [2], and graph-based methods such as FH [3] and the Normalized Cuts [4]. State-of-the-art implementations such as SLIC [5] can form image superpixels very effectively as they are specially designed for the purpose. Superpixels have been used for object classification and localization [6], and tracking [7]. For image segmentation, as the superpixels are usually over-segmented, some further treatment is necessary. In [6] and [7], superpixels are treated as regions, and regionbased features are then extracted, based on which the image is segmented. There is a growing trend in treating superpixels as cues to be merged through spectral clustering [8][9]. More recently, Wang et al. [10] applied a sparse-coding method to superpixels in a `0 space, and using a modified affinity matrix of the Transfer Cut algorithm [8], achieved impressive results. In a wider context, it is found that the fusion of multiple cues can lead to improved results, e.g., combining color histogram, local binary patterns (LBP) feature, and Bag of Words [11]. Apparently a suitable representation of superpixels may improve the quality of superpixel-based image segmentation. Following these former studies, in this paper we look at improving superpixel feature representation by employing
(a)
(b)
(c)
Fig. 1. Visual comparison of segmentation results. (a) Original image??; (b) SAS; (c) Our method. The rest of the paper is organized as follows. Section 2 describes the feature extraction and the construction of the affinity matrix in our method. Section 3 reports the experimental results, and in Section 4, the conclusion of this paper is given. 2. FEATURE EXTRACTION Superpixels can be generated by using mean shift under different parametric settings. Our first focus in on extracting useful features from the generated superpixels based on which image segmentation can be carried out. Following previous work, first we use the average color as the feature for each superpixel. In particular, the CIELAB color space is adopted because of its good approximation to human vision. Denote a pixel vector in the Lab space as x. Each superpixel, denoted as Si = {x1 , x2 , · · · , xMi } (Mi is the number of pixels included in Si ), is then represented by its average color vector ci = E(xk ), xk ∈ Si
(1)
Thus the superpixels of an image are regarded as a set of points in a 3-D Lab space with an Euclidean metric. Empirically, using color information alone may not be enough for generating perfect image segmentation. Other non-Euclidean feature spaces could be considered. In particular, we are interested in using the color covariance within a superpixel, defined as Σi = E((xk − ci )(xk − ci )T ), xk ∈ Si
(2)
Covariance matrices as a tensor lie on a smooth manifold, hence requiring a non-Euclidean distance metric. Since they are symmetric and positive semi-definite, we can use the F¨orstner & Moonen metric [12] defined by v u n uX 2 ln λr , d(ΣA , ΣB ) = t
(3)
r=1
where ΣA , ΣB are two covariance matrices of dimension n × n, and λr (r = 1, · · · , n) are eigenvalues from the generalized eigenvalue problem |λΣA − ΣB | = 0. In our case, the covariance matrices are of 3 × 3 dimension, so the computing cost if very small.
3. GRAPH-BASED SEGMENTATION 3.1. Segmentation with superpixel-based graph cut We use Transfer Cuts (Tcut) [8] , a spectral graph-based partition algorithm, to perform the image segmentation. The Tcut algorithm is essentially a solution of the SVD problem. Firstly, a bipartite graph G(X, Y, B) is constructed over the pixels and superpixel sets of the input image I, where X denotes the vertices with value of pixels and superpixels; Y denotes the vertices representing superpixel sets created by different or the same superpixel algorithms with different parameter settings; B = [WX , WY ]T are the edges of the bipartite graph. Then, the cluster structure of the bipartite graph G can be found by singular vector decomposition of the normalized 1 1 b = D− 2 BD 2 . The left and right across-affinity matrix B X Y b contain the partition information of versingular vectors of B tices X and Y respectively. Moreover, the left singular vectors could be deduced from the right in the case of Tcut, i.e. b is unbalanced. This transfer makes when the structure of B the Tcut algorithm fast and effective. The partition of X can be found by solving the eigenproblem of LY v = λDY v,
(4)
b T D−1 B, DX = diag(Be), where LY = DY −WY , WY = B X T DY = diag(B e), and e is a vector with all elements equal to 1.
3.2. Construction of the affinity graph One major difference between this paper and other related work is in the construction of the affinity graph . In [8], each superpixel is connected with the nearest neighbourhood among its spatially adjacent superpixels, which fails to catch the relationship of those vertices that are separated by spacial distance but close in the feature space. In [10], this weakness was overcome by measuring the similarity of the superpixels with their `0 sparse-coding representation. However, this problem can be solved in another way. Our approach is to seek additional information that better represents the superpixels, so that the spatial constrains can be removed. This is achieved by using the covariance matrices as the complementary feature to color features. Let dij denotes the distance between superpixel i and j. Depending on the features being used, dij can be the Euclidean distance in the Lab space, or the non-Euclidean metric in Eqn.(3). The similarity wij between the two superpixels then is defined as follows: � −βd ij e if i 6= j (5) wij = 1, otherwise where β is a coefficient of the Gaussian-like kernel, and dij is normalized into [0,1]. In fact we have two different similarity matrices, W c and Σ W , representing the two different feature spaces of the superpixels. To fuse these two similarity matrices so as to construct an affinity graph, one solution is by means of the entrywise product (aka Hadamard product): W(HP ) = W c ◦ W Σ .
(6)
There are alternatives. de Sa [13] proposed a minimizing disagreement approach, which merges the similarity matrices by direct matrix product, which performs well with webpage clustering. The formula is given as: W(DP ) = W c W Σ ,
(7)
In addition, Joachims [14] combined two individual modalities by simply adding them together: W(AD) = W c + W Σ ,
(8)
Finally, the affinity graph is built by connecting the pixels to their superpixels and pairing the superpixels that are most similar to each other, forming a k-NN graph [15]). Our algorithm is summarized in Table 1. 4. EXPERIMENTS For the purpose of comparison, the evaluation of our algorithm is done on a standard benchmark image segmentation dataset, the BSD [16], and the parameters are set the same
Table 1. Algorithm Steps 1
Superpixel generation
2
Feature extraction
3
Similarity measurement
4
Graph construction
5
Segmentation
Use Mean shift and FH algorithms with different parameters to create over segmentation of the image; Compute the average colour value of the superpixels and their covariance matrix by Eqn.(2); Use Eqn.(5) to compute the similarity, and fuse W col and W cov with Eqn.(6), Eqn.(7), or Eqn.(8); Define a bipartite graph G(X, Y, B) over pixels and superpixels, and build the neighbourhood graph under k-NN; Partition graph G with the Transfer Cut algorithm.
as in [8] and [10]. Specifically, the superpixels are created by Mean Shift and FH; the weight between pixels and superpixels is fixed to 1 × 10⁻³ and β = 20 for the self-adaptive Gaussian kernel to smooth the weights between superpixels; and the parameter k of the k-NN graph is set to be 1. The evaluation is measured by four indicators: Probabilistic Rand Index (PRI) [17], Variation of Information (VoI) [18], Global Consistency Error (GCE) [19], and Boundary Displacement Error (BDE) [20]. For PRI, a higher value means better result, while for the rest, it is the reverse. The comparison is between the averages of the four indicators. The experiments are conducted in two parts. First, the same as in [8], we manually set the number of segmentations of every image to find the best performance of the algorithms for comparison. Secondly, following [10], we fix the segment number k = 2, which is more practical in real applications. In both scenarios our method gives competitive performance. We examine the performance of all three fusion methods in our experiments, and the results are listed in Table 2 and Table 3. Our method ranks the first place with PRI and VoI when the cluster number k is manually set, and when K is fixed to 2, it gets the best scores in PRI, VoI, and GCE. The scores of the SAS algorithm and `0 -sparse representation methods are obtained from [8] and [10]. As shown in Table 3, the choice of the color space does not seem to be significant as the utilization of the color covariance matrices seems to boost the performance to a competitive level even for RGB and HSV. The experiment results on the BSD dataset show that the new superpixel feature extracted by a covariance matrix apparently improves the average performance of the bipartite graph based algorithm when it is properly merged to other cues. By removing the spatial constraints, our method seems to handle long-range homogeneity well, forming superpixels well aligned with object contours. In our experiments,
Table 2. Performance comparison over the BSD with k adjusted manually Algorithms PRI VoI GCE SAS [8] 0.8319 1.6849 0.1779 `0 -sparse-coding [10] 0.8355 1.9935 0.2297 Ours (using WHP ) 0.8495 1.6260 0.1785 Ours (using WDP ) 0.8345 2.1169 0.2341 Ours (using WAD ) 0.8397 2.0359 0.2308
database
Table 3. Performance comparison over the BSD with k fixed to 2 Algorithms PRI VoI GCE SAS [8] 0.6179 2.011 0.1106 `0 -sparse-coding [10] 0.6270 2.0299 0.1050 Ours (using WHP ) 0.6312 1.9350 0.0820 Ours (using WDP ) 0.5998 2.0336 0.0892 Ours (using WAD ) 0.6284 1.997 0.0940 RBG (using WHP ) 0.6299 1.9361 0.0803 HSV (using WHP ) 0.6269 1.9582 0.0830
database
BDE 11.2900 11.1955 12.3034 12.0008 11.8868
BDE 42.2877 23.1298 35.8760 29.1803 24.6991 35.0269 31.8245
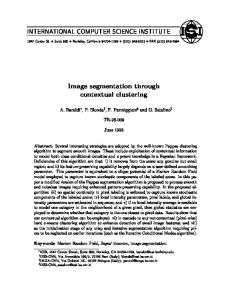
the Hadamard product seems to performs the best among the three fusing schemes, but the difference is sometimes marginal. Fig.2 shows more experimental results of our algorithm when k is set to 2. The method seems to be quite effective in foreground-background separation. 5. CONCLUSION We present a graph-based segmentation method by creating a new mid-level superpixel feature with covariance matrix and integrating it with the colour feature. One advantage of our method is information fusion, with which it is possible to observe the dataset at different references and extract features with more discriminative power. The empirical experiments show that our method produces competitive segmentation results compared with other existing methods. 6. REFERENCES [1] Dorin Comaniciu and Peter Meer, “Mean shift: A robust approach toward feature space analysis,” TPAMI, vol. 24, no. 5, pp. 603–619, 2002. [2] Quick Shift and Kernel Methods for Mode Seeking. Springer, 2008. [3] Pedro F Felzenszwalb and Daniel P Huttenlocher, “Efficient graph-based image segmentation,” IJCV, vol. 59, no. 2, pp. 167–181, 2004.
mentation using superpixels: A bipartite graph partitioning approach,” in CVPR’12. IEEE, 2012, pp. 789–796. [9] Tae Hoon Kim, Kyoung Mu Lee, and Sang Uk Lee, “Learning full pairwise affinities for spectral segmentation,” in CVPR’10. IEEE, 2010, pp. 2101–2108. [10] Xiaofang Wang, Huibin Li, Charles-Edmond Bichot, Simon Masnou, Liming Chen, et al., “A graph-cut approach to image segmentation using an affinity graph based on l0- sparse representation of features,” in ICIP’13, 2013. [11] Bin Cheng, Guangcan Liu, Jingdong Wang, Zhongyang Huang, and Shuicheng Yan, “Multi-task low-rank affinity pursuit for image segmentation,” in Computer Vision (ICCV), 2011 IEEE International Conference on, 2011, pp. 2439–2446. [12] Wolfgang F¨orstner and Boudewijn Moonen, “A metric for covariance matrices,” in Geodesy - The Challenge of the 3rd Millennium, ErikW. Grafarend, FriedrichW. Krumm, and VolkerS. Schwarze, Eds., pp. 299–309. Springer, 2003. [13] Virginia R de Sa, “Spectral clustering with two views,” in ICML workshop on learning with multiple views, 2005. [14] Thorsten Joachims, “Transductive learning via spectral graph partitioning,” in ICML’03, 2003, pp. 290–297. [15] Ulrike Von Luxburg, “A tutorial on spectral clustering,” Statistics and Computing, vol. 17, no. 4, pp. 395–416, 2007. Fig. 2. Some more results of our method (K = 2). [4] Jianbo Shi and Jitendra Malik, “Normalized cuts and image segmentation,” TPAMI, vol. 22, no. 8, pp. 888– 905, 2000. [5] Radhakrishna Achanta, Appu Shaji, Kevin Smith, Aurelien Lucchi, Pascal Fua, and Sabine S¨usstrunk, “Slic superpixels compared to state-of-the-art superpixel methods,” TPAMI, vol. 34, no. 11, pp. 2274–2282, 2012. [6] Brian Fulkerson, Andrea Vedaldi, and Stefano Soatto, “Class segmentation and object localization with superpixel neighborhoods,” in ICCV’09. IEEE, 2009, pp. 670–677. [7] Shu Wang, Huchuan Lu, Fan Yang, and Ming-Hsuan Yang, “Superpixel tracking,” in ICCV’11. IEEE, 2011, pp. 1323–1330. [8] Zhenguo Li, Xiao-Ming Wu, and Shih-Fu Chang, “Seg-
[16] Pablo Arbelaez, Michael Maire, Charless Fowlkes, and Jitendra Malik, “Contour detection and hierarchical image segmentation,” TPAMI, vol. 33, no. 5, pp. 898–916, 2011. [17] Ranjith Unnikrishnan, Caroline Pantofaru, and Martial Hebert, “Toward objective evaluation of image segmentation algorithms,” TPAMI, vol. 29, no. 6, pp. 929–944, 2007. [18] Marina Meil˘a, “Comparing clusterings: an axiomatic view,” in ICML’05. ACM, 2005, pp. 577–584. [19] David Martin, Charless Fowlkes, Doron Tal, and Jitendra Malik, “A database of human segmented natural images and its application to evaluating segmentation algorithms and measuring ecological statistics,” in ICCV’01. IEEE, 2001, vol. 2, pp. 416–423. [20] Jordi Freixenet, Xavier Mu˜noz, David Raba, Joan Mart´ı, and Xavier Cuf´ı, “Yet another survey on image segmentation: Region and boundary information integration,” in ECCV’02, pp. 408–422. Springer, 2002.