arXiv:q-bio/0702024v2 [q-bio.QM] 31 Mar 2008
Low-Statistics Discrete Fourier Transform Technique Applied to Long Period Biological Signals S. Sol´ıs-Ort´ız a,1, R. G. Campos b, J. F´elix c,∗, O. Obreg´on c,∗ a Instituto
de Investigaciones M´edicas, Universidad de Guanajuato. Le´ on 37320, Guanajuato, M´exico.
b Facultad c Instituto
de Ciencias F´ısico-Matem´ aticas, Universidad Michoacana, Morelia 58060, Michoac´ an, M´exico. de F´ısica, Universidad de Guanajuato. Lomas del Bosque 103, Frac. Lomas del Campestre, Le´ on GTO. 37150, M´exico.
Abstract Traditionally Fast Fourier Transform (FFT) has been used to obtain electroencephalographic (EEG) profiles of clinical use derived from short period brain signal sampling. Here we describe a technique based on Discrete Fourier Transform methods, valid for a few point statistics, that gives appropriate and accurate results, i.e., faultless transforms for periodic and non-periodic functions even with a few point sample. This technique is applied to find correlations between typically short period brain signals -Delta, Theta, Alpha 1, Alpha 2, Beta 1 and Beta 2- and Estrogen and Progesterone signals onward a long 28 day period for healthy young women. We have found typical frequencies and their corresponding periods for each one of these signals and, also, relative phases for coincident periods between two or more signals. For instance, in the relevant coincident periods the Progesterone seems to be essentially in phase with Theta, Alpha 1, Alpha 2 and Beta 1 and completely out of phase with Delta and Beta 2; in the relevant coincident periods, the Estrogen goes in phase with Delta and Theta and goes completely out of phase with Alpha 2. The procedure applied here provides a method to find typical frequencies, or periods, and phases between signals with the same period on a few point statistic samples. It grants a typical layout for healthy young women that could be of clinical usefulness, also when applied to other biological signals, for it generates specific patterns for the biological signals of interest and typical relations among them. Key words: Brain Signals, Estrogen, Progesterone, Discrete Fourier Transform PACS: 02.30.Nw, 87.10.+e, 87.80.Tq
Preprint submitted to Elsevier
31 March 2008
1
Introduction
Many clinical studies of biological signals reveal correlations between those signals, showing that in some way they are synchronized or are out of certain phase. To analyze these signals, the Fourier Transform Technique has become a basic tool (1; 2; 3); it consists mostly in computing a Fast Fourier Transform for a finite sequence of data sample (4); for instance, this is the standard way apparatuses and modern computerized technology provide information, according with their frequency range, of the well known brain signals Delta, Theta, Alpha 1, Alpha 2, Beta 1 and Beta 2 furnishing experts with electroencephalographic (EEG) profile of clinical use obtained from short period electrical signals (5; 6; 7). Here we propose a technique based on a Finite Fourier Transform to find typical frequencies, and their corresponding long periods, and characteristic phases, for the well known brain signals and the also well known Progesterone and Estrogen signal level in regular menstrual cycle healthy young women. This technique can also by applied to study any couple of biological signals, their frequencies and relative phases, specially in samples with very limited statistics.
2
Few Point Finite Fourier Transform
We present and discuss here the method of analysis used to study, particulary, the brain waves and sex hormone levels. This technique is based on a Discrete Fourier Transform that yields a quadrature formula for the integral Fourier Transform for periodic or non-periodic functions of a few point sample. We present succinctly the way in which this Discrete Fourier Transform is obtained. Detailed proofs and delineated examples of applications, outside the biological ambit, are given elsewhere (8; 9). ∗ corresponding authors Email addresses:
[email protected] (S. Sol´ıs-Ort´ız),
[email protected] (R. G. Campos),
[email protected] (J. F´elix),
[email protected] (O. Obreg´on). 1 We thank M. Corsi-Cabrera for comments during the development of this work, that was partially supported by CONCyTEG grants 06-16-K117-142, 06-16-K11799; CONACYT grants 51306-F, 2002-C01-39941, 60645, 52635, and Apoyo a la Investigaci´ on Cient´ıfica, Universidad de Guanajuato, 2006-2007.
2
2.1 The Discrete Fourier Transform Let us denote by fˆ(ω) the Fourier Transform of the function f (t) defined by Z∞
fˆ(ω) =
eiωt f (t)dt,
(1)
−∞
and let HN (t) and t1 , t2 , . . . , tN be the N th Hermite polynomial and its N zeros, respectively. Then, if f (t) is a function satisfying certain integrability conditions, the following quadrature formula holds: Z∞
fˆ(ωj ) =
eiωj t f (t)dt =
−∞
N X
Fjk f (tk ) + Rj ,
j = 1, 2, . . . , N.
(2)
k=1
Here, ωj is again a zero of HN (t) and its numerical value corresponds to tj , i.e., ωj = tj , and Fjk =
√
−1 2π(−1)j+k 2N −1 (N − 1)! NX il Hl (ωj )Hl (tk ). NHN −1 (ωj )HN −1 (tk ) l=0 2l l!
(3)
The component Rj stands for the error obtained when the integral transform is substituted by the sum of the right-hand side. Note that (2) can be written in matrix form as fˆ = F f + R,
(4)
where fˆ and f are the vectors whose elements are given by the Fourier Transform fˆ(ω) and the function f (t) evaluated at the zeros of HN (t) respectively, F is the matrix whose elements are given by (3) and R is the residual vector having small elements of order O(1/N). Therefore, F is a matrix representing the Fourier Transform in a vector space of finite dimension. To obtain the Fourier Transform fˆ(ω) of a given periodic signal f (t) sampled at the M time values τ1 , τ2 , . . . τM , the following steps should be carried out: (1) Select a number N of zeros of a Hermite polynomial. It should be chosen great enough to reduce the residual vector R but small enough to compute the matrix F with significant numerical precision. (2) Compute the Fourier matrix F . (3) Interpolate the M values f (τk ) with a trigonometric polynomial (the signal is assumed to be periodic). 3
(4) Shift and scale the interpolated function to the interval [−π, π] to yield a 2π-periodic signal f˜(t) (this step is not necessary, but convenient from the numerical point of view). (5) Evaluate the polynomial f˜(t) obtained in the previous step at the N zeros of Hermite to yield the vector f . (6) Compute the Fourier vector through the relation fˆ = F f . ˆ (7) Interpolate to a trigonometric polynomial f(ω) the values fˆk . This is a brief description of the proposed technique applied to the particular analysis of the absolute power of the brain signals and the female sex hormone levels which sensibly are assumed to be 28-day periodic signals. A preliminary discussion is as follows:
2.2 Analysis of Brain Signals
As it is well known, the plot of the square of the absolute value of the Fourier 2 ˆ Transform |f(ω)| displays the energy spectrum and gives the principal components of the original signal in the frequency domain. Therefore, to study the relation between the Fourier components of the brain signals and sex hormone levels, one would think that it is enough to use the above algorithm to compute the corresponding Fourier Transforms of each signal and compare their squares. However, a word of caution is necessary here. Since the Fourier Transform fˆ(ω) of the signal is composed by a real and an imaginary part, it is necessary to determine if one of them or both are important for the frequency analysis. Thus, we first compute the Fourier Transforms of each signal and take apart the real and imaginary components. Concerning the brain signals, it comes out that the real part of the transformed signals are all negligible compared with the great values they take near ω = 0. This behavior, typical of the Fourier Transform of a constant function, is common to all the real part of the transformed signals, whereas the imaginary part varies significantly among the different brain signals. This means that the real part of a transformed signal is more related to the power delivered than the imaginary part, which is more related to the frequency dependence of the signal. Therefore, only the imaginary part of the transformed brain signals will be taken into account in our analysis. On the other hand, in the case of the Progesterone and Estrogen levels, the real part of the Fourier Transform comes out as important as the imaginary part, consequently both of them are taken into account. We describe the used data in subsequent sections, for illustration purposes we consider the plots of the transformed data. In the Figure 1 the transformed signals are plotted against frequency in units of ( 2π ) days−1 . Clearly, the co28 incident maxima define common frequencies for some signals at frequencies 1, 2, 3 and 4 units, or equivalently, at periods of 28, 14, 10 and 7 days. For coincident frequencies, Figure 1, we will analyze only those where the value 4
of the transformed signals are above 13 , in this way we safely cut out all the contribution of the exposed technique to the data background, ensuring that we treat mainly the signal of interest. A more elegant and precise technique to study the signal background, and decide what is the optimal cut, is a simulation Monte Carlo technique; this is not necessary for the illustrative purposes of this section. By transforming to the time scale, we obtain the periods for which some Fourier components of the brain signals and sex hormones levels coincide, Figures 2 and 3. In order to get the relative phase between two coincident periods, we consider only the values around the desired frequency. This windowed signals are then back-transformed to the time variable to get their relative phase by comparing the corresponding Fourier components. We will describe in more detailed and precise form all the above procedure in the next section.
3
Illustration: Relationship Between Brain Signals and Sex Hormone Levels in Healthy Young Women
As it is well known for the short period brain signals, the apparatuses used to get them perform a Fast Fourier Transform and in this way they furnish experts with electroencephalographic (EEG) profile of clinical use obtained from these short periods (5; 6). For long periods (28 day periodic signals in the case at hand), an analogous novel procedure is established as follows: Assigning certain numerical value, i.e., the absolute power, to each brain signal at certain sampling times, generates data that can be interpolated and extrapolated through a long period, yielding an absolute power function of time for each signal (7). A further Fourier Transform is then performed (8; 9), to analyze these new functions, finding typical frequencies and their corresponding periods for each one of these signals and, also, relative phases for coincident periods between two or more signals. Our procedure of analysis can be applied, in principle, to any biological signal of interest. Sex hormone levels and brain waves are biological signals of interest in many areas of science; some studies have evidenced that in healthy young women these signals, and another ones, are co-related (10; 11; 12; 13). For instance, the absolute power of previous recorded EEG profile of nine healthy young women, with regular menstrual cycle (7; 14), and the variations of Estrogen and Progesterone levels were previously studied. For these women, their menstrual cycle was divided into post-menstrual, ovulatory, post-ovulatory, 5
pre-menstrual, and menstrual. The brain waves were sampled twice in each period, corresponding to the following days of menstrual cycle, respectively: 7, 8; 13, 14; 20, 21; 24, 25; 1, 3. The levels of Progesterone and Estrogen were taken from those reported in (15) for all the days of the 28-day period. A detailed description of the sample selection is described elsewhere (7; 14); this is a resume of this procedure: EEG segments were Fourier Transform and absolute power was obtained for the following broad bands: Delta 1.5-3.5 Hz, Theta 3.5-7.5 Hz, Alpha 1 7.5-9.5 Hz, Alpha 2 9.5-12.5 Hz, Beta 1 12.5-17.5 Hz, and Beta 2 17.5-30.0 Hz; relative power was also obtained for the same bands, considering that 100 % equals the total absolute power; inter and intrahemispheric correlations were obtained in time domain, after digitally filtering in order to separate the different frequency bands of the signal. For the purposes of this work, which is far along a numerical analysis of those records, Table 1 describes the absolute average power of the brain signals from the EEG profile; Table 2, the Progesterone and Estrogen levels. To perform the far along numerical analysis of the previous described data sample, the above mentioned Finite Fourier Transform is applied to it. This yields accurate transforms for periodic and non-periodic functions even with only a few point sample. These analysis output that the absolute power of the signals Delta, Theta, Alpha 1, Alpha 2, Beta 1, and Beta 2 -from the EEG profile-, and the Progesterone and Estrogen levels exhibit some characteristic frequencies and relative phases along the 28-day period. Therefore, a characteristic frequency pattern exists for each one of these signals; for some of them the corresponding periods coincide, in particular between a brain signal and one of the sex hormones, being some times out of phase. By this procedure, the EEG profile and Progesterone and Estrogen levels of healthy women are characterized and related through the use of the particular Fourier Transform we have selected. The approach and kind of analysis we introduce here could be generalized to study other biological signals and to search for possible similar patterns and relations to those shown in this work. The knowledge of the typical periods and phases among biological signals of clinical interest seems to provide us with an auxiliary tool of analysis of possible diagnostic use. We carried out the steps of the method outlined before, to obtain interpolated trigonometric polynomials for each signal. The mathematical technique of analysis is based on a Discrete Fourier Transform (DFT) that is different from the discrete one that yields the very well known Finite Fourier Transform (FFT) algorithm since the later stemmed from the analysis of periodic functions, whereas the former arose as a quadrature formula for the integral Fourier Transform (8) and yields accurate transformations for periodic and non-periodic functions with only a few point sample. This feature makes this 6
Table 1. Primary absolute average power brain signals, as the EEG delivered them, from the nine young women. Menstrual cycle days are divided as follows: 1,3: Menstrual phase; 7,8: Follicular phase; 13,14: Ovulatory phase; 20,21: Early luteal phase; 24,25: Late luteal phase.
7
Brain signal (Hz) (absolute power)/day
1
3
7
8
13
14
20
21
24
25
Delta
388.7
399.0
336.8
402.6
366.8
376.2
388.6
375.3
382.8
396.3
Theta
374.5
359.4
362.9
368.5
339.6
346.9
384.9
320.9
373.4
363.7
Alpha 1
378.6
329.6
417.3
323.5
331.5
283.6
413.0
304.4
390.7
360.0
Alpha 2
230.5
231.3
194.6
270.3
256.4
345.1
262.5
264.7
274.5
392.1
Beta 1
137.0
154.8
129.4
137.5
126.8
134.2
135.6
145.7
160.4
130.5
Beta 2
172.5
167.1
156.6
159.0
139.3
144.2
146.4
170.6
213.5
140.8
Table 2. Progesterone and Estrogen level signals through menstrual cycle. * values acquired interpolating reported data, the values are plausible.
8
Hormone/day
1
2
3
4
5
6
7
8
9
10
11
12
13
14
Progesterone (ng/ml)
0.04
0.04
0.15
1.15
0.90
0.03
0.13
0.40
0.13
0.64
0.35
0.15
0.50
0.15
Estrogen (pg/ml)
0.65*
0.80
0.20
0.20
0.20
0.20
0.65
0.55
0.70
0.60
0.75
1.00
2.40
3.10
Hormone/day
15
16
17
18
19
20
21
22
23
24
25
26
27
28
Progesterone (ng/ml)
0.05
1.35
0.85
2.15
3.00
5.00
4.40
4.65
3.18
2.00
1.05
0.65
0.35
0.15
Estrogen (pg/ml)
2.30
1.90
1.10
0.50
0.85
0.65
1.40
1.05
1.00
1.05
1.00
1.35
0.40
0.35*
new discrete transformation a very useful tool to study a function in the frequency domain and this is why we use it to obtain the typical frequencies of the eight signals. Technical details about this technique are given previously, in Section 2. By this procedure a characteristic frequency pattern for the power of each of the six EEG-signals and the two sex hormone levels is obtained. All the signal distributions are normalized to the height of the biggest peak, in each case, to compare them. There appear dominant frequencies. Some of them coincide, in particular, for a brain signal and one of the hormones. A pair of signals (or more) centered around a characteristic frequency of interest is taken into account in our study only if both of them have the value 13 at least, as already mentioned, and briefly discussed, in Section 2. This condition seems arbitrary, however the obtained results are plausible, for values smaller than 31 , signals probably arise from noise generated during the Finite Fourier Transform. The results correspond to trigonometric functions which main components present a novel and interesting relative phase. Therefore, signals with equal periods present, in general, a phase between them.
3.1 Results
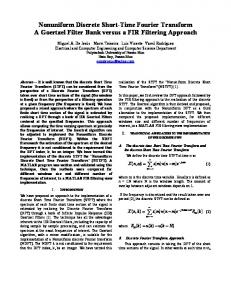
The frequency patterns for each one of the EEG-signals and the two hormone levels are plotted below for positive values of the frequencies, Figure 1. As it can be seen, each one of these eight signals presents a peculiar pattern, a characteristic spectrum. When one of the relevant brain signal periods essentially coincides with one of the hormone levels, the relative phase between the two corresponding time functions is displayed in Figures 2 and 3. It should be remarked that the phases presented in each one of these figures correspond to the relevant trigonometric components of the whole signal, centered around the frequency of interest, for we have related coincident relevant frequencies of the two signals considered. The absolute power of the brain signal and physiological concentration of Progesterone and Estrogen are shown in Figure 1, each one in different color and normalized to 1. In blue are plotted the Estrogen signals; in red, the Progesterone signals; in green, the brain signals. In (a), according to the selection criterion, the spectrum of the Delta brain signal versus Estrogen shows a coincidence in 4; versus Progesterone, a coincidence in 2. In (b), the spectrum of the Theta brain signal versus Estrogen shows a coincidence in 4; versus Progesterone, a coincidence in 3. In (c), the spectrum of the Alpha 1 brain signal versus Estrogen shows non coincidence; versus Progesterone, a coincidence in 2 and 3. In (d), the spectrum of the Alpha 2 brain signal versus Estrogen shows a coincidence in 1; versus Progesterone, a coincidence in 1, 2, and 3. In (e), the 9
Fig. 1. Intensity of the different brain signals superimposed to hormone level signals. −1 The horizontal scale is ( 2π 28 ) days ; vertical scale, normalized arbitrary units. It shows period coincidences and relative intensities in different points; when the peaks agree and both were bigger than 13 the coincidences were taken into account for this analysis, considering the smaller peaks as noise generated from the Finite Fourier Transform.
spectrum of the Beta 1 brain signal versus Estrogen shows non coincidence; versus Progesterone, a coincidence in 2 and 3. In (f), the spectrum of the Beta 2 brain signal versus Estrogen shows non coincidence; versus Progesterone, a coincidence in 3. The Fourier Transform of each brain signal and hormone levels, to analyze relative phases between them, were plotted superimposed each other. In Figure 2, the Estrogen levels and Delta, with 7-day period, in (a), show a relative phase of ( 2π ) days−1 0 days. The Estrogen levels and Theta, with 7-day 7 10
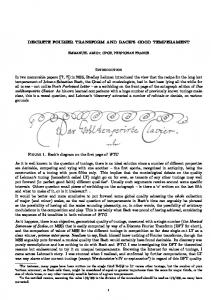
Fig. 2. Estrogen signals versus brain signals; red dots and red continuous lines are used indistinctly to clarify the figures. Delta and Theta are in phase with Estrogen −1 10 days. signal; Alpha 2, in relative phase of ( 2π 28 ) days
) days−1 0 days. The Estrogen levels period, in (b), show a relative phase of ( 2π 7 and Alpha 2, with 28-day period, in (c), show a relative phase of ( 2π ) days−1 10 28 days. In Figure 3, the Progesterone levels and Delta, 14-day period, in (a), ) days−1 5 days. The Progesterone levels and show a relative phase of ( 2π 14 Theta, 10-day period, in (b) show a relative phase of ( 2π ) days−1 0 days. The 10 Progesterone levels and Alpha 1, 14-day period, in (c), show a relative phase of ( 2π ) days−1 2.5 days. The Progesterone levels and Alpha 2, 10-day period 14 and 28-day period, in (d), show a relative phase of ( 2π ) days−1 0 days and 10 ( 2π ) days−1 5 days respectively. The Progesterone levels and Beta 1, 14-day 28 period, in (e), show a relative phase of ( 2π ) days−1 2.5 days. The Progesterone 14 levels and Beta 2, 10-day period, in (f), show a relative phase of ( 2π ) days−1 5 10 days. The biological signals shown in Figures 2 and 3 represent an important component of their corresponding whole signal. For the particular periods shown in Figures 2 and 3, the results here pose that a sex hormone and a brain signal could affect a particular brain way of going, essentially, by coming together or going oppositely. The phases are directly taken from the figures. Their accurate value is not necessary for the qualitative analysis performed here. 11
3.2 Discussion
We have presented a novel proposal to analyze biological signals and results obtained applying it to long period ones, showing that each signal present a typical frequency pattern. In the cases studied here, two or more biological signals present nearly coincident frequencies and, consequently, equal periods. It was possible to obtain the relative phases between two or more of these coincident signals. The most relevant frequency components of each signal represent an important part of the total power of this signal. Since two or more signals present, in this sense, roughly the same relevant frequency it is of interest to analyze the relative phases between them. As stated above in our analysis one finds the corresponding periods shown in Figures 2 and 3 for each one of the brain signals and sex hormones. The phases between one of the brain signals and one of the sex hormones are also shown in these figures. Mostly three evident cases emerge as follows: Normally the brain signal and the sex hormone go along together, or nearly together, or close completely opposite -this is, in phase, or close in phase, or completely out of phase-. Since each one of these frequency components of the signals represent an important part of the whole signal, this behavior seems to indicate the degree in which certain brain signal couple to a specific sex hormone during the 28-day period. In the cases presented here, in Figure 2, for the corresponding periods, the brain signals Delta and Theta seem to accompany the Estrogen -i.e., they are in phase all the time-; however, Alpha 2 acts nearly opposite to the Estrogen evolution -this is, they are out of phase all the time-. In Figure 3, for the corresponding periods, Theta, Alpha 1, and Beta 1 evolve essentially as the Progesterone -in other words, they are in phase all the time- whereas Delta and Beta 2 oppositely go all along the same period -this means, they are completely out of phase all the time-, and Alpha 2 for the two periods shown goes together with Progesterone -they are in phase, or close in phase-, presenting in one case a difference of phase. Brain signals have been extensively studied and associated, in the literature, with functional abilities and difficulties for certain brain processes (17; 18; 19). For example, Theta oscillations in human beings are involved with perceptual and memory encoding processing, common to verbal and non-verbal tasks (20), in working memory task (21), and also related with women anxiety (14); Alpha oscillations have been observed in memory processes (22); and Delta and Beta oscillations, in connection with attention (23; 24). Several studies have also reported on the possible relation of the different brain signals with diverse cognitive processes, particularly, associated with women sex hormones (25; 26; 27; 28). So, our results indicate for an important component of certain brain signal how one of the two sex hormones act nearly accompanying the brain signal or presenting a relevant relative phase. Therefore this method could be helpful complementing previous studies referring to the importance 12
Fig. 3. Progesterone signals versus the six brain signals. Different relative phases are presented between brain signals and Progesterone signal.
of certain brain signal and sex hormone in affinity with several duties and behaviors. A careful study of the meaning of our results, in connection with these aspects, is beyond the scope of our present work.
4
Conclusions
In the case analyzed in this work we have found a characteristic profile of coincident frequencies and relative phases among brain signals and hormone levels for healthy young women. The procedure applied here by means of the particular Finite Fourier Transform can also be applied to the analysis of other 13
type of human body signals. It provides a method to find typical frequencies, or periods, and phases between signals with the same period. It generates specific patterns for the biological signals of interest and typical relations among them.
References [1] C. M. Harris, The Fourier analysis of biological transients, Journal Neuroscience Methods 33 (1998)15-34. [2] J. Muthuswamy, N. V. Thakor, Spectral analysis methods for neurological signals, Journal Neuroscience Methods 31 (1998)1-14. [3] Z. Lin, J. D. Chen, Advances in time-frequency analysis of biomedical signals, Crit. Rev. Biomed. Eng. 24 (1996)1-72. [4] W. J. Thompson, J. R. Macdonald, Discrete and integral Fourier Transforms: Analytical examples, Proc. Natl. Acad. Sci. USA 90 (1993)69046908. [5] E. Niedermeyer, in Electroencephalography: Basic principles, clinical applications and related fields, (Eds Nierdermeyer, E., Lopes Da Silva, F.) (Williams & Wilkins, Maryland USA, 1993)131-152. Third Edition. [6] M. Steriade, P. Gloor, R. R. Llin´as, F. H. Lopes da Silva, M. M. Mesulam, Basic mechanisms of cerebral rhythmic activities, Electroencephalography and Clinical Neurophysiology 76 (1990)481-508. [7] S. Sol´ıs-Ortiz, M. Corsi-Cabrera, J. Ramos, M. A. Guevara, C. Arce, EEG oscillations during menstrual cycle, International Journal of Neuroscience 76 (1994)279-292. See also www.grasstechnologies.com. [8] R. G. Campos, L. Z. Ju´arez, A discretization of the continuous Fourier transform, Nuovo Cimento B100 (1992)703-711. [9] R. G. Campos, A quadrature formula for the Hankel transform, Numerical Algorithms 9 (1995)343-354. [10] D. Becker, O. D. Creutzfeldt, M. Schwibbe, W. Wuttke, Changes in physiological, EEG and psychological parameters in women during the spontaneous menstrual cycle and following oral contraceptives, Psychoneuroendocrinology 7 (1982)75-90. [11] M. D. Majewska, Steroids and brain activity, essential dialogue between body and mind, Biochemical Pharmacology 36 (1987)3781-3788. [12] M. J. Smith, L. F. Adams, P. J. Schmith, D. R. Rubinow, E. M. Wassermann, Effects of ovarian hormones on human cortical excitability, Annals of Neurology 51 (2002)599-603. [13] V. Walpurger, R. Pietrowsky, C. Kirschbaum, O. T. Wolf, Effects of the menstrual cycle on auditory event-related potentials, Hormone Behavior 46 (2004)600-606. [14] S. Sol´ıs-Ortiz, M. Corsi-Cabrera, EEG pattern of anxiety along the menstrual cycle, Revista Mexicana de Psicolog´ıa 12 (2002)187-195. [15] A. R. Midgley, L. V. Gay Jr, P. L. Keyes, J. S. Hunter, in Human re14
production: Conception and contraconception (eds E. S. E. Hafez, T.N. Evans) (Harper and Row, Publishers Inc. Hagerstown USA, 1973)201-236. See also www.caymanchem.com. [16] B. J. Fisch (Ed.), Descriptors of EEG activity, Fisch and Spehlmann’s EEG Primer, Basic principles of digital and analog EEG, 3rd. Edition, Elsevier Science, The Netherlands, 1999, pp. 145-154. [17] A. Zani, A. M. Proverbio, in The cognitive electrophysiology of mind and brain, eds A. Zani, A. M. Proverbio, Academic Press, San Diego CA USA, 2003, pp. 377-400. [18] M. Steriade, Grouping of brain rhythms in corticothalamic systems, Neurosciences 137 (2006)1087-1106. [19] G. Hwang, J. Jacobs, A. Geller, J. Danker, R. Sekuler, M. J. Kahana, EEG correlates of verbal and nonverbal working memory. Behavioral and Brain Functions (2005)1-20. [20] C. Tesche, J. Karhu, Theta oscillations index human hippocampal activation during a working memory task, Proc. Natl. Acad. Sci. USA 97 (2000)919-924. [21] W. Klimesch, B. Schack, P. Sauseng, The functional significance of Theta and upper Alpha oscillations, Exp. Psychol. 52 (2005)99-108. [22] T. Harmony et al, EEG Delta activity: An indicator of attention to internal processing during performance of mental tasks. Int. J. Phychophysiol. 171 (1996)161-171. [23] T. S. Bearden, J. E. Cassini, J. N. White, Electrophysiological correlates of vigilance during a continuous performance test in healthy adults, App. Neurophys. Biofeedback 29 (2004)175-188. [24] G. Fernandez et al, Menstrual cycle dependent neural plasticity in the adult human brain is hormone, task, and region specific, Journal Neuroscience 23 (2003)3790-3795. [25] S. Sol´ıs-Ortiz, M. A. Guevara, M. Corsi-Cabrera, Performance in a test demanding prefrontal functions is favored by early luteal phase Progesterone. An electroencephalographic study, Psychoneuroendocrinology 29 (2004)1047-1057. [26] V. Walpurger, R. Pietrowsky, C. Kirschbaum, O. T. Wolf, Effects of the menstrual cycle on auditory event-related potentials, Hormone Behavior 46 (2004)600-606. [27] A. Hollander, M. Hausmann, J. P. Hamm, M. C. Corballis, Sex hormonal modulation of hemispheric asymmetries in the attentional blink, Journal International Neuropsychology Soc. 11 (2005)263-272. [28] M. Corsi-Cabrera, L. Galindo-Vilchis, Y. Del R´ıo Portilla, C. Arce, J. Ramos-loyo, Within-subjects reliability and inter-session stability of EEG power and coherent activity in women evaluated monthly over nine months, Clinical Neurophysiology 118 (2007)9-21.
15