Region Assessment for Quantitative Analysis on High. Resolution Computed ... resolution computed tomography (HRCT) datasets. We present an offline, fully.
Lung Extraction, Lobe Segmentation and Hierarchical Region Assessment for Quantitative Analysis on High Resolution Computed Tomography Images� James C. Ross1,2,3 , Ra´ul San Jos´e Est´epar2,3 , Alejandro D´ıaz4,5 , Carl-Fredrik Westin2,3 , Ron Kikinis3 , Edwin K. Silverman1,5, and George R. Washko5 1 Channing Laboratory, Brigham and Women’s Hospital, Boston, MA Laboratory of Mathematics in Imaging, Brigham and Women’s Hospital, Harvard Medical School, Boston, MA 3 Surgical Planning Lab, Brigham and Women’s Hospital, Boston, MA 4 Pontificia Universidad Catolica de Chile, Chile Pulmonary and Critical Care Division, Brigham and Women’s Hospital, Boston, MA 2
5
Abstract. Regional assessment of lung disease (such as chronic obstructive pulmonary disease) is a critical component to accurate patient diagnosis. Software tools than enable such analysis are also important for clinical research studies. In this work, we present an image segmentation and data representation framework that enables quantitative analysis specific to different lung regions on high resolution computed tomography (HRCT) datasets. We present an offline, fully automatic image processing chain that generates airway, vessel, and lung mask segmentations in which the left and right lung are delineated. We describe a novel lung lobe segmentation tool that produces reproducible results with minimal user interaction. A usability study performed across twenty datasets (inspiratory and expiratory exams including a range of disease states) demonstrates the tool’s ability to generate results within five to seven minutes on average. We also describe a data representation scheme that involves compact encoding of label maps such that both “regions” (such as lung lobes) and “types” (such as emphysematous parenchyma ) can be simultaneously represented at a given location in the HRCT.
1 Introduction Regional assessment of lung disease is an important component of both diagnosis and therapy. Furthermore, localized quantitation of disease can provide insight into underlying disease mechanisms, and tools that offer such regional assessment are invaluable in large epidemiological studies. As an example, chronic obstructive pulmonary disease (COPD) is projected to be the 3rd leading cause of death worldwide by 2020 [1,2,3]. There are at least two distinct mechanisms of expiratory airflow obstruction in COPD subjects: emphysematous destruction of the lung parenchyma leading to airway collapse and intrinsic disease of the small airways [4,5]. The relative burden of airspace and airways disease can vary, however, within a cohort of subjects with similar lung function �
This work was supported by NIH grants U01-HL089897, U01-HL089856, K23HL08935301A1, and the Parker B. Francis Foundation.
G.-Z. Yang et al. (Eds.): MICCAI 2009, Part II, LNCS 5762, pp. 690–698, 2009. c Springer-Verlag Berlin Heidelberg 2009 �
Lung Extraction, Lobe Segmentation and Hierarchical Region Assessment
691
[6], and even regionally within the lungs of an individual [7]. Standard metrics, such as Forced Expiratory Volume in one second (FEV1), while reproducible and easy to measure are not necessarily indicative of the cause of airflow obstruction. Because of this, image based methods are useful for investigating subjects with COPD and helpful to define more homogeneous subsets of subjects within a cohort with comparable degrees of airflow obstruction. Anatomically, the lungs consist of distinct lobes: the left lung is divided into upper and lower lobes, while the right lung is divied into upper, middle, and lower lobes. Each lobe has airway, vascular, and lymphatic supplies that are more or less independent of those supplies to other lobes. Hence, the lobes represent natural anatomic units over which to compute image-based disease metrics. Fissures (left oblique, right oblique, and right horizontal) define the boundaries between the lobes and present as 3D surfaces that have greater attenuation (i.e. are brighter) than the surrounding lung parenchyma in HRCT datasets. However, advanced disease states (emphysema), atelectasis, and certain imaging protocols (expiratory acquisitions) can make it extremely difficult to detect the fissures in certain regions, and the judgment of medical professionals is typically needed in order to define the location of these structures. There have been a variety of lobe segmentation and fissure detection approaches developed to date. [8] uses fuzzy sets to define likely (oblique) fissure locations followed by a graph search to select the most probable fissure locations in 2D slices. Their method requires manual initialization, and results were reported on normal subjects. [9] first obtain a vessel segmentation from which they derive a distance map. The distance map, in conjunction with the original image and user interaction, drive watershed segmentation of the lobes. [10] perform lobe segmentation in a similar fashion but use a segmented airway tree to seed the watershed segmentation in an automatic framework. [11] generate ridge maps to enhance fissures and then use active open contours to delineate the fissures. Ten patients with pulmonary nodules were tested in their study. Algorithm run times were approximately five minutes and manual correction was needed in about 2.4% of the fissure regions. [12] use deformable mesh models to segment the lobes. They report accuracy results of 1 mm to 3 mm on a limited number of test sets. In order to address segmentation failure modes that can be caused by extreme disease states, specific imaging protocols, or insufficiently segmented auxiliary structures (vessels or airways), manual interaction is needed. In this paper we present an interactive lung lobe segmentation scheme that enables fast, easy, and accurate segmentation in spite of such factors. The segmentation results are incorporated into an overall data representation framework that provides a compact way to simultaneously encode both lung regions (e.g. lobes) and types (e.g. parenchyma states). This representation provides a convenient way to interrogate the underlying CT data to assist with both diagnosis and exploratory research. In section 2 the lobe segmentation method and preprocessing steps are presented. The data representation framework is also explained. In section 3 image preprocessing and lobe segmentation examples are shown. We also conducted a study in which two pulmonologists used the lobe segmentation tool to produce segmentations across twenty HRCT datasets; results of this study are presented. Finally, conclusions are drawn in section 4.
692
J.C. Ross et al.
2 Methods In this section we begin by explaining the data representation scheme we use to encode segmentation results throughout the image processing pipeline. Next, we describe the image pre-processing steps required for the interactive lobe segmentation tool. Finally, we describe the lobe segmentation tool itself and discuss its usage and the underlying segmentation algorithm. 2.1 Label Map Representation There are two abstract lung components of interest for the purposes of quantitative analysis: we refer to these as “regions” and “types”. Currently, the regions we extract include the left upper and lower lobes; the right lower, middle and upper lobes; the left lung; the right lung; and the whole lung. These regions are naturally represented in a hierarchical framework, as depicted in the figure below. E.g., the left upper lobe is a part of the left lung, which is a part of the whole lung. The types currently represented include airway, vessel, normal parenchyma, and emphysematous parenchyma. The label maps produced by the segmentation routines (described below) are represented as 16-bit data; the least significant eight bits are used to encode the lung region while the most significant eight bits encode the lung type. This enables up to 256 regions and 256 types to be encoded within a single dataset. Extensions to the list of regions given above could include each lobe’s set of sub-lobes, e.g., while extenstions to the list of types could include a range of disease states (ground glass parenchyma, reticular parenchyma, etc.) as well as other basic anatomical types (airway lumen, airway wall, etc). The table below provides an example numbering scheme. As an example the 16bit value corresponding to 00000110 00000100 (a base ten value of 1540) corresponds to reticular tissue in the right upper lobe while the 16 bit value 00000000 00000010 (a base ten value of 2) corresponds simply to right lung.
Fig. 1. Lung Region Hierarchy Diagram
2.2 Offline Image Processing We employ a completely automatic image processing pipeline to generate initial segmentations of regions and types of interest. Prior to segmentation, the HRCT dataset is pre-processed with a median filter using a 3x3x3 kernel. The lung mask is then segmented using an approach very similar to that outlined in [13]. Briefly, this involves initial gray level thresholding using Otsu’s method followed by morphological closing to fill in high
Lung Extraction, Lobe Segmentation and Hierarchical Region Assessment
693
Table 1. Regions and Types Numbering Scheme Region 8-Bit Value Type 8-Bit Value Undefined 0 Undefined 0 Whole Lung 1 Normal Parenchyma 1 Right Lung 2 Airway 2 Left Lung 3 Vessel 3 Right Upper Lobe 4 Emphysematous 4 Right Middle Lobe 5 Ground Glass 5 Right Lower Love 6 Reticular 6 Left Upper Lobe 7 Nodular 7 Left Lower Lobe 8
attenuating areas within the lung field. These high attenuating areas tend mostly to be pulmonary vessels, so we assign these voxels a type value of “vessel” with the understanding that in some cases diseased lung parenchyma (due to edema or fibrosis) may be labeled vessel as well. We label the data as such in the eventuality that voxels labeled as “vessel” may be able to initialize more sophisticated vessel segmentation routines, but it should be emphasized that vessel segmentation is not the current objective. In order to properly label airways outside the lung field (trachea and main bronchi), we apply connected component region growing to segment the airways. The patient orientation is obtained from the input DICOM dataset; this allows a search for the trachea from the correct end of the dataset: axial slices are iteratively considered until a small foreground structure in the center of the image is detected. Spatial consistency over several slices ensures that the object in question is indeed the trachea and not a spurious foreground object. Once this region of the trachea is determined, an initial threshold and seed location are selected to initialize the region growing algorithm. Region growing is repeated iteratively, and at each iteration the volume of the extracted airway tree is computed. Provided that the change in volume from one iteration to the next is within a certain tolerance, iteration continues with progressively higher threshold values. The final threshold is the one that lies at the boundary between acceptable airway segmentation and segmentation “ex- Fig. 2. User-defined points along right horizontal plosion” due to leakage into parenchyma. fissure To differentiate between airways that lie within the parenchyma and those that lie outside the lung field, each axial slice is considered in turn. Connected components is performed to identify regions labeled as lung and those segmented as airways. If the perimeter of an airway component is surrounded by at least 75% lung region, that entire component is assigned the region “whole lung”,
694
J.C. Ross et al.
otherwise the assigned region is “undefined”. Following the approach outlined in [13], minimum cost paths are determined using Dijkstra’s algorithm in order to separate the left and right lungs. Given the known patient orientation in the image field, the lung regions are further labeled as “left” and “right”. 2.3 Interactive Lobe Segmentation We have developed a novel interactive lung lobe segmentation tool that enables a user to quickly, easily, and accurately generate segmentations of the left upper and lower lobes and right upper, middle, and lower lobes. This tool has been incorporated as a plugin for the Slicer3 software application. From the user’s perspective, use of the tool involves loading the HRCT dataset and corresponding lung label map produced by the offline image processing pipeline. Next, the user simply scrolls through the HRCT data and clicks on points along three major fissures: left oblique, right oblique, and right horizontal. Figure 2 gives an example of two user-defined points along the right horizontal fissure. The dataset shown is an expiratory acquisition, and it is easy to appreciate from this example how faint fissures can be in such scans. Only a handful of points is necessary in most cases. Once these points have been selected, the segmentation algorithm is invoked, and the results are displayed for user verification. Additional points may then be added in areas of misalignment. The underlying algorithm driving the lobe segmentation method employs thin plate splines (TPS) [14] to define height surfaces corresponding to the three fissures. The equation of the height surface is given by f (x, y) = a1 + a2 x + a3 y +
n �
wi U (|Pi + (x, y)|)
(1)
i=1
where U (r) = r2 log r is the radial basis function. The coefficient vector, a = (a1 , a2 , a3 ), and the weight vector, w = (w1 , . . . , wn ) are determined from the n user-defined points, P , such that the height function’s bending energy, E, is minimized. � � � 2 �2 � 2 �2 � 2 �2 ∂ f ∂ f ∂ f E= + + dxdy (2) ∂x2 ∂x∂y ∂y 2 R2 Intuitively, TPS provide an interpolation scheme whereby a minimally curved surface is defined such that it passes through all the user-selected points. A separate 3D surface is defined for each of the three fissures. The region of support for the left oblique fissure is the projection of the left lung region onto the axial plane and similarly for the fissures in the right lung. Using the height surface equation given above, voxels in the lung field falling on the surface (within the tolerance of a voxel width) are assigned a type value of “oblique fissure” or “horizontal fissure” depending on which user defined point set is being considered. We impose the anatomically-based constraint that the right horizontal fissure is only defined as such in regions where its height function value is above that of the right oblique fissure. Connected component region labeling is then used to label the upper and lower lobes in the left lung from the lung regions that lie above and below the left oblique fissure, respectively. Similar logic is applied to label the regions in the right lung. Note that during this region relabeling operation, the types assigned from the offline processing (airway and vessel) remain unchanged.
Lung Extraction, Lobe Segmentation and Hierarchical Region Assessment
695
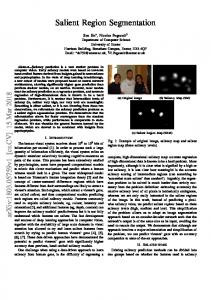
Fig. 4. Region and Type Segmentation. Top row shows example results from the automatic processing stage. Bottom row shows lobe segmentation results produced with the interactive lobe segmentation tool.
3 Results Figure 4 shows results produced from the automatic processing stage (top row) and the interactive lobe segmentation tool (bottom row). The image in the upper left depicts all regions (left and right lung) and types (airways and vessels) extracted during this stage. Vessel and airway types are isolated and displayed in the upper middle image, and airway type is depicted in the upper right. It should be emphasized that the lobe segmentation results (bottom row) are merged with the output of the offline, automatic image processing stage, so the final label map includes regions left upper lobe, left lower lobe, right upper lobe, right middle lobe, right lower lobe; and types airway, vessel, oblique fissure, and horizontal fissure. The utility of the region-type framework can be illustrated by figure 3 in which the Fig. 3. Airways and Lobe Regions following region-type pairs are isolated: (undefined, airway), (left upper lobe, airway), (left lower lobe, airway), etc. Alternatively, the user could have isolated all airways in the left lung, or simply the entire segmented airway tree, all with a single label
696
J.C. Ross et al.
map representation. A similar analysis could be performed on the lung parenchyma: by assigning all voxels below a specified threshold a type value corresponding to “emphysematous parenchyma” [15], interrogation of the dataset for disease localization can be efficiently performed. The results of the lobe segmentation tool’s usability study are summarized in table 2. Twenty datasets were included in the study, and both inspiratory and expiratory exams were considered. A range of disease states (including severe emphysema) are also represented. The two users had slightly different approaches to the tool’s usage. Reader 1 tended to rely on the tool’s interpolation more: he initially deposited a small number of points, executed the algorithm, and then added additional points in areas of misalignment. This was repeated until a satisfactory result was reached. While this approach ultimately required fewer points per fissure (compared to reader 2), the iterative nature caused longer overall usage times. (Usage time here is defined as the length of time between the first clicked point and the final declaration of a satisfactory result). Reader 2 initially deposited many more points per fissure than reader 1, but this resulted in a better fit surface at the outset, required fewer fixes, and resulted in shorter usage times overall. Note that algorithm run time is mainly a function of the HRCT dataset size, and the dependence on the number of user-defined points is negligible.
Table 2. Lobe Segmentation Results. Cases are numbered and indicated as either inspiratory (i) or expiratory (e). The first three columns for each reader represent the number of points selected for the left oblique fissure (LO), the right oblique fissure (RO), and the right horizontal fissure (RH). Euclidean distances reflect the agreement between the two readers for each of the three fissures. Reader 1 LO RO RH Usage Time (minutes) Case 1 (e) 12 8 8 6 Case 2 (i) 10 13 14 7 Case 3 (e) 8 24 9 9 Case 4 (i) 6 18 7 9 Case 5 (e) 8 13 6 6 Case 6 (i) 11 15 9 5 Case 7 (e) 9 16 15 6 Case 8 (i) 10 15 9 6 Case 9 (e) 16 22 15 10 Case 10 (i) 9 13 14 9 Case 11 (e) 12 20 11 7 Case 12 (e) 9 12 20 10 Case 13 (i) 12 31 10 11 Case 14 (i) 11 16 11 6 Case 15 (e) 20 12 6 6 Case 16 (e) 6 17 6 5 Case 17 (i) 9 20 8 8 Case 18 (e) 13 15 6 5 Case 19 (i) 17 17 6 7 Case 20 (e) 11 24 7 8 Average 10.95 17.05 9.85 7.3
LO 10 10 26 20 13 14 13 18 8 16 17 17 19 13 13 11 10 13 29 22 15.6
Reader 2 RO RH Usage Time (minutes) 16 8 7 21 11 7 41 13 10 26 14 5 18 5 3 17 7 5 19 10 4 15 7 5 23 14 4 15 12 4 23 19 4 18 13 4 22 17 3 17 15 7 20 11 4 30 14 8 41 13 8 23 11 5 24 16 6 43 14 12 23.6 12.2 5.75
Euclidean Distance (mm) LO RO RH Algorithm Time (seconds) 1.75 ± 2.72 2.58 ± 2.36 4.08 ± 3.69 45 0.98 ± 0.98 3.60 ± 3.41 2.96 ± 3.75 53 4.17 ± 5.15 4.35 ± 4.81 2.97 ± 3.39 48 2.83 ± 2.69 2.68 ± 2.72 2.39 ± 2.15 46 2.75 ± 2.59 1.10 ± 1.32 0.80 ± 0.70 26 1.86 ± 1.73 0.85 ± 0.98 4.51 ± 3.93 41 1.45 ± 1.54 0.81 ± 0.81 6.44 ± 8.15 26 1.61 ± 1.76 2.19 ± 2.15 1.21 ± 1.14 33 1.25 ± 1.27 3.74 ± 4.60 2.27 ± 1.90 32 0.99 ± 1.07 4.01 ± 3.75 4.32 ± 7.73 46 1.32 ± 1.23 1.29 ± 1.24 0.66 ± 0.81 51 3.32 ± 3.25 1.69 ± 2.60 3.02 ± 2.73 35 1.82 ± 1.75 2.21 ± 2.95 7.19 ± 6.41 45 1.59 ± 1.51 1.23 ± 1.40 4.02 ± 4.91 50 5.18 ± 7.17 2.43 ± 2.63 2.43 ± 2.22 40 1.59 ± 1.55 1.88 ± 2.10 13.7 ± 13.8 43 2.08 ± 2.03 4.21 ± 4.82 2.02 ± 2.00 53 1.85 ± 1.78 1.24 ± 1.18 4.45 ± 3.68 50 1.34 ± 1.36 1.72 ± 1.85 1.65 ± 1.41 54 1.84 ± 1.97 1.37 ± 1.34 19.4 ± 18.67 46 2.08 ± 2.26 2.26 ± 2.45 4.52 ± 4.66 43.15
Despite the two approaches used by readers 1 and 2, the overall segmentation results are in very good agreement across the set of exams. This is reflected by the Euclidean distances between fissures presented in table 2. Disagreement is most noticable for the right horizontal fissure. This is not surprising given that minor (horizontal) fissures are incomplete more often than major (oblique) fissures [16]. In such cases readers have to make boundary decisions in the near absence of image features.
Lung Extraction, Lobe Segmentation and Hierarchical Region Assessment
697
4 Conclusion We have presented a novel lung lobe segmentation tool that requires minimal user input and enables users to quickly and accurately produce lobe segmentations in spite of severe disease states and imaging protocols that can obscure fissure image signatures. The tool enables satisfactory results to be produced on HRCT datasets (which can consist of several hundred slices) in a matter of minutes. We also described a data representation scheme that provides a flexible framework for regional image quantitation.
References 1. Gulsvik, A.: The global burden and impact of chronic obstructive pulmonary disease worldwide. Monaldi. Arch. Chest. Dis. 56(3), 261–264 (2001) 2. Pauwels, R.A., Buist, A.S., Ma, P., Jenkins, C.R., Hurd, S.S.: Global strategy for the diagnosis, management, and prevention of chronic obstructive pulmonary disease: National heart, lung, and blood institute and world health organization global initiative for chronic obstructive lung disease (GOLD): executive summary. Respir Care 46(8), 798–825 (2001) 3. Mannino, D.M.: COPD: epidemiology, prevalence, morbidity and mortality, and disease heterogeneity. Chest 121(5 Suppl.), 121S–126S (2002) 4. Hogg, J.C., Macklem, P.T., Thurlbeck, W.M.: Site and nature of airway obstruction in chronic obstructive lung disease. N. Engl. J. Med. 278(25), 1355–1360 (1968) 5. Cosio, M.G., Hale, K.A., Niewoehner, D.E.: Morphologic and morphometric effects of prolonged cigarette smoking on the small airways. Am. Rev. Respir. Dis. 122(2), 265–321 (1980) 6. Washko, G., Criner, G., Mohsenifar, Z., Sciurba, F., Sharafkhaneh, A., Make, B., Hoffman, E., Reilly, J.: Assessing pulmonary function with CT scanning in patients with emphysema. Proc. Am. Thorac. Soc. 2(A259) (2005) 7. Hasegawa, M., Nasuhara, Y., Onodera, Y., Makita, H., Nagai, K., Fuke, S., Ito, Y., Betsuyaku, T., Nishimura, M.: Airflow limitation and airway dimensions in chronic obstructive pulmonary disease. Am. J. Respir. Crit. Care Med. 173(12), 1309–1315 (2006) 8. Zhang, L., Reinhardt, J.M.: Detection of lung lobe fissures using fuzzy logic. In: Chen, C.T., Clough, A.V. (eds.) Medical Imaging 1999: Physiology and Function from Multidimensional Images. Proc. of SPIE, vol. 3660, pp. 188–199 (1999) 9. Kuhnigk, J.M., Hahn, H., Hindennach, M., Dicken, V., Krass, S., Peitgen, H.O.: Lung lobe segmentation by anatomy-guided 3D watershed transform. In: Sonka, M., Fitzpatrick, M. (eds.) Medical Imaging 2003: Image Processing. Proc. of SPIE, vol. 5032, pp. 1482–1490 (2003) 10. Ukil, S., Hoffman, E.A., Reinhardt, J.M.: Automatic lung lobe segmentation in x-ray CT images by 3D watershed transform using anatomic information from the segmented airway tree. In: Fitzpatrick, M., Reinhardt, J.M. (eds.) Medical Imaging 2005: Image Processing. Proc. of SPIE, vol. 5747, pp. 556–567 (2005) 11. Wang, J., Betke, M., Ko, J.P.: Pulmonary fissure segmentation on CT. Med. Image Anal. 10(4), 530–547 (2006) 12. Blaffert, T., Barschdorf, H., Von Berg, J., Dries, S., Franz, A., Klinder, T., Lorenz, C., Renisch, A., Wiemker, R.: Lung lobe modeling and segmentation with individualized surface meshes. In: Reinhardt, J.M., Pluim, J. (eds.) Medical Imaging 2008: Image Processing. Proc. of SPIE, vol. 6914 (2008)
698
J.C. Ross et al.
13. Hu, S., Hoffman, E., Reinhardt, J.: Automatic lung segmentation for accurate quantitation of volumetric x-ray CT images. IEEE Transactions on Medical Imaging 20(6), 490–498 (2001) 14. Bookstein, F.: Principal warps: thin-plate splines and the decomposition of deformations. IEEE Transactions on Pattern Analysis and Machine Intelligence 11(6) (June 1989) 15. Muller, N., Staples, C., Miller, R.: “Density mask”: an objective method to quantitate emphysema using computed tomography. Chest 94, 782–787 (1988) 16. Aziz, M., Ashizawa, K., Nagaoki, K., Hayashi, K.: High resolution CT anatomy of the pulmonary fissures. Journal Thoracic Imaging 19(3), 186–191 (2004)