Nov 22, 2018 - Co-directeur de th`ese ...... images are normalized into a common standard space. ...... A common approach to solve the PCA problem, see [80â82]), is to compute a ..... another (the folds share many of their learning samples), the direct ...... her/him progressively achieve voluntary control over her/his own ...
Machine Learning with Structured Sparsity : application to Neuroimaging-based Phenotyping in Autism Spectrum Disorder and Schizophrenia Amicie De Pierrefeu
To cite this version: Amicie De Pierrefeu. Machine Learning with Structured Sparsity : application to Neuroimaging-based Phenotyping in Autism Spectrum Disorder and Schizophrenia. Machine Learning [stat.ML]. Université Paris-Saclay, 2018. English. .
HAL Id: tel-01930711 https://tel.archives-ouvertes.fr/tel-01930711 Submitted on 22 Nov 2018
HAL is a multi-disciplinary open access archive for the deposit and dissemination of scientific research documents, whether they are published or not. The documents may come from teaching and research institutions in France or abroad, or from public or private research centers.
L’archive ouverte pluridisciplinaire HAL, est destinée au dépôt et à la diffusion de documents scientifiques de niveau recherche, publiés ou non, émanant des établissements d’enseignement et de recherche français ou étrangers, des laboratoires publics ou privés.
NNT : 2018SACLS329
Apprentissage automatique avec parcimonie structur´ee: application au ph´enotypage bas´e sur la neuroimagerie pour la schizophr´enie Th`ese de doctorat de l’Universit´e Paris-Saclay pr´epar´ee `a l’Universit´e Paris-Sud
´ Ecole doctorale n◦ 575 Physique et Ing´enierie - ´electrons, photons, sciences du vivant (EOBE) Sp´ecialit´e de doctorat : Imagerie et physique m´edicale
Th`ese pr´esent´ee et soutenue ` a Saclay, le 19/10/2018, par
Amicie de Pierrefeu
Composition du Jury : Arnaud Cachia Professeur, Universit´e Paris Descartes Nikolaos Koutsouleris Professeur, Department of Psychiatry and Psychotherapy, Ludwig-Maximilians-University, Germany Andre Marquand Professeur, Donders Institute for Brain, Cognition and Behaviour, Radboud University, The Netherlands
Pr´esident du jury
Rapporteur (absent)
Rapporteur
Arthur Tenenhaus Professeur, Central-Supelec, Universit´e Paris Saclay
Examinateur
Marie-Odile Krebs Professeur, Centre Hospitalier Sainte-Anne, Service Hospitalo-Universitaire, Universit´e Paris Descartes
Examinateur
Philippe Ciuciu Neurospin, Universit´e Paris Saclay
Directeur de th`ese
Edouard Duchesnay Neurospin, Universit´e Paris Saclay
Co-directeur de th`ese
NNT : 2018SACLS329
Machine Learning with Structured Sparsity: application to Neuroimaging-based Phenotyping in schizophrenia PhD thesis of University Paris-Saclay prepared at University Paris-Sud
Doctoral school n◦ 575 Physics and Engineering - electrical, optical, Bio (EOBE) PhD speciality : Imaging and Medical Physics Thesis presented and defended in Saclay, on October, 19th , 2018, by
Amicie de Pierrefeu
Composition of the jury : Arnaud Cachia Professor, University Paris Descartes Nikolaos Koutsouleris Professor, Department of Psychiatry and Psychotherapy, Ludwig-Maximilians-University, Germany Andre Marquand Professor, Donders Institute for Brain, Cognition and Behaviour, Radboud University, The Netherlands
President of the jury
Reviewer (absent)
Reviewer
Arthur Tenenhaus Professor, Central-Supelec, Universit´e Paris Saclay
Examiner
Marie-Odile Krebs Professor, Centre Hospitalier Sainte-Anne, Service Hospitalo-Universitaire, University Paris Descartes
Examiner
Philippe Ciuciu Neurospin, Universit´e Paris Saclay
Supervisor
Edouard Duchesnay Neurospin, Universit´e Paris Saclay
Co-supervisor
To Philippe, For your unfailing encouragement and constant support throughout this PhD journey
Contents Introduction Context . . . . . . Etiology . . . . . . Challenges . . . . . Thesis organization Thesis contribution
. . . . .
. . . . .
. . . . .
. . . . .
. . . . .
. . . . .
. . . . .
. . . . .
1 1 1 4 5 7
1 Background: Brain Imaging 1.1 Neuroanatomy . . . . . . . . . . . . . . . . . . . . . . . . . . . . 1.2 MRI to study the brain . . . . . . . . . . . . . . . . . . . . . . . 1.2.1 Structural MRI . . . . . . . . . . . . . . . . . . . . . . . . 1.2.2 Functional MRI . . . . . . . . . . . . . . . . . . . . . . . . 1.3 Image Processing, Features Engineering and Univariate Statistics 1.3.1 Structural MRI features . . . . . . . . . . . . . . . . . . . 1.3.2 Functional MRI features . . . . . . . . . . . . . . . . . . . 1.3.3 Univariate methods of analysis . . . . . . . . . . . . . . . 1.4 Review of MRI findings in schizophrenia . . . . . . . . . . . . . . 1.4.1 MRI findings in chronic schizophrenia . . . . . . . . . . . 1.4.2 MRI findings in early stages of schizophrenia . . . . . . . 1.5 Conclusion . . . . . . . . . . . . . . . . . . . . . . . . . . . . . .
. . . . . . . . . . . .
. . . . . . . . . . . .
. . . . . . . . . . . .
. . . . . . . . . . . .
. . . . . . . . . . . .
. . . . . . . . . . . .
. . . . . . . . . . . .
9 9 10 10 10 11 11 13 14 14 15 16 17
2 Background: Machine Learning 2.1 Overview . . . . . . . . . . . . . . . . . . . . . . 2.1.1 Supervised Algorithms . . . . . . . . . . . 2.1.1.1 Linear Regression . . . . . . . . 2.1.1.2 Linear Classification . . . . . . . 2.1.2 Regularization strategy . . . . . . . . . . 2.1.2.1 Overfitting . . . . . . . . . . . . 2.1.2.2 Penalties . . . . . . . . . . . . . 2.2 Review of Machine Learning studies . . . . . . . 2.2.1 Diagnostic Studies of Schizophrenia . . . 2.2.2 Limitations . . . . . . . . . . . . . . . . . 2.2.2.1 Independent validation datasets 2.2.2.2 Sample size . . . . . . . . . . . . 2.2.2.3 Medication effects . . . . . . . . 2.2.2.4 Interpretability . . . . . . . . . . 2.3 Conclusion . . . . . . . . . . . . . . . . . . . . .
. . . . . . . . . . . . . . .
. . . . . . . . . . . . . . .
. . . . . . . . . . . . . . .
. . . . . . . . . . . . . . .
. . . . . . . . . . . . . . .
. . . . . . . . . . . . . . .
. . . . . . . . . . . . . . .
20 20 21 21 22 23 23 23 25 25 28 28 29 29 30 30
. . . . .
. . . . .
. . . . .
. . . . .
. . . . .
. . . . .
. . . . .
. . . . .
. . . . .
. . . . .
. . . . .
. . . . .
. . . . .
i
. . . . .
. . . . .
. . . . .
. . . . .
. . . . .
. . . . .
. . . . .
. . . . .
. . . . . . . . . . . . . . .
. . . . .
. . . . . . . . . . . . . . .
. . . . .
. . . . . . . . . . . . . . .
. . . . .
. . . . . . . . . . . . . . .
. . . . .
. . . . . . . . . . . . . . .
. . . . .
. . . . . . . . . . . . . . .
. . . . .
. . . . . . . . . . . . . . .
. . . . .
. . . . . . . . . . . . . . .
. . . . . . . . . . . . . . .
CONTENTS 3 Supervised Machine Learning with Structured Sparsity 3.1 Interpretable Machine Learning . . . . . . . . . . . . . . . 3.1.1 The need for interpretability . . . . . . . . . . . . 3.1.2 Sparse penalties limitations . . . . . . . . . . . . . 3.2 Spatial Regularization . . . . . . . . . . . . . . . . . . . . 3.2.1 GraphNet penalty . . . . . . . . . . . . . . . . . . 3.2.2 TV-Enet penalty . . . . . . . . . . . . . . . . . . . 3.3 Reformulating TV as a linear operator . . . . . . . . . . . 3.3.1 3D image . . . . . . . . . . . . . . . . . . . . . . . 3.3.2 Mesh of cortical surface . . . . . . . . . . . . . . . 3.4 Optimization of TV-Enet . . . . . . . . . . . . . . . . . . 3.4.1 Nesterov’s smoothing of the structured penalty . . 3.5 The CONESTA algorithm . . . . . . . . . . . . . . . . . . 3.5.1 Duality gap . . . . . . . . . . . . . . . . . . . . . . 3.5.2 Determining the optimal smoothing parameter . . 3.5.3 Algorithm . . . . . . . . . . . . . . . . . . . . . . . 3.6 Conclusion . . . . . . . . . . . . . . . . . . . . . . . . . .
ii
. . . . . . . . . . . . . . . .
. . . . . . . . . . . . . . . .
. . . . . . . . . . . . . . . .
. . . . . . . . . . . . . . . .
4 Unsupervised Machine Learning with Structured Sparsity 4.1 Abstract . . . . . . . . . . . . . . . . . . . . . . . . . . . . . . . . 4.2 Introduction . . . . . . . . . . . . . . . . . . . . . . . . . . . . . . 4.3 Method . . . . . . . . . . . . . . . . . . . . . . . . . . . . . . . . 4.3.1 Single component computation . . . . . . . . . . . . . . . 4.3.2 Alternating minimization of the bi-convex problem . . . . 4.3.3 Minimization of the loading vectors with CONESTA . . . 4.3.4 The algorithm for the SPCA-TV problem . . . . . . . . . 4.4 Experiments . . . . . . . . . . . . . . . . . . . . . . . . . . . . . . 4.4.1 Simulation study . . . . . . . . . . . . . . . . . . . . . . . 4.4.2 Surfaces meshes of cortical thickness in Alzheimer disease 4.4.3 Parameters effects . . . . . . . . . . . . . . . . . . . . . . 4.5 Conclusion . . . . . . . . . . . . . . . . . . . . . . . . . . . . . . 5 Identifying a neuroanatomical signature of schizophrenia 5.1 Abstract . . . . . . . . . . . . . . . . . . . . . . . . . . . . . 5.2 Introduction . . . . . . . . . . . . . . . . . . . . . . . . . . . 5.3 Methods . . . . . . . . . . . . . . . . . . . . . . . . . . . . 5.3.1 Participants . . . . . . . . . . . . . . . . . . . . . . 5.3.2 MRI preprocessing and features extraction . . . . . 5.3.3 Machine learning algorithms . . . . . . . . . . . . . 5.3.4 Cross-validation and performance assessment . . . . 5.3.5 Interpreting the predictive signature . . . . . . . . . 5.3.6 Brain signature and symptomatic level . . . . . . . . 5.3.7 Brain signature and medication/duration of illness . 5.4 Results . . . . . . . . . . . . . . . . . . . . . . . . . . . . . . 5.4.1 Prediction performances . . . . . . . . . . . . . . . 5.4.2 Neuroanatomical predictive signature . . . . . . . . 5.4.3 Brain signature and symptomatic level . . . . . . . .
. . . . . . . . . . . . . .
. . . . . . . . . . . . . .
. . . . . . . . . . . . . .
. . . . . . . . . . . . . . . .
. . . . . . . . . . . .
. . . . . . . . . . . . . .
. . . . . . . . . . . . . . . .
. . . . . . . . . . . .
. . . . . . . . . . . . . .
. . . . . . . . . . . . . . . .
. . . . . . . . . . . .
. . . . . . . . . . . . . .
. . . . . . . . . . . . . . . .
. . . . . . . . . . . .
. . . . . . . . . . . . . .
. . . . . . . . . . . . . . . .
. . . . . . . . . . . .
. . . . . . . . . . . . . .
. . . . . . . . . . . . . . . .
. . . . . . . . . . . .
. . . . . . . . . . . . . .
. . . . . . . . . . . . . . . .
32 32 32 33 33 33 34 34 35 35 36 36 39 39 42 42 43
. . . . . . . . . . . .
45 45 46 49 49 49 50 51 52 54 57 61 63
. . . . . . . . . . . . . .
65 65 66 67 68 69 69 70 71 71 71 72 72 73 75
CONTENTS . . . . . . .
. . . . . . .
. . . . . . .
. . . . . . .
. . . . . . .
6 Prediction of pre-hallucinations patterns in schizophrenia patients 6.1 Abstract . . . . . . . . . . . . . . . . . . . . . . . . . . . . . . . . . . . 6.2 Introduction . . . . . . . . . . . . . . . . . . . . . . . . . . . . . . . . . 6.3 Methods . . . . . . . . . . . . . . . . . . . . . . . . . . . . . . . . . . . 6.3.1 Participants and experimental paradigms . . . . . . . . . . . . 6.3.2 Imaging parameters . . . . . . . . . . . . . . . . . . . . . . . . 6.3.3 fMRI Preprocessing . . . . . . . . . . . . . . . . . . . . . . . . 6.3.4 Computation of samples . . . . . . . . . . . . . . . . . . . . . . 6.3.5 Supervised analysis . . . . . . . . . . . . . . . . . . . . . . . . . 6.3.6 Unsupervised Analysis . . . . . . . . . . . . . . . . . . . . . . . 6.4 Results . . . . . . . . . . . . . . . . . . . . . . . . . . . . . . . . . . . . 6.4.1 Supervised analysis . . . . . . . . . . . . . . . . . . . . . . . . . 6.4.2 Unsupervised analysis . . . . . . . . . . . . . . . . . . . . . . . 6.5 Discussion . . . . . . . . . . . . . . . . . . . . . . . . . . . . . . . . . . 6.5.1 Supervised analysis . . . . . . . . . . . . . . . . . . . . . . . . . 6.5.2 Unsupervised analysis . . . . . . . . . . . . . . . . . . . . . . . 6.5.2.1 Relevance of weight maps . . . . . . . . . . . . . . . . 6.5.3 Perspectives . . . . . . . . . . . . . . . . . . . . . . . . . . . . . 6.6 Conclusion . . . . . . . . . . . . . . . . . . . . . . . . . . . . . . . . .
. . . . . . . . . . . . . . . . . .
. . . . . . . . . . . . . . . . . .
. . . . . . . . . . . . . . . . . .
84 . 84 . 85 . 87 . 87 . 88 . 88 . 89 . 90 . 91 . 92 . 92 . 94 . 95 . 97 . 99 . 99 . 100 . 101
7 Investigating the heterogeneity across the schizophrenia spectrum 7.1 Abstract . . . . . . . . . . . . . . . . . . . . . . . . . . . . . . . . . . . 7.2 Introduction . . . . . . . . . . . . . . . . . . . . . . . . . . . . . . . . . 7.3 Methods . . . . . . . . . . . . . . . . . . . . . . . . . . . . . . . . . . 7.3.1 Participants . . . . . . . . . . . . . . . . . . . . . . . . . . . . . 7.3.2 MRI features extraction . . . . . . . . . . . . . . . . . . . . . . 7.3.3 Cluster analysis . . . . . . . . . . . . . . . . . . . . . . . . . . 7.3.4 Generalization . . . . . . . . . . . . . . . . . . . . . . . . . . . 7.3.5 Statistical analysis . . . . . . . . . . . . . . . . . . . . . . . . . 7.3.6 Supervised analysis . . . . . . . . . . . . . . . . . . . . . . . . . 7.4 Results . . . . . . . . . . . . . . . . . . . . . . . . . . . . . . . . . . . . 7.4.1 Anatomical specificities of cluster . . . . . . . . . . . . . . . . . 7.4.2 Generalization . . . . . . . . . . . . . . . . . . . . . . . . . . . 7.4.3 Clinical specificity of clusters . . . . . . . . . . . . . . . . . . . 7.4.4 Supervised analysis . . . . . . . . . . . . . . . . . . . . . . . . . 7.5 Discussion . . . . . . . . . . . . . . . . . . . . . . . . . . . . . . . . . . 7.6 Conclusion . . . . . . . . . . . . . . . . . . . . . . . . . . . . . . . . .
. . . . . . . . . . . . . . . .
. . . . . . . . . . . . . . . .
. . . . . . . . . . . . . . . .
. . . . . . . . . . . . . . . .
5.5
5.6
5.4.4 Brain signature and medication/duration Discussion . . . . . . . . . . . . . . . . . . . . . . 5.5.1 Prediction performances . . . . . . . . . . 5.5.2 Neuroanatomical predictive signature . . 5.5.3 Medication/duration of illness influence . 5.5.4 Future work . . . . . . . . . . . . . . . . . Conclusion . . . . . . . . . . . . . . . . . . . . .
iii
Conclusion
of illness . . . . . . . . . . . . . . . . . . . . . . . . . . . . . .
influence . . . . . . . . . . . . . . . . . . . . . . . . . . . . . . . . . . . .
76 77 77 78 81 81 81
103 103 104 105 105 106 106 107 107 107 108 108 110 110 112 113 115 117
CONTENTS Contributions . . Limitations . . . Perspectives . . . Closing remarks .
iv . . . .
. . . .
. . . .
. . . .
. . . .
. . . .
. . . .
. . . .
. . . .
. . . .
. . . .
. . . .
. . . .
. . . .
. . . .
. . . .
. . . .
. . . .
. . . .
. . . .
. . . .
. . . .
. . . .
. . . .
. . . .
. . . .
. . . .
. . . .
. . . .
. . . .
. . . .
. . . .
. . . .
. . . .
. . . .
. . . .
. . . .
117 117 119 121
Summary in French
123
Bibliography
130
Introduction Context According to the World Health Organization, schizophrenia has been identified as one of the ten most debilitating diseases affecting human, with approximately 1% prevalence worldwide. Schizophrenia has a highly heterogeneous phenotypic expression although its most common symptoms include abnormal social behaviour and a severe decline in cognitive function. The symptoms most commonly emerge when individuals are in their late adolescence and early adulthood. It is thus associated with a huge burden on the patient, its relatives and the society due to the early onset of the disease and its incurable nature with persisting symptoms. Despite years of scientific research, the etiology and the underlying pathophysiological mechanisms of schizophrenia still remain elusive. The risk of developing schizophrenia, however, primarily involves a combinations of genetic contribution and environmental factors
Etiology The etiology of schizophrenia is poorly understood but is thought to be multifactorial, with both genetic and environmental origins. Indeed, it has been demonstrated that schizophrenia has some strong genetic basis and is hereditary: Observations of familial schizophrenia incidence reveal that there exists a genetic susceptibility to this disease. The risk rate for children whose parents both suffer from schizophrenia equals 28% [1].Yet, the genetic architecture of the disorder is heterogeneous. So far, schizophrenia has been linked to more than 100 genes that affect various aspects of functioning and neurodevelopment [2]. However, the genetic component may not always be sufficient to trigger symptoms. Indeed, schizophrenia is a complex disease in which interaction between genes and the environment occurs [3]: A combination of environmental components are thought to determine the occurrence of schizophrenia in genetically predisposed people. Environmental factors include a wide range of influences that can interact with each other: such as obstetric condition [4], exposure to chemicals during prenatal stage [5], prenatal stress [6]. The link between cannabis use and onset of psychosis have also been highlighted: In a longitudinal study of 45570 Swedish conscripts, it was found that those who smoked cannabis had double the risk 1
Introduction
2
of developing schizophrenia during a 15 year period of follow- up [7]. Subsequent studies correlated the degree of exposure to cannabis with the risk of developing schizophrenia [8].
Symptoms and Medication Two major dimensions of symptoms have been described in schizophrenia: the positive symptoms, and the negative symptoms. Basically, they reflect the extent of diminished function (for negative symptoms) and the extent of the excess of function (for positive symptoms)
• Negative symptoms point out a significant decrease of normal functioning, such as the lack of interest in everyday life activities. Those symptoms are arduous to diagnose since they are frequently confounded with other mental disorders such as depression. Those negative symptoms include lack of emotion, neglect of personal hygiene, social withdrawal, lack of motivation, decreased ability to plan activities. • Positive symptoms point out an excess of normal functioning. They include hallucinations, delusion (false belief), thought disorders, (trouble organizing thoughts, and often result in stopping mid-sentence, speaking nonsensically) disorganized and inappropriate behavior, movement disorder (agitated or repeated movements).
Most of the time, negative symptoms appear years before the positive symptoms. However, the positive symptoms respond more successfully to medication, than the negative symptoms. Schizophrenia patients also suffer from cognitive deficits. They include impaired memory and attention, trouble making sense of information, impaired ability to organize, poor decision making. Medication is the key element of the treatment of schizophrenia. It is typically treated with antipsychotic medications, to attenuate symptoms such as hallucination and delusion that invalidate the most patients in their everyday life [9]. Some studies have conclusively proved their effects: Only 20% of patients on antipsychotic medication relapse compared to 80% of untreated patients [10]. However, a non-negligeable proportion of patients do not respond to antipsychotic treatment and still suffer from severe symptoms, that can be extremely disruptive for ones life.
Course of Illness Currently, an increasing number of studies focus on the early stages of schizophrenia to understand the origin of the disease. The developmental hypothesis postulates that a vulnerability to the onset of psychosis might be present in some patients. Indeed, some genes that are involved in the neurodevelopement and/or some environmental factors occurring in the early life of the subjects might induce some brain development abnormalities, which in
Introduction
3
turn might predispose to the subsequent onset of psychosis. Current research aims to define prevention targets and increase the effectiveness of care, which would in particular help reduce the development of the deficits associated to schizophrenia, improve the functional prognosis (social relationship and, professional integration) and possibly reduce the incidence of the disease. In the majority of cases, at the beginning of the disorders, it is possible to distinguish several evolutionary phases [11, 12], see Figure 1. The premorbid phase extends from birth until the onset of the first signs of the disease. Schizophrenia disease lies mostly dormant during this premorbid phase and begins to express itself after puberty, when individuals enter the high-risk period of adolescence and early adulthood. Indeed, this first phase is followed by a prodromal phase whose onset is marked by the emergence of the first clinical signs of the disease. These are identified by the subject and his entourage. They are called prodromal symptoms. When those symptoms progress to the syndromal level, the person is said to suffer from a first-episode psychosis. Treatment during the first episode of psychosis can be very effective and patients who are treated at this early stage have a good chance of symptomatic remission and subsequent recovery. However, patients do not all achieve the same level of response to treatment and they may not recover as well either.
Figure 1: Stages of schizophrenia disease
Diagnosis Early detection of schizophrenia is crucial: It allows early intervention methods and we know that providing early care to reduce the duration of untreated psychosis has been identified as a predictor of long-term outcome in schizophrenia [13]. Indeed, the duration of untreated psychosis is highly correlated to an unfavourable evolution of the disease. Thus, reducing the delay of first care is crucial. Therefore, being able to spot patients that are still in an
Introduction
4
early stage of the disorder is essential. Moreover the annual economic cost of schizophrenia is significant and the largest factors contributing to such cost are lost productivity and adult care. With successful application of early intervention methods, in addition to improving the quality of life of the patients and their relatives, the economic cost related to schizophrenia can also be significantly reduced. For successful application of early intervention methods, early detection of schizophrenia is required. Currently, the diagnosis of schizophrenia is mostly based on clinical manifestations, that are the results of observations of the patients behavior. Schizophrenia specific criteria are described in the Diagnostic and Statistical Manual (DSM) published by the American Psychiatric Association [14]. The DSM states that schizophrenia is characterized by delusions, hallucinations, disorganised speech and behaviour, and other symptoms that cause social or occupational dysfunction. For a diagnosis, at least two symptoms must have been present for six months. However, such diagnosis approach is somewhat time-consuming, subjective, and not always accurate at the early stage of schizophrenia because of the high co-morbidity with other mental disorders. Increasing research interest focuses on the schizophrenia prodromal stage and ways to identify the disease earlier. Future goals intend to find a more biologically based diagnostic of schizophrenia. However, schizophrenia remains an elusive illness as it encompasses a wide range of symptoms with no clear disease biomarker that can be readily assesed. The availability of additional objective measures would assist clinicians in the process of diagnosis with obvious benefits to improve the efficiency of treatment and the outcome. [15]. Magnetic resonance imaging (MRI) has proven to be an effective approach to uncover structural brain abnormalities at the group-level in schizophrenia patients [16, 17]. Recent progress in machine learning together with the availability of large datasets now pave the way for automatic detection of schizophrenia-specific features, solely based on MRI data. We will see in this thesis how advances in machine learning applied to neuroimaging can provide relevant insights into the brain architecture of patients to support clinicians in the diagnosis process.
Challenges The use of machine-learning in neuroimaging offers new perspectives in early diagnosis and prognosis of brain diseases. Indeed, ML algorithms can jointly examine all brain features to capture complex relationships in the data in order to make inferences at a single-subject level. However, despite initial promising results, this progress has not yet been converted into new clinical applications and significant challenges still need to be tackled for translational implementation of such findings in psychiatry. First, in the context of predictive signature discovery, it is crucial to understand the brains structural patterns that underpin a prediction. Unfortunately, in most cases, despite accurate prediction performance, classifiers still behave
Introduction
5
as black box models, not providing objective neuroanatomical markers and by that ruling out the prospect of clinical applications. Second, reproducibility of the predictive model across sites is also questionable. So far, most studies use individuals scanned at a single acquisition site. Such results are difficult to generalize to large-scale clinical setting, with subjects scanned in multiple sites. Third, from a clinical perspective, the true value of MRIbased prediction yet to be unlocked lies in early diagnosis. Indeed, accurately predicting chronic schizophrenia patients affected by the disorder for a long time does not provide ground-breaking insight. Instead, what is clinically relevant is the identification of patients still in an early stage of the disease. Fourth and last, the heterogeneity of schizophrenia disease impedes an objective diagnosis of the disorder and the implementation of a targeted treatment. Indeed, the accuracy reached by previous studies do not offer a trust-worthy level of prediction. The identification of homogeneous subtypes of patients based on their neuroanatomical profiles would provide relevant information on the heterogeneity of the disorder while at the same time improve the specificity of diagnosis. We will discuss those major challenges faced by machine learning methods applied to neuroimaging data in this thesis.
Thesis organization The subject of this thesis spans over several fields (Figure 2):
Figure 2: Big data in Neuroimaging is at the intersection of 3 disciplines
Fundamental principles are presented in Chapters 1 and 2: Relevant concepts related to brain imaging will be introduced in Chapter 1, together with details on the pre-processing steps
Introduction
6
required to perform a standard MRI analysis. Chapter 1 also include a comprehensive review of MRI findings in schizophrenia in the literature. Chapter 2 provides a overview of state-ofthe-art machine learning tools and how they can cope with the specificities of neuroimaging data. It also contains a broad review of machine learning studies in schizophrenia. Chapter 3 intends to target the interpretability issue in supervised machine learning tasks. We discuss the incorporation of sparse and spatial regularizations in the learning problem, to force the solution to adhere to biological priors, producing more plausible and interpretable solutions. Additionally, the algorithm used to solve the problem is presented. Similarly, Chapter 4 focuses on the interpretability issue in unsupervised machine learning tasks. We show how structured sparsity in PCA has the ability to provide interpretable components that capture most of the variability in brain images. Subsequent chapters 5 and 6 contain experimental results using the structured and sparse ML methods on sMRI and fMRI data of schizophrenia patients. Chapter 5 intends to leverage different sMRI-based features and state-of-the-art classifiers in a large multi-site cohort to evaluate prediction performance and predictive signature interpretability across sites and stages of schizophrenia. Chapter 6 demonstrates the performance and versatility of machine learning with structured sparsity in the study of resting-state fMRI scans that precede hallucinations. Chapter 7 addresses the issue of heterogeneity in schizophrenia using a stratification pipeline based on sMRI, to obtain more homogeneous subgroups of patients. Finally, the conclusion chapter contains a comprehensive summary of the main findings yielded in this thesis and a general discussion concerning the limitation of this work and future perspectives.
Introduction
7
Thesis contribution This PhD leads to several journal publications: Structured sparse principal components analysis with the TV-elastic net penalty. Amicie de Pierrefeu, Tommy L¨ ofstedt, Fouad Hadj-Selem, Mathieu Dubois, Renaud Jardri, Thomas Fovet, Philippe Ciuciu, Vincent Frouin, Edouard Duchesnay. IEEE transactions on Medical Imaging, 2017 Prediction of activation patterns preceding hallucinations in patients with schizophrenia using machine learning with structured sparsity. Amicie de Pierrefeu, Thomas Fovet, Fouad Hadj-Selem, Tommy L¨ofstedt, Philippe Ciuciu, Stephanie Lefebvre, Pierre Thomas, Renaud Lopes, Renaud Jardri, Edouard Duchesnay. Human Brain Mapping, 2018 Identifying a neuroanatomical signature of schizophrenia, reproducible across sites and stages, using machine-learning with structured sparsity. Amicie de Pierrefeu, Tommy L¨ ofstedt, Charles Laidi, Fouad Hadj-Selem, Julie Bourgin, Tomas Hajek, Filip Spaniel, Marian Kolenic, Philippe Ciuciu, Nora Hamdani, Marion Leboyer, Thomas Fovet, Renaud Jardri, Josselin Houenou, Edouard Duchesnay. Acta Psychiatrica Scandinavica, 2018 Interpretable and stable prediction of schizophrenia on a large multisite dataset using machine learning with structured sparsity Amicie de Pierrefeu, Tommy L¨ ofstedt, Charles Laidi, Fouad Hadj-Selem, Philippe Ciuciu, Josselin Houenou, Edouard Duchesnay. 8th International Workshop on Pattern Recognition in Neuroimaging, June 2018
Chapter 1
Background: Brain Imaging Recent advances in neuroimaging have enabled scientists to visualize and study the human brain in vivo and develop tools to uncover its anatomy and function. Commonly used neuroimaging modalities include X-ray computed tomography (CT), positron emission tomography (PET) and magnetic resonance imaging (MRI). The work presented in this thesis will focus on MRI, which is described in this chapter, after a brief introduction to human brain anatomy.
1.1
Neuroanatomy
The human brain is broadly divided into three main areas: the cerebellum, the cerebrum, and the brain stem. The cerebrum is the largest section of the brain and is composed of the cerebral cortex and several subcortical structures, such as the hippocampus and basal ganglia. Outlying the cerebrum is the cerebral cortex. The cerebral cortex is divided into four lobes (see Figure 1.1): Frontal, Parietal, Occipital and Temporal. Each lobe is specialized in different functions. The frontal lobe is the part of the brain that governs reasoning and decisionmaking. It also plays an important role in long-term memory. The parietal lobe, is primarily responsible for visuo-spatial processing, recognition and navigation. The occipital lobe is the visual processing center of the brain. Finally, the temporal lobe, is responsible for auditory processing and also associated with memory and speech.
9
Chapter 1 Background: Brain Imaging
10
Figure 1.1: The four lobes of the brain
The cerebral cortex is composed of grey matter (GM). The grey matter mainly contains neuronal cell bodies responsible for neural processing and others functions. In contrast, white matter (WM) mostly involves glial cells and myelinated axon tracts connecting the different regions of the brain, and play support function to the neurons (e.g. by providing nutrients to the neurons). At the center of the brain are the ventricles, filled with cerebrospinal fluid (CSF) that facilitates the transmission of several substances across brain areas.
1.2
MRI to study the brain
MRI provides an effective and noninvasive approach to investigate the brain. We will review two main MRI modalities that will be used in this manuscript.
1.2.1
Structural MRI
sMRI uses the phenomenon of nuclear magnetic resonance (NMR) of the hydrogen atom in order to produce high-resolution, detailed images of internal body structures and tissues. The strength of the magnetic field determines the resolution of the images. sMRI provides good contrast between grey matter and white matter.
1.2.2
Functional MRI
functional Magnetic Resonance Imaging (fMRI) is a functional neuroimaging approach to monitor local brain activity. fMRI uses the same technology than MRI with the difference that it exploits the local variations in the blood oxygen level instead of the hydrogen atom. Indeed, it indirectly tracks the brain activity by measuring the blood-oxygen- level-dependent
Chapter 1 Background: Brain Imaging
11
(BOLD) signal [18], which reflects the amount of brain activity. When a brain region becomes active, the amount of blood flow through that specific local area is increased. It subsequently leads to a relative surplus in local blood oxygen. This variation in the level of oxygenated blood induces a change in the local magnetic field and thus affects the MR signal. In next section, we will review the different types of features than can be extracted from both sMRI and fMRI images in the scope of machine learning algorithms in neuroimaging.
1.3
Image Processing, Features Engineering and Univariate Statistics
The success of machine learning analysis not only depends on the algorithm itself, but also on the features used to represent the information contained in the brain images. It is thus crucial to extract powerful data features from the images. Each MRI brain scan is composed of thousands of 3D volumetric units called voxels, in which the local anatomical or functional information is recorded. However, A certain number of pre-processing steps are required for statistical testing. We need to end up with a data matrix X containing the p features for each subject. We will review below the pre-processing steps necessary for the statistical analysis of both structural and functional MRI.
1.3.1
Structural MRI features
The choice of the features to extract from the sMRI scan is crucial since it reflects different aspects of the brain anatomy. Along this thesis, we worked with three different type of features: voxel-based grey matter density, vertex-based cortical thickness and region of interest-based measurements. All three features types have been widely used in various studies focusing on the neuroanatomical abnormalities in schizophrenia patients.
• Grey matter voxel-based morphometry (VBM) : The features represent the probability of grey matter density for each voxel (see Figure 1.2).
Figure 1.2: Voxel-based features
The preprocessing steps necessary to obtain voxel-based features, described in [19], are conducted using SPM12 software: Segmentation, Normalization and Modulation.
Chapter 1 Background: Brain Imaging
12
Briefly, the sMRI images are first segmented into GM, WM and CSF. The second step is crucial to achieve spatial correspondence of voxels across subjects: All brain images are normalized into a common standard space. All the normalized images are finally modulated by the jacobian of their transformation. This enables to preserve the quantity of tissue. No spatial smoothing is conducted. This produced thousands of features representing the local grey matter volume at each voxel. One advantage of VBM is that it is not restricted to a specific brain region,such as region-of-interest (ROI) analysis (described below) that requires a priori assumptions. • Vertex-based cortical thickness: The goal is to obtain a measurement of the cortical thickness at each vertex of the cortical surface of the brain (see Figure 1.3). The cortical thickness directly characterizes the amount of cortex atrophy. Thus, this is a potentially relevant biomarker to assist in the diagnostic of schizophrenia. The measurements of cortical thickness are realized with Freesurfer software v6.1. All cortical thickness maps are registered on the default template of Freesurfer. Thus, the dimensionality of the vertex-based features is very high, since it corresponds to the number of vertex on the cortical mesh of the brain.
Figure 1.3: Vertex-based features
• Regions-of-interest : Freesurfer software is used to segment the brain into cortical parcels and subcortical regions using Desikian atlas. It automatically extract measurements on those ROIs: Cortical thickness and volume of subcortical regions (see Figure 1.4). Compared to voxel-based and vertex-based approach, the number of features yielded by ROIs-based approach is limited.
Figure 1.4: Region-of-interest based features
Chapter 1 Background: Brain Imaging
1.3.2
13
Functional MRI features
fMRI data is typically composed of temporal sequences of 3D images acquired every 2 to 3 seconds (see Figure 1.5). Spatial resolution is usually 3mm3 when acquired with 3 Tesla (T) scanners.
Figure 1.5: Functional neuroimaging data consist in 4D images. Figure from nilearn
However, the fMRI signal is very noisy, raw fMRI images are not interpretable with naked eyes. Indeed, we are mostly interested in relatively small signal co-variation across voxels and not by the values themselves. Quality assessment of preprocessed fMRI data has to be conducted manually and by relying on dedicated medical imaging software. It requires numerous preprocessing steps before extracting correct features for subsequent analyses. Preprocessing steps First step is the slice timing correction that temporally realigns the slices of each 3D volume. Second, the motion correction step allows spatial realignement between each 3D volume acquired at different point in time. It allow to filter out potential movement of the subject within the scanner. Third step, is the coregistration of each 3D fMRI volume acquires with the anatomical image of the subjects (the sMRI). The last step is the normalization of each subject in the common brain template. General Linear Model Once the fMRI time series are preprocessed, features can be extracted from the images. The most used approach is the General Linear Model (GLM) [20]. The idea is to regress the signal of each individual voxel independently, onto a set of regressors explaining the setting of the experiment (such as condition/task). Therefore, for each voxel, regression coefficients associated with each regressor are computed. Thus different activation maps can be derived, corresponding to each condition/task. Those activation maps are used for subsequent statistical inferences. Usually, in fMRI studies we want to test an effect of interest, to identify voxels that are significantly activated in condition A compared to condition B. This is answered by conducted a contrast between the activation map yielded under condition A, and the activation map yielded in condition B. The difference between the two maps
Chapter 1 Background: Brain Imaging
14
yields a statistical map, with independent statistical test for each voxel of the image. This results into thousands of statistical tests. To avoid multiple comparison issue, it is crucial to correct for the number of statistical tests carried out. Activation maps can also be used for group analysis to investigate the consistency of an effect of interest across subject of a given population.
1.3.3
Univariate methods of analysis
In univariate analysis, each voxel is treated independently from each other when testing an effect of interest. We assume parametric statistical models at each voxel, using the General Linear Model (GLM). The objective is to describe the data as a linear combination of experimental effects, potentially confounding variables and an error term [20]. Regular statistical inference is then used to test hypotheses with the GLM parameters. Inferences in neuroimaging settings may be related to the anatomical (VBM) of functional differences between two populations.
Figure 1.6: Univariate statistics: Associations at the group level
1.4
Review of MRI findings in schizophrenia
A large number of brain imaging studies have attempted to uncover the pathophysiology of schizophrenia. They have reported numerous structural and functional brain abnormalities associated with the disorder.
Chapter 1 Background: Brain Imaging
1.4.1
15
MRI findings in chronic schizophrenia
The first CT study of schizophrenia [21] revealed particularly enlarged lateral ventricles in patients suffering from schizophrenia. Such finding has been widely replicated in subsequent MRI studies [22]. First MRI studies have also reported significant reduction in total brain volume in schizophrenia patients compared to healthy controls: An extensive meta-analysis of regional brain volume studies in schizophrenia, [23] revealed that the mean cerebral volume of schizophrenia patients was 2% smaller than the mean volume of healthy controls in 58 studies involving 1,588 schizophrenia patients. Decreased volumes in frontal and temporal lobes have also been consistently observed in studies comparing schizophrenia patients and healthy controls using ROI or VBM ([16, 22–24]). Medial temporal lobe structures, notably the amygdala, hippocampus and superior temporal gyrus were found to be highly reduced in patients. In a large meta-analysis conducted by [24], almost 50% of the studies involved revealed grey matter deficits in the left superior temporal, parahippocampal and inferior frontal gyrus. Abnormalities in the parietal and occipital lobes have also been reported but less consistently across studies. Contradictory findings have been reported concerning the anterior cingulate: Two recent meta-analyses have reported decreased volume in the anterior cingulate gyrus in schizophrenia patients [25, 26] while some other studies found an increased volume in that same area. [27, 28] This considerable between-studies heterogeneity in findings might be explained by different factors. First, the methodological differences in the pre-processing steps could partly account for this heterogenity. Specifically, it has been shown that the smoothing kernel and/or the choice of statistical analysis (either voxel-level or cluster-level significance) can significantly impact the results [24]. Moreover, schizophrenia is a complex and very heterogeneous disorder. Small size cohorts, typically composed of highly-selected patients, suffer from a bias in the recruitment. They do not represent the full and broad cross-sectional spectrum of the disorder phenotype. Groups of patients may vary with respect to age, anti-psychotic treatment and/or treatment duration, symptom severity, presence of comorbidity or substance use. Given this variability, a significant heterogeneity can be found in the effect-sizes and patterns of brain differences across studies [29–31]. To date, most studies recruited subjects scanned at a single acquisition site (i.e., the subjects were scanned at the same site, using similar scanner hardware and MRI protocols). Such results are difficult to generalize to large-scale clinical settings, i.e., with patients scanned at widely different locations [32]. Consequently, multi-site populations are instrumental to achieve consistency and reproducibility in the results. Meta-analyses, that combine statistical findings from numerous research studies are extremely helpful to assess the effect size of each result. They also have the ability to identify and sometimes explain the heterogeneity of the findings across studies. A recent metaanalysis, [33], revealed that GM abnormalities in the superior temporal gyrus, anterior cingulate gyrus and the thalamus were more widespread in studies with more males, more
Chapter 1 Background: Brain Imaging
16
patients with chronic schizophrenia and more severe negative symptoms. Prospective metaanalysis studies, such as those conducted by the Enhancing NeuroImaging Genetics through Meta-Analysis (ENIGMA) Consortium [34] have the benefit of standardizing the analyses across sites and thus promoting consistency and robustness of the results, rather than the ad hoc aggregation of statistical results. The recent study from the ENIGMA-Schizophrenia Working Group [35] gathered 2,028 patients and 2,540 controls. They reported large deficits in the volume of the hipocampus, amygadala, thalamus and accumbens of patients. Significant positive associations were also reported between increase of the volume of the putamen and pallidum volume in schizophrenia patients and duration of illness and age. A potential confounding factor in most schizophrenia studies is the impact of antipsychotic medications on the brain. Indeed, the impact of antipsychotic treatments on the brain anatomy have been previously reported in the literature [36, 37]. Increased volume in the basal ganglia, and specifically in the caudate nucleus, have been consistently associated to the use of antipsychotic medication [38, 39]. Therefore, it is arduous to assess whether progressive brain volume changes are a result of antipsychotic medication.
1.4.2
MRI findings in early stages of schizophrenia
In order to control the confounding effect of anti-psychotic medication on the brain and shed light on the nature and extent of pathophysiological processes underlying schizophrenia, it is of great interest to study subjects at the early stages of the disorder. First Episode Psychosis The study of first episode pyschosis (FEP) is very relevant since it allows the detection of brain abnormalities at the time of onset. Thus, it is a useful tool to evaluate hypotheses about progressive brain changes in the longitudinal course of schizophrenia. Structural abnormalities found in populations of patients that are in the early stages of the disorder, such as First episode Psychosis, are very similar to those described above in chronic schizophrenia patients. Specifically, MRI-based studies [29, 40, 41] reported diminution in total brain volume, GM volume reductions in temporal and prefrontal areas such as the anterior cingulate gyrus and the thalamus, volumetric deficits in the hippocampus and an enlargement of the lateral ventricles in FEP patients compared controls. However, such anatomical abnormalities are less severe in FEP patients compared to the patients with chronic schizophrenia. Therefore, the fact that more extended brain alterations are observed in chronic schizophrenia than in FEP patients suggests that an active neurodegeneration process might be ongoing from the disease onset. Indeed, it is thought that progressive loss of grey matter in specific regions of the brain, is not limited to the early stage of the disease, but instead progresses through the course of the disorder. Longitudinal studies of schizophrenia have demonstrated progressive lateral ventricle increases, progressive whole-brain volume loss [42] and brain tissue volume decreases,
Chapter 1 Background: Brain Imaging
17
especially in frontal and temporal GM volume [43] in chronic patients with schizophrenia compared to healthy individuals. The observation of progressive brain changes along the course of the disorder is of fundamental importance to decipher whether schizophrenia is a neurodevelopmental or neurodegenerative disorder. Indeed, the ongoing brain alterations that take place over the course of the disorder suggests that a certain pathophysiological process occurs. Identifying this pathophysiological process would be highly relevant in a clinical perspective. This could lead toward therapeutic strategies to reverse or slow down the degenerative process. For this purpose, longitudinal studies of both schizophrenia patients and healthy controls are crucial to distinguish pathological from normal brain changes over time. At-Risk Subjects The study of anti-psychotic naive subjects at imminent risk of developing the disorder either due to sub-threshold clinical symptoms (clinical HR paradigms) and/or increased genetic liability (genetic HR) is also very relevant. Indeed, the identification of neuroanatomical abnormalities already present in At risk subjects allow the assessment of a vulnerability to psychosis, possibly reflecting a neurodevelopmental origin. Studies focusing on At risk subjects using a VBM methodology have reported structural abnormalities in frontal, lateral temporal, medial temporal and limbic regions already present in HR subjects compared to healthy individuals [44, 45].
1.5
Conclusion
Over the years, MRI has been increasingly used to gain insight into the neurobiological correlates of schizophrenia. Brain abnormalities have been observed in patients at different stages of the disorder, with more severe deficits reported in chronic schizophrenia patients. Active neurobiological alterations occur before and after the onset of schizophrenia. Identifying a brain signature of schizophrenia is highly relevant in a clinical perspective. Assisting clinicians in the process of diagnosis might have obvious benefits to improve the efficiency of treatment and the clinical outcome. However, the identification of a neuroanatomical signature of schizophrenia requires a certain degree of consensus in MRI findings. Yet, as presented above, results are highly heterogeneous across studies due to cohort variability or methodological issues. Unfortunately, group analyses do not offer the possibility to uncover individual subject deviation from normality: There is a wide overlap between brain-imaging measurements in schizophrenia patients and the normal range. Mass-univariate methods are thus, limited to making inferences at the group level. They cannot be used to assist in the diagnosis process. Moreover, in univariate analysis, each feature is treated independently from each other: they can hardly detect subtle and diffuse networks of neuroanatomical deficits across the brain.
Chapter 1 Background: Brain Imaging
18
To address those limitations, the neuroimaging community has turned to machine learning approaches with the objective to uncover the MRI correlates of schizophrenia. ML methods are particularly appealing in a clinical perspective since they can explore voxels jointly to spot patterns and can make inferences at a single-subject level. Recent progress in machine learning together with the availability of large datasets now pave the way for automatic detection of schizophrenia specific features, solely based on MRI data. We will review in the next chapter the main machine learning algorithms and how they can cope with the specificities of neuroimaging datasets.
Chapter 2
Background: Machine Learning 2.1
Overview
Machine learning (ML) is a term that encompasses a series of methods to uncover patterns in data. Specifically, supervised ML approaches aim to performing trustworthy future predictions at the individual level (Figure 2.1).
Figure 2.1: Machine learning: Prediction at individual level
20
Chapter 2 Background: Machine Learning
2.1.1
21
Supervised Algorithms
In supervised machine learning algorithms, the objective is to predict a target variable (a given phenotype for instance) from several predictor variables (the features). Those predictors can be neuroimaging measurements (i.e. voxels or mesh vertices) plus some additional co-variables (i.e. age or sex). In the rest of this thesis we will note x1 , x2 ,...,xp , the p predictor variables gathered in the matrix X ∈ Rn×p , where n is the number of samples and y ∈ {0, 1}n the target variable to explain. The goal is to find the optimal β to minimize a loss function: L(β) measuring the data-fidelity. Popular choices of loss function include: 1 T 2 2 (Xi β − yi ) , n T 1 X log(1 + exp(−yi Xi β)), L(β) = (1 − yi X T β)+ , n i=1 i ...
for Ordinary Least-squares regression for Logistic regression, for Hinge loss (used in SVMs)
One weight is attributed per input feature. Therefore, the matrix of coefficients β has the same dimensionality of the input data and can be plotted as an image. This is usually called the predictive pattern, or predictive function. β provides potential insights into brain function or structure that drives the prediction
Two distinct classes of multivariate predictive models can be distinguished: Linear regression for continuous output regression problems and classifiers for binary output problems.
2.1.1.1
Linear Regression
Linear regression models are used when the target to predict is a quantitative score. For example, when we intend to investigate the relationship between a set of variables X (ex: the volume of several brain regions) and a cognitive score y. Linear regression intends to model the output or target variable y as a linear combination of the p dimensional input X. The linear model will predict the y given X using the parameter vector, or weight vector β according to:
y = Xβ + �
(2.1)
where � are the residuals, or the errors of prediction. The β is found by minimizing the loss function L(β), i.e. the error measured on the data. This error is the sum of squared errors (SSE) loss. Minimizing the SSE is the Ordinary
Chapter 2 Background: Machine Learning
22
Least Square OLS regression as objective function. We are searching the optimal vector of coefficients β of size n × 1 that minimises the quadratic error between y and its estimate Xβ. Thus, the loss L to minimize is:
n
L(β) = min ky − Xβk22 = − β
1X {yi − xTi β}2 n
(2.2)
i=1
When the problem is well-posed: when X is full rank and thus X 0 X is invertible, the solution is easily obtained by computing the unbiased Ordinary Least Squares (OLS) estimate: βˆOLS = (X 0 X)−1 X 0 y
2.1.1.2
(2.3)
Linear Classification
When the target to predict is a qualitative variable, we use classification models. For example, when we intend to investigate the relationship between brain features and a subject’s clinical status (healthy control or schizophrenia patient). A wide variety of classifiers with different loss functions exist. We will review the well known Support Vector Machine classifier [46] that minimizes the hinge loss and the logistic regression classifiers that minimizes the logistic loss. Linear Support Vector Machine SVM tries to find the widest possible separating margin between points closest to the classification boundary. SVM’ loss function L to be minimized is the Hinge loss: L(β) = max(0, 1 − yi β T xi )
(2.4)
Logistic Regression Logistic regression is a linear model with a link function that maps the output of the linear multiple regression to the posterior probability of each class using the logistic sigmoid function. In the context of binary classification problem, the conditional probability of yi given the data xi is defined through a non-linear function of the unknown predictors coefficients β ∈ Rp by pi ≡ p(yi = 1|xi ) =
1 and p(yi = 0|xi ) = 1 − pi . 1 + exp(−xTi β)
(2.5)
Chapter 2 Background: Machine Learning
23
Therefore, the loss function L to be minimized is the negative log-likelihood: L(β) = −
n � � 1 X� T yi xi β − log 1 + exp(xTi β) . n
(2.6)
i=1
2.1.2
Regularization strategy
2.1.2.1
Overfitting
However, the estimation of β is very sensitive to the conditioning of X, and sometimes produces dangerous situation of overfitting. In statistics and machine learning, overfitting occurs when a statistical model describes random errors or noise instead of the underlying relationships. In such situations, the model performs perfectly on the training data, but will lead to poor performances of independent subjects. Such issue of replicability of a model’s performance on unseen data is extremely undesirable. The overfitting phenomenon has three main explanations: excessively complex models, multicollinearity and high dimensionality. The risk of overfitting is specifically high in the context of neuroimaging data, where the number of features (e.g. number of voxels/vertices) for a subject is much larger than the total number of subjects, resulting in high-dimensional data. This unbalance situation between the number of parameters to estimate (thousands) and the number of samples to learn from (usually a few hundred) is problematic. It sometimes results in extremely complex models with low generalization capabilities. Moreover, neuroimaging measurements are frequently correlated. In this situation the coefficient estimation in the multiple regression may fluctuate erratically in response to small changes in the model or the data. Multicollinearity does not reduce the predictive power or reliability of the model as a whole, at least not within the sample data set; it only affects computations regarding individual predictors. That is, a multiple regression model with correlated predictors can indicate how well the entire bundle of predictors predicts the outcome variable, but it may not give valid results about any individual predictor, or about which predictors are redundant with respect to others. Moreover, in case of perfect multicollinearity, the predictor matrix is singular and therefore cannot be inverted. Under these circumstances, the ordinary least square solution does not exist.
2.1.2.2
Penalties
A common solution to address this overfitting issue is penalized (or regularized) regression [47], in which the magnitude of the model coefficients are penalized to stabilize them. This is accomplished by adding a penalty term on the coefficient vector β. The penalty term can favor some specific configurations of the weight map according to certain criteria. Those criteria can be interpreted as a prior, reflecting information one may already have or deem plausible.
Chapter 2 Background: Machine Learning
24
The objective function f (β) to minimize with respect to β is composed of the loss function L(β) for goodness-of-fit and a penalty term Ω(β) (for regularization to avoid overfitting). This is a trade off where the respective contribution of the loss and the penalty terms is controlled by the regularization parameter λ.
f (β) = L(β) + λΩ(β),
(2.7)
Indeed, by adding some constraints on the estimation of β, we introduce some bias in the estimation of β but reduce its variance, leading to a better estimation. A well known regularization strategy is to leverage weight decays such as the `1 and `2 norms of the coefficients, to penalize models with high weights. Indeed, we know that extreme weights in a learning model is usually the result of overfitting, where the model is trying to learn all the regularities of the training data. Therefore, the idea is to enforce the coefficients to stay in low-range values, so that the learning model is less dependent of the training data, and thus yields an increased capacity to generalize on unseen data. Three typical regularization terms are widely used in regression settings: Ridge penalty: The Ridge penalty imposes an `2 penalty on the regression coefficients. This approach penalizes the objective function by the Euclidian norm of the coefficients such that solutions with large coefficients become unattractive. [48]. Thus, the criterion to optimize becomes:
min L(β) + λ2 kβk22 β
with λ2 ≥ 0 and kβk2 =
qP p
i=1 βi
(2.8)
2
The benefit of this constraint is to reduce the coefficients variability occurring in case of high dimensionality and multicollinearity of the predictors. Indeed, increasing λ will enforce similar coefficients on the related predictors and at the same time shrink the β coefficients toward zero. However, the Ridge penalty does not assign exactly zero coefficients to predictors. Yet, with high dimensional features, such as with neuroimaging datasets, many variables are expected to be irrelevant for the prediction task. They should be removed from the model. One solution to conduct such variable selection is the use of Lasso penalty. Lasso penalty The lasso (Least Absolute Shrinkage and Selection Operator) constraint [49] is based on a penalty on the `1 -norm of the coefficients vector. It is used to enforce only few coefficients to have non-zeros weights. The criterion to optimize becomes:
Chapter 2 Background: Machine Learning
min L(β) + λ1 kβk1 β
with λ1 ≥ 0 and kβk1 =
25
(2.9)
Pp
i=1 |βi |
In contrast to the ridge regression, the lasso regression has the ability to perform variable selection. Indeed, it yields sparse solution β by selecting at most n non-null coefficients for n � p. This sparse configuration of the solution is desirable for interpretability of prediction. However, in a set of correlated predictors, the lasso regression tends to select only one variable on the set. Such selection might be unstable and thus interpretability is still limited The Lasso regression problem lacks an analytic solution. It is convex but not differential anymore due to the addition of the `1 penalty. It requires specific optimization algorithms such as FISTA: the fast iterative shrinkage-thresholding algorithm described in [50]. ElasticNet penalty: The ElasticNet model combines both `1 and `2 penalties [51]:
min L(β) + λ1 kβk1 + λ2 kβk22 β
(2.10)
ElasticNet associates the advantages of both Ridge and Lasso penalties by favoring sparse and stable configurations in case of correlated predictors. Elastic net encourages a grouping effect, where strongly correlated predictors tend to be in or out of the model together. Similarly to Lasso regression, ElasticNet can be solved with FISTA algorithm.
2.2
Review of Machine Learning studies
In the past few years, an increasing number of studies have utilized machine learning tools to investigate the neuroanatomical correlates of schizophrenia.
2.2.1
Diagnostic Studies of Schizophrenia
These studies can be separated into two types: studies focusing on the diagnostic power of machine learning in distinguishing between healthy controls and schizophrenia patients and studies assessing the potential of machine learning to provide an early diagnosis of schizophrenia using First Episode pyschosis patients or at-risk subjects (with either clinical or familial criteria).
Chapter 2 Background: Machine Learning
26
Chronic schizophrenia: The first study to perform sMRI-based classification [52], used a SVM to classify 69 schizophrenia patients and 79 matched healthy controls. They obtained a prediction accuracy of 81% via leave-one-out cross-validation. Another study by the same group [53] reached 91.8%. Leveraging an adaptive regional feature extraction method, that automatically grouped morphological traits of similar classification power, together with a SVM-Recursive Feature Elimination method to select the most discriminating features, they obtained, what still remains, one of the best diagnostic performance reported in chronic schizophrenia diagnostic studies published so far. However, such result was obtained using a group of features that might be highly specific to this sample group. The result may lack reproductibility and thus, not generalize well to independent samples. A summary of studies that used machine learning classifiers based on sMRI to distinguish patients from controls is presented in Table 2.1. Table 2.1: Studies using machine learning classifiers based on structural MRI to distinguish patients with schizophrenia from healthy controls. Abbreviations: DA, discriminant analysis; HC, healthy controls; LDA, linear discriminant analysis; MLDA, Maximum-uncertainty linear discrimination analysis; MLM, multivariate linear model; PCA, principal components analysis; RF, random forests; SCZ, schizophrenia patients; SMLR, sparse multinomial logistic regression; SVM, Support Vector Machine; SVM-RFE, Support Vector Machine with Recursive Feature Elimination
Authors
Samples
Methods
Accuracy
Davatzikos et al, 2005
HC =79, SCZ = 69
SVM
0.81
Fan et al, 2007
HC = 41, SCZ = 46
SVM-RFE
0.91
DA and MLM
0.80
Kawasaki et al, 2007
Training set: HC = 30, SCZ = 30 Testing set HC = 16, SCZ = 16
Yoone et al, 2007
HC = 52, SCZ = 53
SVM
0.90
Sun et al, 2009
HC = 36, SCZ = 36
SMLR
0.86
Karageorgiou et al, 2011
HC = 47, SCZ = 28
PCA-LDA
0.92
Kasparek et al, 2011
HC = 39, SCZ = 39
MLDA
0.72
Greenstein et al, 2012
HC = 99, SCZ = 98
RF
0.74
SVM
0.71
SVM
0.76
SVM
0.72
Nieuwenhuis et al, 2012 Schnack et al, 2014
Training set: HC = 128, SCZ = 111 Testing set: HC = 122, SCZ = 155 Training set: HC = 66, SCZ = 66 Testing set: HC = 43, SCZ = 46
Rozycki et al, 2017
HC = 396, SCZ = 440
Early stages of schizophrenia: ARMS and FEP subjects are relatively difficult to recruit, and there are still only a limited number of specialized clinics that are able to recruit these individuals. Therefore, the size of the cohorts are relatively small.
Chapter 2 Background: Machine Learning
27
A summary of studies that used machine learning classifiers based on sMRI to distinguish early-staged patients from controls is presented in Table 2.2. Koutsouleris et al [54], were the first team to leverage machine learning algorithms to assess individual vulnerability to psychosis and predict disease onset. In this study, a SVM classifier was built upon structural MRI data of individuals in early (ARMS-E, n = 20) and late at-risk mental state of psychosis (ARMS-L, n = 25) and a group of matched healthy controls (HC1, n = 25). The performance of the classifier was evaluated by distinguishing sMRI data derived from baseline scans of individuals with subsequent transition to schizophrenia (ARMS-T, n=15), those who did not make the transition (ARMS-NT, n = 18) and matched healthy controls (HC2, n = 17). Three pairwise classifiers were constructed, all achieving classification performance above 80%. The most clinically relevant classifier is the ARMS-T vs ARMS-NT pairwise classifier, that achieved an accuracy of 82%, suggesting the potential of a MRI-based approach to predict transition to schizophrenia. In a follow-up study, Koutsouleris and colleagues [55] highlighted the predictive potential of SVMs in classifying an independent cohort of 22 HC, 16 ARMS-T and 21 ARMS-NT subjects. They used a robust classification pipeline, based on SVM ensemble classifiers that performed feature selection, model learning and predictive ensemble learning wrapped in a nested cross-validation framework. The cruciall ARMS-T vs ARMS-NT pairwise classifier showed slightly improved classification results compared to their previous work [54], whereas diagnostic performance was lower in the pairwise HC vs ARMS-NT classifier (66.9% accuracy as opposed to 86% in [54]), possibly due to greater heterogeneity in the control sample. In an effort to identify neuroanatomical markers of transition to psychosis across clinically defined high-risk populations, Koutsouleris et al, [56] extended their previous single-site investigations [54, 55] by pooling two independent cohorts of subjects with ARMS recruited at two different early recognition centres. In this study, the authors constructed an ensemble SVM classifier by using baseline structural MRI data from a pooled data set of 33 ARMS-T and 33 ARMS-NT subjects while an independent group of 7 ARMS-NT subjects was used to further validate the classification. The classifiers performance was evaluated by cross-validation and classification of the independent test set and achieved a balanced accuracy of 80% in the pooled data set (sensitivity=75.8%, specificity=84.8%) and 80.4% (sensitivity=75.8%, specificity=85%) in the entire dataset (N=73), suggesting the existence of a neuroanatomical signature across recruitment sites.
Chapter 2 Background: Machine Learning
28
Table 2.2: Studies using machine learning classifiers based on structural MRI to distinguish early stages patients from healthy controls. Abbreviations: ARMS-T, at-risk mental state with transition to schizophrenia; ARMSNT, at-risk mental state without transition to schizophrenia; HC, healthy controls; SCZ, schizophrenia patients; FEP, Firs Episode Psychosis; SVM, Support Vector Machine; MLDA, Maximum-uncertainty linear discrimination analysis;
Authors Koutsouleris et al, 2009 Kasparek et al, 2011 Borgwardt et al, 2012
Koutsouleris et al, 2012 Zanetti et al, 2013
Samples HC = 17, ARMS-T = 15, ARMS-NT = 18 HC = 39, FEP = 39 HC = 22, FEP = 23, ARMS-T = 16 HC = 22, ARMS-T = 16, ARMS-NT = 21 HC = 62, FEP = 62
Methods
HC vs ARMS-T: 94 PCA-SVM
ARMS-NT =33 Testing set: ARMS-NT=7
HC vs ARMS-NT: 86 ARMS-T vs ARMS-NT: 82
MLDA
HC vs FEP: 72 HC vs FE: 86.7
Ensemble SVM
HC vs ARMS-T: 80.7 FE vs ARMS-T: 80 HC vs ARMS-T: 92.3
Ensemble SVM
HC vs ARMS-NT: 66.9 ARMS-T vs ARMS-NT: 84.2
SVM
HC vs FEP: 73.4 ARMS-T vs ARMS-NT:
Training set: ARMS-T=33 Koutsouleris et al, 2015
Accuracy
Ensemble SVM
Cross validation: 80 Independent test set Spe: 85 Overall BAC: 80
Despite the fact that these studies have yielded promising results in the context of prediction of disease transition, it should be noticed that the at-risk mental state sample included in those studies involved help-seeking, symptomatic subjects. It is therefore unclear if such predictive models could generalize to asymptomatic, high-risk individuals as well.
2.2.2
Limitations
Machine learning predictions in neuroimaging have yielded promising results (see Tables 2.1 and 2.2). There are however, important limitations yet to be fully considered and overcome, before translation into routine clinical practice.
2.2.2.1
Independent validation datasets
Schizophrenia is a complex and very heterogeneous disorder. Small size cohorts, typically composed of highly-selected patients, suffer from a bias in the recruitment. They do not represent the full and broad cross-sectional spectrum of the disorder phenotype. Given this variability, a significant heterogeneity can be found in the effect-sizes and patterns of brain
Chapter 2 Background: Machine Learning
29
differences found across studies. To date, most studies recruited subjects scanned at a single acquisition site (i.e., the subjects were scanned at the same site, using similar scanner hardware and MRI protocols). Such results are difficult to generalize to large-scale clinical settings, with patients scanned at widely different locations [32]. Validation on independent datasets is a more realistic approach to quantify generalization accuracy. Consequently, multi-site populations are instrumental to achieve consistency and reproducibility in the results. To our knowledge, only few studies have relied on a completely independent validation cohort to estimate prediction performances of a classifier [15, 57–59]. All these studies obtained much lower intersite diagnostic accuracies (See table 2.1), (from 71% to 80%) which is lower, but a much more realistic performance, since it takes into account the site-variability.
2.2.2.2
Sample size
Sample size is an important factor to take into consideration in neuroimaging-based studies since it might alter prediction performance. Despite being counterintuitive, the classifiers that use small size samples tend to yield higher diagnostic performance [53, 57] while in studies with larger populations, the classification accuracy yielded is usually lower [58, 59]. Such finding can be possibly explained by the fact that larger studies have collected patients with a wider range of phenotypic manifestations. However, it is still extremely important to collect large datasets in order to have enough statistical power to learn robust and reliable models. Furthermore, to be relevant in a clinical setting, the predictive models have to encompass a wide range of clinical profiles of schizophrenia.
2.2.2.3
Medication effects
Additionally, the frequent use of anti-psychotic drug treatment is also a confounding effect since medication have been shown to have impacts on the brain structure [36, 37]. This raises questions concerning the validity of the classifiers. The concern is that patients and controls might be classified with regard to their medication status rather than their diagnosis. A possible way to control for the confounding effect of anti-psychotic medication is to remove from the features, the brain regions that are known to be affected by anti-psychotic medication, as seen in the study conducted by Nieuwenhuis et al. 2012 [58], where the authors masked out the striatum and tested the diagnostic accuracy of the classifier by excluding this area. However, the localization of the impacts of medications on brain structure is inconsistent across studies. Thus, it is challenging to determine which brain regions should be left out from the predictive model.
Chapter 2 Background: Machine Learning 2.2.2.4
30
Interpretability
In the context of predictive signature discovery, it is crucial to understand the brains structural patterns that underpin a prediction. Unfortunately, in most cases, despite accurate prediction performance, classifiers still behave as black box models, not providing objective neuroanatomical markers, and by that ruling out the prospect of clinical applications. Most of the times (for example, with the SVM classifier), the predictive signature is dense and hard to interpret. Some studies thresholded the predictive weight map or used the patterns of abnormalities yielded with mass univariate statistics as a signature of schizophrenia. [59]. However, it would be highly relevant to obtain an interpretable predictive signature per se.
2.3
Conclusion
Over the past years, there has been a growing interest for using machine learning techniques in clinical neurosciences, and specifically for disentangling schizophrenia patients from healthy controls with structural MRI (sMRI) markers. However, despite initial promising results, this progress has not yet been converted into new clinical applications and significant challenges still need to be tackled for translational implementation of such findings in psychiatry to become a reality.
Chapter 3
Supervised Machine Learning with Structured Sparsity 3.1
Interpretable Machine Learning
3.1.1
The need for interpretability
So far, due to the growing amount of data, the availability of computation power, machine learning algorithms have been widely used in neuroimaging. Machine learning approaches are convenient tools to identify predictive markers of a brain disease. In the case of linear models, the estimated model parameters form a spatial map in the image domain: the predictive pattern. However, minimizing a prediction error gives little control on the fine details of the corresponding maps. Unfortunately, in most cases, despite accurate prediction performance achieved, classifiers still behave as a black box model. Indeed, most of the state-of-the art classifiers, such as the SVM, produce dense patterns of predictors that are difficult to interpret. Although some methods exist to define thresholds to uncover brain regions than significantly contribute to the classification process [60, 61], they do no produce interpretable weight maps per se. They do not provide objective neuroanatomical markers on which the decision is built. However, it is essential that the method provides meaningful predictive patterns in order to reveal the neuroimaging markers of the pathology. In the context of predictive signature discovery, it is crucial to understand the brain structural patterns that underpin the prediction. This absence of interpretability of the decision is ruling out the prospect of clinical application. We therefore seek for a complementary approach able to select a reduced number of predictive regions. We will therefore focus on the interpretability of such predictive patterns on this present chapter. 32
Chapter 3 Supervised Machine Learning with Structured Sparsity
3.1.2
33
Sparse penalties limitations
When using a classifier with an `2 penalty (a SVM for instance) with neuroimaging data, the weight maps are dense and potentially irregular (i.e. with abrupt, high-frequency changes). With the `1 penalty, they are scattered and sparse with only a few non-zero voxels. In both cases, the weight maps are hard to interpret in terms of neuroanatomy. The combination of both penalties in Elastic Net, promotes sparse models while still maintaining the regularization properties of the `2 penalty. However, a major limitation of the Elastic Net penalty is that it does not take into account the spatial structure of brain images, which leads to scattered patterns.
3.2
Spatial Regularization
We have seen in Chapter 2 that one solution to improve the interpretability of the predictive model is to add constraints in the minimization problem to favorize some specific configurations of the predictive weight map. The objective is to relate the prediction to neuroanatomical structures.
3.2.1
GraphNet penalty
One solution to obtain more interpretable models is to take benefit of the known structure of brain MRI images, in order to force the solution to adhere to biological priors, thereby producing more plausible and interpretable solutions. Indeed, MRI data is naturally encoded on a 3-dimensional grid where some voxels are neighbors, and others are not. Structured sparsity can be obtained with several differents penalties. One of them is the Graph-constrained Elastic-Net, GraphNet (GN ) penalty, described in [62]. GraphNet closely resembles the Elastic-Net, but with a modification of the `2 -norm penalty term:
min L(β) + λ1 kβk1 + λG k∇βk22 β
(3.1)
∇ denotes a finite differences spatial gradient operator acting upon an image. For a 3D grid of size p = px py pz , ravelled into a long vector, we have ∇ ∈ R3p . It promotes local smoothness of the weight map by forcing adjacent voxels/vertices to have similar weights, and it does this by imposing a squared `2 penalty on the gradient of the weight map. The GN penalty induces smoothness by penalizing the size of the pairwise differences between coefficients that are adjacent in the graph. However, GN methods allow for smooth rather than piecewise constant structure in the non-sparse parts of the weight map. This is of interest in cases where we might expect the magnitudes of nonzero coefficients to be different
Chapter 3 Supervised Machine Learning with Structured Sparsity
34
within a volume of interest. Due to the smoothness of the graph penalty GraphNet methods are also easier from an optimization perspective. However, in some situations, obtaining a piecewise smoothness is a required prior. For example, in clinical status prediction based on structural MRI, we intend to uncover a disease predictive signature, composed of clearly defined regions. We hypothesized that GN would provide smooth solutions rather than clearly identified regions. On the basis of this hypothesis, we propose to use an alternative to the GN penalty, the TV-Enet penalty.
3.2.2
TV-Enet penalty
The Total Variation (T V ) penalty is widely used as a tool in image denoising and restoration. It accounts for the spatial structure of images by encoding piecewise smoothness and enabling the recovery of homogeneous regions separated by sharp boundaries. We propose to add TV to the Elastic Net penalty to improve the interpretability and the accuracy of regression. The Enet-TV penalty [63] combines `1 , `2 and the total variation (T V ) penalties. This combination of penalties enforces spatial smoothness of the solution while simultaneously segmenting predictive regions from background. We hypothesize that the predictive information is most likely organized in regions rather than scattered across the brain. The `1 and `2 penalties served the purpose of addressing overfitting induced from the MRI data’s high intrinsic dimensionality. Meanwhile, the T V penalty also regularizes the solution, but also take advantage of the spatial 3D structure. It has been demonstrated that these penalties, together, generate a coherent, parsimonious, and interpretable weight map. Moreover, these penalties provide a segmentation of the predictive weight map into spatially contiguous parcels with almost constant values, a highly desirable characteristic in the scope of predictive signature discovery.
min L(β) + λ1 kβk1 + λ2 kβk2 + λk∇βk2,1 β
(3.2)
where λ1 , λ2 and λ are hyper-parameters controlling the relative strength of each penalty.
3.3
Reformulating TV as a linear operator
Before discussing the optimization strategy, we provide details on the encoding of the spatial structure within the T V penalty. This section presents the formulation and the design of a linear operator A in the specific case of a T V penalty applied to the loading vector β measured on a 3-dimensional (3D) image or a mesh of the cortical surface.
Chapter 3 Supervised Machine Learning with Structured Sparsity
3.3.1
35
3D image
The brain mask is used to establish a mapping g(i, j, k) between the coordinates (i, j, k) in the 3D grid, and an index g ∈ [[1; P ]] in the collapsed image. We extract the spatial neighborhood of g, of size ≤ 4, corresponding to voxel g and its 3 neighboring voxels, within the mask, in the i, j and k directions. By definition, we have
T V (β) ≡
P X
�
∇ βg(i,j,k) . 2
(3.3)
g=1
The first order approximation of the spatial gradient ∇(βg(i,j,k) ) is computed by applying 0
the linear operator Ag ∈ R3×4 to the loading vector βg in the spatial neighborhood of g, i.e.
∇ βg(i,j,k)
�
βg(i,j,k)
−1 1 0 0 βg(i+1,j,k) = −1 0 1 0 β g(i,j+1,k) −1 0 0 1 | {z } βg(i,j,k+1) {z | A0 g
βg
,
(3.4)
}
where βg(i,j,k) is the loading coefficient at index g in the collapsed image corresponding to 0
voxel (i, j, k) in the 3D image. Then Ag is extended, using zeros, to a large but very sparse matrix Ag ∈ R3×P in order to be directly applied on the full vector β. If some neighbors lie outside the mask, the corresponding rows in Ag are removed. Noticing that for TV there is one group per voxel in the mask (G = [[1; P ]]), we can reformulate TV from Eq. (3.3) using a general expression:
T V (β) =
X
kAg βk2 .
(3.5)
g∈G
Finally, with a vertical concatenation of all the Ag matrices, we obtain the full linear operator A ∈ R3P ×P .
3.3.2
Mesh of cortical surface 0
The linear operator Ag used to compute a first order approximation of the spatial gradient can be obtained by examining the neighboring vertices of each vertex g. With common triangle-tessellated surfaces, the neighborhood size is ≤ 7 (including g). In this setting, we 0
have Ag ∈ R3×7 , which can be extended and concatenated to obtain the full linear operator A.
Chapter 3 Supervised Machine Learning with Structured Sparsity
3.4
36
Optimization of TV-Enet
The difficulty is that `1 and TV are convex but not smooth functions. Therefore, we cannot use classic gradient descent algorithms. In [64], the authors use a primal-dual approach for `1 and T V penalties (which can be extended to include `2 ) but their method is not applicable to logistic regression because the proximal operator of the logistic loss is not known. Another strategy for non-smooth problems is to use methods based on the proximal operator of the penalties. For the `1 penalty alone, the proximal operator is analytically known and efficient iterative algorithms such as ISTA and FISTA are available in [50]. However, the proximal operator of the TV penalty is not analytically defined. Therefore, those algorithms are not suitable in this situation. There are two general strategies to address this problem. The first one involves using an iterative algorithm to numerically approximate the proximal operator of each convex nonsmooth penalty [65]. This algorithm is then run for each iteration of ISTA or FISTA (leading to nested optimization loops). This was done for TV alone in [66] where the authors use FISTA to approximate the proximal operator of TV . The problem with such methods is that by approximating the proximal operator we may loose the sparsity induced by the `1 penalty. The second strategy is to approximate the non-smooth penalties for which the proximal operator is not known (e.g. T V ) with a smooth function (of which the gradient is known). Non-smooth penalties with a known proximal operator (e.g. `1 ) are not changed. Therefore it is possible to use an exact accelerated proximal gradient algorithm. Such a smoothing technique has been proposed by Nesterov in [67]. We choose to apply the second strategy to obtain an algorithm able to solve TV -Elastic Net penalized regression with an exact `1 penalty.
non−smooth
smooth }| { z }| { z X 2 min L(β) + λ2 kβk2 + λ1 kβk1 +λ kAg βk2 β
(3.6)
g∈G
|
{z
l(β)
}
| {z } h(β)
|
{z
s(β)
}
where l(β) is the penalized smooth (i.e. differentiable) loss, h(β) is a sparsity-inducing penalty whose proximal operator is known and s(β) is a complex penalty on the structure of the input variables with an unknown proximal operator.
3.4.1
Nesterov’s smoothing of the structured penalty
We consider the convex non-smooth minimization of Eq. (3.6) with respect to β. This problem includes a general structured penalty, s, that covers the specific case of TV. The
Chapter 3 Supervised Machine Learning with Structured Sparsity
37
accelerated proximal gradient algorithm (FISTA) [68] can be used to solve the problem when applying only e.g. the `1 penalty. A widely used approach when dealing with non-smooth problems is to use methods based on the proximal operator of the penalties. For the `1 penalty alone, the proximal operator is analytically known and being solved with ISTA [69] or FISTA [68]. However, since the proximal operator of TV, together with the `1 penalty, has no closed-form expression, standard implementations of those algorithms are not suitable. In order to overcome this barrier we used Nesterov’s smoothing technique [70], which consists of approximating the non-smooth penalty for which the proximal operator is unknown (e.g., TV) with a smooth function (for which the gradient is known). Non-smooth penalties with known proximal operators (e.g., `1 ) are not affected by this smoothing. Hence, as described in [71], this allowed us to use an exact accelerated proximal gradient algorithm. Using the dual norm of the `2 -norm (i.e. the `2 -norm), Eq. (3.5) can be reformulated as TV(β)=
X
=
X
kAφ(i,j,k) βk2
i,j,k
i,j,k
max
kαφ(i,j,k) k2 ≤1
α> φ(i,j,k) Aφ(i,j,k) β,
(3.7)
where αφ(i,j,k) ∈ Kφ(i,j,k) = {αφ(i,j,k) ∈ R3 : kαφ(i,j,k) k2 ≤ 1} is a vector of auxiliary variables in the `2 unit ball, associated with Aφ(i,j,k) β. As with A ∈ R3P ×P , which is the vertical concatenation of all the Aφ(i,j,k) , we concatenate all the αφ(i,j,k) to form α ∈ K = {[αT1 , . . . , αTP ]T : αl ∈ Kl , ∀ l = φ(i, j, k) ∈ {1, . . . , P }} ∈ R3P . The set K is the Cartesian product of closed 3D unit balls in Euclidean space and, therefore, a compact convex set. Eq. (3.7) can now further be written as T V (β)= max αT Aβ = s(β), α∈K
(3.8)
and with this formulation of s, we can apply Nesterov’s smoothing technique. For a given smoothing parameter, µ > 0, the function s is approximated by the smooth function n o µ T 2 sµ (β) = max α Aβ − kαk2 , α∈K 2
(3.9)
for which limµ→0 sµ (β) = s(β). Nesterov [70] demonstrates this convergence using the in∗T ∗T T equality in Eq. (3.13). The value of α∗µ (β) = [α∗T µ,1 , . . . , αµ,φ(i,j,k) , . . . , αµ,P ] that maximizes
Eq. (3.9) is the concatenation of projections of the vectors Aφ(i,j,k) β ∈ R3 onto the `2 ball � � Aφ(i,j,k) β Kφ(i,j,k) , i.e. α∗µ,φ(i,j,k) (β) = projKφ(i,j,k) , where µ x projKφ(i,j,k) (x) = x
kxk2
if kxk2 ≤ 1 otherwise.
(3.10)
Chapter 3 Supervised Machine Learning with Structured Sparsity
38
The function sµ , i.e. Nesterov’s smooth transform of s, is convex and differentiable. Its gradient is given by Nesterov [70] as ∇sµ (β) = AT α∗µ (β).
(3.11)
The gradient is Lipschitz-continuous, with constant � kAk22 L ∇(sµ ) = , µ
(3.12)
in which kAk2 is the matrix spectral norm of A. Moreover, Nesterov [70] provides the following inequality, relating sµ and s ∀β ∈ RP ,
sµ (β) ≤ s(β) ≤ sµ (β) + µM, where M = maxα∈K 12 kαk22 =
(3.13)
P 2.
Thus, a new (smoothed) function, closely related to Eq. (3.6), arises as non-smooth
smooth
{ z }| { z n }| µ ∗ 2o T 2 ∗ fµ (β) = L(β)+ λ2 kβk2 +λ αµ (β) Aβ − kα k2 +λ1 kβk1 . | {z } | {z } {z 2 } | g(β)
sµ (β)
(3.14)
h(β)
Hence, we can explicitly compute the gradient of the smooth part, ∇(g+λsµ ) using Eq. (3.11), its Lipschitz constant (using Eq. (3.12)) and also the proximal operator of the non-smooth part. For a linear regression loss: ∇ (g + λsµ ) = ∇(g) + λ∇(sµ ) = XT (Xβ k − y) + λA> α∗µ (β k ),
L (∇ (g + λsµ )) = 2 + λ
kAk22 . µ
(3.15)
(3.16)
For a logistic regression loss: ∇ (g + λsµ ) = ∇(g) + λ∇(sµ ) 1 = XT (y − ) + λA> α∗µ (β k ), 1 + e−Xβ k
(3.17)
Chapter 3 Supervised Machine Learning with Structured Sparsity
L (∇ (g + λsµ )) = 1/2kXk22 + λ
kAk22 . µ
39
(3.18)
We thus have all the necessary ingredients to minimize the function using e.g. an accelerated proximal gradient method [68]. Given a starting point, β 0 , and a smoothing parameter, µ, FISTA (Algorithm 1) minimizes the smoothed function and reaches a given precision, εµ .
Algorithm 1 FISTA β 0 , εµ , µ, A, g, sµ , h, λ, λ1 1: 2: 3: 4: 5: 6: 7:
�
β1 = β0; k = 2 � � kAk2 −1 Step size tµ = L(∇(g)) + λ µ 2 repeat � k−1 − β k−2 z = β k−1 + k−2 k+1 β � β k = proxλ1 h z − tµ ∇(g + λsµ )(z) until Gapµ (β k ) ≤ εµ (see Section 3.5.1) return β k
3.5
The CONESTA algorithm
The step size, tµ , computed in Line 2 of Algorithm 1, must be smaller than or equal to the reciprocal of the Lipschitz constant of the gradient of the smooth part, i.e. of g + λsµ [68]. This relationship between tµ and µ implies a trade-off between speed and precision: A high precision (small µ and tµ ) will lead to a slow convergence. Conversely, poor precision (large µ and tµ ) will lead to rapid convergence. To optimize this trade-off, we propose a continuation approach (Algorithm 2) that decreases the smoothing parameter with respect to the distance to the minimum. On the one hand, when we are far from β ∗ (the minimum of Eq. (3.6)), we can use a large µ to rapidly decrease the objective function. On the other hand, when we are close to β ∗ , we need a small µ in order to obtain an accurate approximation of the original objective function. The resulting algorithm is called CONESTA (short for COntinuation with NEsterov smothing in a Shrinkage-Thresholding Algorithm). The convergence proofs of this algorithm are presented in [72]
3.5.1
Duality gap
The distance to the unknown f (β ∗ ) is estimated using a duality gap. Duality formulations are often used to control the achieved precision level when minimizing convex functions.
Chapter 3 Supervised Machine Learning with Structured Sparsity
40
The duality gap provides an upper bound of the error, f (β k ) − f (β ∗ ), for any β k , when the minimum is unknown. Moreover, it vanishes at the minimum: Gap(β k ) ≥ f (β k ) − f (β ∗ ) ≥ 0, Gap(β ∗ ) = 0.
(3.19)
The duality gap is the cornerstone of the CONESTA algorithm. Indeed, it is used three times: (i) As the stopping criterion in the inner FISTA loop (Line 6 in Algorithm 1). FISTA will stop as soon as the current precision is achieved using the current smoothing parameter, µ. This prevents unnecessary iterations toward the approximated (smoothed) objective function. (ii) In the ith CONESTA iteration, as a way to estimate the current error f (β i ) − f (β ∗ ) (Line 7 in Algorithm 2). The error is estimated using the gap of the smoothed problem, Gapµ=µi (β i+1 ), which avoids unnecessary computation since it has already been computed during the last iteration of FISTA. The inequality in Eq. (3.13) is used to obtain the distance, εi , to the original non-smoothed problem. The next desired precision, εi+1 , and the smoothing parameter, µi+1 are derived from this value. (iii) Finally, as the global stopping criterion in CONESTA (Line 10 in Algorithm 2). This guarantees that the obtained approximation of the minimum, β i , at convergence, satisfies f (β i ) − f (β ∗ ) < ε. Eq. (3.14) decomposes the smoothed objective function as a sum of a strongly convex loss, L, and the penalties. Therefore, we can equivalently express the smoothed objective function as fµ (β) = L(β) + Ωµ (β) = l(Xβ) + Ωµ (β), where Ωµ represents all penalty terms of Eq. (3.14). Our aim is to compute the duality gap to obtain an upper bound estimation of the distance to the optimum. At any step k of the algorithm, given the current primal β k and the dual σ(β k ) ≡ ∇L(Xβ k ) variables [73], we can compute the duality gap using the Fenchel duality rules [74]. This requires computing the Fenchel conjugates, l∗ and Ω∗µ , of l and Ωµ , respectively. While the expression of l∗ is straightforward, to the best of our knowledge, there is no explicit expression for Ω∗µ when using a complex penalty such as TV or group Lasso. Therefore, as an important theoretical contribution of this paper, we provide the expression for Ω∗µ in order to compute an approximation of the duality gap that maintains its properties (Eq. (3.19)).
Chapter 3 Supervised Machine Learning with Structured Sparsity
41
Theorem 3.1 (Duality gap for the smooth problem). The following estimation of the duality gap satisfies Eq. (3.19) , for any iterate β k : Gapµ (β k ) ≡ fµ (β k ) + l∗ (σ(β k )) + Ω∗µ,k (−X T σ(β k )),
(3.20)
For a linear regression: L(β) =
1 2 kXβ
− yk22 , can be re-written as a function of Xβ by l(z) ≡
1 2 kz
− yk2 , where
z = Xβ. the dual variable is : σ(β k ) ≡ ∇l(Xβ k ) = Xβ k − y,
(3.21)
and the Fenchel conjugates: 1 l∗ (z) = kzk22 + hz, yi 2 � �2 ! P � 1 X ∗ T ∗ k Ωµ,k (z) ≡ zj − λ A αµ (β ) j − λ1 2λ2 + j=1
+
λµ
α∗µ (β k ) 2 , 2 2
(3.22)
where [ · ]+ = max(0, · ). For a logistic regression: the dual variable is: σ(β k ) ≡ ∇l(Xβ k ) =
1 −y 1 + e−Xβ k
(3.23)
and the Fenchel conjugates ∗
l (z) =
P X
(zj log(zj ) + (1 − zj ) log(1 − zj ))
(3.24)
j=1
with z =
1 1+e−Xβ k
The expression in Eq. (3.20) of the duality gap of the smooth problem combined with the inequality in Eq. (3.13) provides an estimation of the distance to the minimum of the original non-smoothed problem. The sought distance is decreased geometrically by a factor τ ∈ (0, 1) at the end of each continuation, and the decreased value defines the precision that should be reached by the next iteration (Line 8 of Algorithm 2). Thus, the algorithm dynamically generates a sequence of decreasing precisions, εi . Such a scheme ensures the convergence towards a globally desired final precision, ε, which is the only parameter that the user needs to provide.
Chapter 3 Supervised Machine Learning with Structured Sparsity
3.5.2
42
Determining the optimal smoothing parameter
Given the current precision, εi , we need to compute a smoothing parameter µopt (εi ) (Line 9 in Algorithm 2) that minimizes the number of FISTA iterations required to achieve such a precision when minimizing Eq. (3.2) via Eq. (3.6) (i.e., such that f (β k ) − f (β ∗ ) < εi ). We have the following theorem giving the expression of the optimal smoothing parameter, for which a proof is provided in the supp:optimalm u. Theorem 3.2 (Optimal smoothing parameter, µ). For any given ε > 0, selecting the smoothing parameter as µopt (ε) =
−λM kAk22 +
p (λM kAk22 )2 + M L(∇(g))kAk22 ε , M L(∇(g))
(3.25)
minimizes the worst case bound on the number of iterations required to achieve the precision f (β k ) − f (β ∗ ) < ε. Note that M = P/2 (Eq. (3.13)) and the Lipschitz constant of the gradient of g as defined in Eq. (3.14) is L(∇(g)) = λmax (X T X) + λ, where λmax (X T X) is the largest eigenvalue of X T X.
3.5.3
Algorithm
The user only has to provide the globally prescribed precision ε, which will be guaranteed by the duality gap. Other parameters are related to the problem to be minimized (i.e. g, λ, s, λ1 , h) and the encoding of the data structure A. Finally, the value of τ was set to 0.5. Indeed, experiments shown in [72] have demonstrated that values of 0.5 or 0.2 led to similar and increased speeds compared to larger values, such as 0.8. Algorithm 2 CONESTA ε, A, g, s, h, λ, λ1 , τ = 0.5 1: 2: 3: 4: 5: 6: 7: 8: 9: 10: 11:
�
Initialize β 0 ∈ RP 0 ε0 = τ · Gapµ=10 −8 (β ) � µ0 = µopt ε0 repeat εiµ = εi − µi λM β i+1 = Fista(β i , εiµ , µi , A, g, sµi , h, λ, λ1 ) εi = Gapµ=µi (β i+1 ) + µi λM εi+1 = τ · εi � µi+1 = µopt εi+1 until εi ≤ ε return β i+1
CONESTA can be understood as a smooth touchdown procedure that uses the duality gap to probe the distance to the ground (global optimum) in order to dynamically adapt its
Chapter 3 Supervised Machine Learning with Structured Sparsity
43
speed (the smoothing). Indeed, each continuation step of CONESTA (Algorithm 2) probes (Line 7) an upper bound εi of the current distance to the optimum (f (β i ) − f (β ∗ )) using the duality gap. Then, Line 8 computes the next precision to be reached, εi+1 , decreasing εi by a factor τ ∈ (0, 1). Line 9 derives the optimal smoothing parameter, µi+1 , required to reach this precision as fast as possible. Finally, Line 5 transforms back the precision with respect to the original problem into a precision for the smoothed problem, εiµ , using the inequality in Eq. (3.13). Therefore, at the next iteration, FISTA (Line 6) will decrease fµi until the error reaches εiµ . Thanks to Line 5, this implies that the true error (toward the non-smoothed problem) will be smaller than εi . The resulting weight vector, β i+1 , will be the initial value for the next continuation step using updated parameters. Note that we use the duality gap for the smoothed problem, Gapµ=µi (and εiµ ), and transform it back and forth using Eq. (3.13) to obtain the duality gap for the non-smooth problem, Gap (and εi ). We do this because the gap on Line 7 has already been computed at the last iteration of the FISTA loop (Line 6), since it was used in the stopping criterion. Moreover, Gapµ converges to zero for any fixed µ unlike Gap. The initialization (Line 2) is a particular case where we use Gapµ with a negligible smoothing value of e.g. µ = 10−8 . We then derive the initial smoothing parameter on Line 3. Therefore, if we start close to the solution the algorithm will automatically pick a small smoothing parameter, which makes CONESTA an excellent candidate for warm-restart.
3.6
Conclusion
In summary, the optimization algorithm is able to minimize any combination of the `1 , `2 and T V penalties while preserving the exact `1 penalty. This algorithm uses Nesterovs technique to smooth the T V penalty such that objective function is minimized with an exact accelerated proximal gradient algorithm. The approximation of T V is controlled by a single smoothing parameter µ . This continuation algorithm uses successively smaller values of µ to reach a prescribed precision while achieving the best possible convergence rate. Overall, the use of structured sparse supervised machine learning is highly relevant in providing a major breakthrough in terms of support recovery of the predictive brain regions. We will demonstrate the performance, interpretability and versatility of TV-Enet on two datasets of schizophrenia patients containing sMRI and fMRI, respectively in Chapters 5 and 6. In addition, we will see in Chapter 4 that the existence of structured and sparse regularization terms is not limited to supervised machine learning tools. Indeed, for some specific unsupervised machine learning analysis, the use of sparse and spatial constraint is also of great interest.
Chapter 3 Supervised Machine Learning with Structured Sparsity
44
Chapter 4
Unsupervised Machine Learning with Structured Sparsity The work presented in this chapter has been published in:
Structured sparse principal components analysis with the TV-elastic net penalty. Amicie de Pierrefeu, Tommy L¨ ofstedt, Fouad Hadj-Selem, Mathieu Dubois, Renaud Jardri, Thomas Fovet, Philippe Ciuciu, Vincent Frouin, Edouard Duchesnay. IEEE Transaction in Medical Imaging, 2018
4.1
Abstract
Principal component analysis (PCA) is an exploratory tool widely used in data analysis to uncover dominant patterns of variability within a population. Despite its ability to represent a data set in a low-dimensional space, PCA’s interpretability remains limited. Indeed, the components produced by PCA are often noisy or exhibit no visually meaningful patterns. Furthermore, the fact that the components are usually non-sparse may also impede interpretation, unless arbitrary thresholding is applied. However, in neuroimaging, it is essential to uncover clinically interpretable phenotypic markers that would account for the main variability in the brain images of a population. Recently, some alternatives to the standard PCA approach, such as Sparse PCA, have been proposed, their aim being to limit the density of the components. Nonetheless, sparsity alone does not entirely solve the interpretability problem in neuroimaging, since it may yield scattered and unstable components. We hypothesized that the incorporation of prior information regarding the structure of the data may lead to improved relevance and interpretability of brain patterns. We therefore present a simple extension of the popular PCA framework that adds structured sparsity penalties on the loading vectors in order to identify the few stable regions in the brain images that capture most of the variability. Such structured sparsity can be obtained by combining e.g., 45
Chapter 4 Unsupervised Machine Learning with Structured Sparsity
46
`1 and total variation (TV) penalties, where the TV regularization encodes information on the underlying structure of the data. This paper presents the structured sparse PCA (denoted SPCA-TV) optimization framework and its resolution. We demonstrate SPCA-TV’s effectiveness and versatility on three different data sets. It can be applied to any kind of structured data, such as e.g., N -dimensional array images or meshes of cortical surfaces. The gains of SPCA-TV over unstructured approaches (such as Sparse PCA and ElasticNet PCA) or structured approach (such as GraphNet PCA) are significant, since SPCA-TV reveals the variability within a data set in the form of intelligible brain patterns that are easier to interpret and more stable across different samples.
4.2
Introduction
Principal components analysis (PCA) is an unsupervised statistical procedure whose aim is to capture dominant patterns of variability in order to provide an optimal representation of a data set in a lower-dimensional space defined by the principal components (PCs). Given a data set X ∈ RN ×P of N samples and P centered variables, PCA aims to find the most accurate rank-K approximation of the data:
2
min X − UDVT F ,
U,D,V
(4.1)
s.t. UT U = I, VT V = I, d1 ≥ · · · ≥ dK > 0 where k.kF is the Frobenius norm of a matrix, V = [v1 , · · · , vK ] ∈ RP ×K are the K loading vectors (right singular vectors) that define the new coordinate system where the original features are uncorrelated, D is the diagonal matrix of the K singular values, and U = [u1 , · · · , uK ] ∈ RN ×K are the K projections of the original samples in the new coordinate system (called principal components (PCs) or left singular vector). Using K = rank(X) components leads to the singular value decomposition (SVD). A vast majority of neuroimaging problems involve high-dimensional feature spaces (≈ 105 features i.e. voxels or mesh (nodes over the cortical surface) with a relatively limited sample size (≈ 102 participants. With such “large P , small N ” problems, the SVD formulation, based on the data matrix, is much more efficient than an eigenvalue decomposition of the large P × P covariance matrix. In a neuroimaging context, our goal is to discover the phenotypic markers accounting for the main variability in a population’s brain images. For example, when considering structural images of patients that will convert to Alzheimer disease (AD), we are interested in revealing the brain patterns of atrophy explaining the variability in this population. This provides indications of possible stratification of the cohort into homogeneous sub-groups that may be clinically similar but with a different pattern of atrophy. This could suggest different sub-types of patients with AD or some other etiologies such as dementia with Lewy bodies. Clustering methods might be natural approaches to address such situations, however, they can not reveal subtle differences that go beyond a global and trivial pattern of atrophy. Such
Chapter 4 Unsupervised Machine Learning with Structured Sparsity
47
patterns are usually captured by the first component of PCA which, after being removed, offers the possibility to identify spatial patterns on the subsequent components. However, PCA provides dense loading vectors (patterns), that cannot be used to identify brain markers without arbitrary thresholding. Recently, some alternatives propose to add sparsity in this matrix factorization problem ([75], [76], [77]). The sparse dictionary learning framework proposed by [76] provides a sparse coding (rows of U) of samples through a sparse linear combination of dense basis elements (columns of V). However, the identification of biomarkers requires a sparse dictionary (columns of V). This is precisely the objective of Sparse PCA (SPCA) proposed in [78–82] which adds a sparsity-inducing penalty on the columns of V. Imposing such sparsity constraints on the loading coefficients is a procedure that has been used in fMRI to produce sparse representation of brain functional networks [83],[84]. However, sparse PCA is limited by the fact that it ignores the inherent spatial correlation in the data. It leads to scattered patterns that are difficult to interpret. Furthermore, constraining only the number of features included in the PCs might not always be fully relevant since most data sets are expected to have a spatial structure. For instance, MRI data is naturally encoded on a grid; some voxels are neighbors, while others are not. We hypothesize that brain patterns are organized into distributed regions across the brain([85– 87]). Recent studies tried to overcome this limitation by encoding prior information concerning the spatial structure of the data (see [88–90]). However, they used methods that are difficult to plug into the optimization scheme (e.g., spline smoothing, wavelet smoothing) and incorporated prior information that sometimes may be difficult to define. One simple solution is the use of a GraphNet penalty ([91–95]). It promotes local smoothness of the weight map by simply forcing adjacent voxels to have similar weights using an λ2 penalty on the gradient of the weight map. Nonetheless, we hypothesized that Graph-net provided smooth solution rather than clearly identified regions. In data classification problems, when extracting structured and sparse predictive maps, the goals are largely aligned with those of PCA. Some classification studies have revealed stable and interpretable results by adding a total variation (TV) penalty to the sparsity constraint (see [63]). For simplicity, rather than solving Eq. (4.2), we solve a slightly different criterion which results from using the Lagrange form, rather than the bound form, of the constraints on V. Then, we extend the Lagrangian form by adding penalties (`1 , `2 and TV) to the minimization problem: 1 2 kX − UDV> kF U,D,V N � K � X X 2 + λ2 kvk k2 + λ1 kvk k1 + λ kAg vk k2 , min
g∈G
k=1
s. t.
kuk k22
= 1, ∀k = 1, · · · , K,
(4.2)
Chapter 4 Unsupervised Machine Learning with Structured Sparsity
48
where λ1 , λ2 and λ are hyper-parameters controlling the relative strength of each penalty. We further propose a generic optimization framework that can combine any differentiable convex (penalized) loss function with: (i) penalties whose proximal operator is known (here k·k1 ) and (ii) a large range of complex, non-smooth convex structured penalties that can be formulated as a k·k2,1 -norm defined over a set of groups G. Such group-penalties cover e.g., total variation and overlapping group lasso. This new problem aims at finding a linear combination of original variables that points in directions explaining as much variance as possible in data while enforcing sparsity and structure (piecewise smoothness for TV) of the loadings. To achieve this, it is necessary to sacrifice some of the explained variance as well as the orthogonality of both the loading and the principal components. Most existing SPCA algorithms [79–82], do not impose orthogonal loading directions either. While we forced the components to have unit norm for visualization purposes, we do not, in this formulation, enforce kvk k2 = 1. Instead, the value of kvk2 is controlled by the hyper-parameter λ2 . This penalty on the loading, together with the unit norm constraint on the component, prevents us from obtaining trivial solutions. The optional 1 N
factor acts on and conveniently normalizes the loss to account for the number of samples
in order to simplify the settings of the hyper-parameters: λ1 , λ2 , λ. This paper presents an extension of the popular PCA framework by adding structured sparsity-inducing penalties on the loading vectors in order to identify the few stable regions in the brain images accounting for most of the variability. The addition of a prior that reflects the data’s structure within the learning process gives the paper a scope that goes beyond Sparse PCA. To our knowledge, very few papers ([88–90, 96]) addressed the use of structural constraint in PCA. The study [88] proposes a norm that induces structured sparsity (called SSPCA) by restraining the support of the solution to be sparse with a certain set of group of variables. Possible supports include set of variables forming rectangles when arranged on a grid. Only one study, recently used the total variation prior [96], in a context of multi-subject dictionary learning, based on a different optimization scheme [97]. Section 4.3 presents our main contribution: a simple optimization algorithm that combines well known methods (deflation scheme and alternate minimization) with an original continuation algorithm based on Nesterov’s smoothing technique. Our proposed algorithm has the ability to include the TV penalty, but many other non-smooth penalties, such as e.g. overlapping group lasso, could also be used. This versatile mathematical framework is an essential feature in neuroimaging. Indeed, it enables a straightforward application to all kinds of data with known structure such as N -dimensional images (of voxels) or meshes of (cortical) surfaces. Section 4.4 demonstrates the relevance of structured sparsity on both simulated and experimental data, for structural and functional MRI (fMRI) acquisitions. SPCA-TV achieved a higher reconstruction accuracy and more stable solutions than ElasticNet PCA, Sparse PCA, GraphNet PCA and SSPCA (from [88]) . More importantly, SPCA-TV yields more interpretable loading vectors than other methods.
Chapter 4 Unsupervised Machine Learning with Structured Sparsity
4.3
49
Method
A common approach to solve the PCA problem, see [80–82]), is to compute a rank-1 approximation of the data matrix, and then repeat this on the deflated matrix [98], where the influence of the PCs are successively extracted and discarded. We first detail the notation for estimating a single component (Section 4.3.1), and its solution using an alternating minimization pipeline (Section 4.3.2). Last, we discuss the algorithm used to solve the minimization problem and its ability to converge toward stable pairs of components/loading vectors (Section 4.3.3) and (Section 4.3.4).
4.3.1
Single component computation
Given a pair of loading/component vectors, u ∈ RN , v ∈ RP , the best rank-1 approximation of the problem given in Eq. (4.2) is equivalent [81] to: smooth
z
}|
non-smooth
{
z
}| { X 1 > 2 min f ≡ − u Xv + λ2 kvk2 + λ1 kvk1 +λ kAg vk2 u,v N g∈G {z } | {z } | {z } | g(v)
s. t.
kuk22
h(v)
(4.3)
s(v)
≤ 1,
where l(v) is the penalized smooth (i.e. differentiable) loss, h(v) is a sparsity-inducing penalty whose proximal operator is known and s(v) is a complex penalty on the structure of the input variables with an unknown proximal operator. This problem is convex in u and in v but not in (u, v).
4.3.2
Alternating minimization of the bi-convex problem
The objective function to minimize is bi-convex [99]. The most common approach to solve a bi-convex optimization problem (which does not guarantee global optimality of the solution) is to alternatively update u and v by fixing one of them at the time and solving the corresponding convex optimization problem on the other parameter vector. On the one hand, when v is fixed, the problem to solve is min −
u∈RN
1 > u Xv N
s. t. kuk22 ≤ 1,
(4.4)
Chapter 4 Unsupervised Machine Learning with Structured Sparsity
50
with the associated explicit solution u∗ (v) =
Xv . kXvk2
(4.5)
On the other hand, solving the equation with respect to v with a fixed u presents a higher level of difficulty. It is solved with the CONESTA algorithm detailed in Chapter 3.
4.3.3
Minimization of the loading vectors with CONESTA
Using Nesterov’s smoothing of the structured penalty, a new (smoothed) optimization problem, closely related to Eq. (4.3) (with fixed u), arises from this regularization as smooth
}| { non-smooth z }| { n o 1 > µ ∗ 2 > 2 ∗ min − u Xv+ λ2 kvk2 +λ αµ (v) Av − kα k2 +λ1 kvk1 . v | {z } | n | {z } {z 2 } z
g(v)
(4.6)
h(v)
sµ (v)
Since we are now able to explicitly compute the gradient of the smooth part ∇(g + λsµ ) (Eq. (4.8)), its Lipschitz constant (Eq. (4.9)) and also the proximal operator of the nonsmooth part, we have all the ingredients necessary to solve this minimization function using the CONESTA algorithm. However, in order to control the convergence of the algorithm (presented in Section 3.5.1), we introduce the Fenchel dual function and the corresponding dual gap of the objective function. The Fenchel duality requires the loss to be strongly convex, which is why we further reformulate Eq. (4.6) slightly: All penalty terms are divided by λ2 and by using the following equivalent formulation for the loss, we obtain the minimization problem g(v)
sµ (v)
h(v)
z }| { z }| { z }| { n o λ > 2 µ 1 1 λ X u 1
+ kvk2 + min fµ ≡ v− α∗µ (v)> Av − kα∗ k22 + kvk1 . 2 v 2 nλ2 2 2 λ2 2 λ2 | {z } | {z } L(v)
(4.7)
ψµ (v)
This new formulation of the smoothed objective function (noted fµ ) preserves the decomposition of fµ into a sum of a smooth term g +
λ λ2 sµ
and a non-smooth term h. Such
decomposition is required for the application of CONESTA as detailed in Chapter 3. Moreover, this formulation provides a decomposition of fµ into a sum of a smooth loss L and a penalty term ψµ required for the calculation of the gap presented in Section 3.5.1.
Chapter 4 Unsupervised Machine Learning with Structured Sparsity
51
We provide all the required quantities to minimize Eq. (4.7). Using Eq. (3.11) we compute the gradient of the smooth part as � � λ λ ∇ g + sµ = ∇(g) + ∇(sµ ) λ2 λ2 λ X> u ) + A> α∗µ (vk ), = (2v − nλ2 λ2
(4.8)
and its Lipschitz constant (using Eq. (3.12)) � � �� λ λ kAk22 L ∇ g + sµ =2+ . λ2 λ2 µ
(4.9)
Based on Eq. (4.7), which decomposes the smoothed objective function as a sum of a strongly convex loss and the penalty, fµ (v) = L(v) + ψµ (v), we compute the duality gap that provides an upper bound estimation of the error to the optimum. At any step k of the algorithm, given the current primal vk and the dual σ(vk ) ≡ ∇L(vk ) variables [73], we can compute the duality gap using the Fenchel duality rules [74]: � � Gap(vk ) ≡ fµ (vk ) + L∗ σ(vk ) + ψµ∗ − σ(vk ) ,
(4.10)
where L∗ and ψµ∗ are respectively the Fenchel conjugates of L and ψµ . Denoting by v∗ the minimum of fµ (solution of Eq. (4.7)), the interest of the duality gap is that it provides an upper bound for the difference with the optimal value of the function. Moreover, it vanishes at the minimum: Gap(vk ) ≥ f (vk ) − f (v∗ ) ≥ 0 Gap(v∗ ) = 0.
(4.11)
The dual variable is σ(vk ) ≡ ∇L(vk ) = v −
X> u , nλ2
(4.12)
the Fenchel conjugate of the squared loss L(vk ) is 1 X> u L∗ (σ(vk )) = kσ(vk )k22 + σ(vk )> . 2 nλ2
4.3.4
(4.13)
The algorithm for the SPCA-TV problem
The computation of a single component through SPCA-TV can be achieved by combining CONESTA and Eq. (4.5) within an alternating minimization loop. Mackey [98] demonstrated that further components can be efficiently obtained by incorporating this single-unit
Chapter 4 Unsupervised Machine Learning with Structured Sparsity
52
procedure in a deflation scheme as done in e.g. [80, 82]. The stopping criterion is defined as
> >
k
X − ui+1 vi+1 − Xk − ui vi F F
StoppingCriterion = .
Xk − ui+1 vi+1 > F
(4.14)
All the presented building blocks were combined into Algorithm 3 to solve the SPCA-TV problem.
Algorithm 3 SPCA-TV(X, ε 1:
X0 = X
2:
for all k = 0, . . . , K do
3:
Initialize
4:
repeat
u0
∈
�
. Components
RN . Alternating minimization
5:
i vi+1 = CONESTA(X> k u , ε)
6:
ui+1 =
Xk vi+1 kXk vi+1 k2
7:
until StoppingCriterion ≤ ε
8:
vk+1 = vi+1
9:
uk+1 = ui+1 Xk+1 = Xk − uk+1 vk+1
10:
>
11:
end for
12:
return U = [u1 , · · · , uK ], V = [v1 , · · · , vK ]
4.4
. Deflation
Experiments
We evaluated the performance of SPCA-TV using two experiments: One simulation study carried out on a synthetic data set and one neuroimaging data set. In order to compare the performance of SPCA-TV with existing sparse PCA models, we also included results obtained with Sparse PCA, ElasticNet PCA, GraphNet PCA and SSPCA from [88]. We used the scikit-learn implementation [100] for the Sparse PCA while we used the Parsimony package (https://github.com/neurospin/pylearn-parsimony) for the ElasticNet, GraphNet PCA and SPCA-TV methods. Concerning SSPCA, we used the MATLAB implementation provided in [88]. Model selection The number of parameters to set for each method is different: For Sparse PCA, the λ1 parameter selects its optimal value from the range {0.1 , 1.0 , 5.0 , 10.0}. ElasticNet PCA requires the setting of the λ1 and the λ2 penalties weights. Meanwhile, GraphNet PCA and SPCA-TV requires the settings of an additional parameter, namely the spatial constraint penalty λ. We operated a re-parametrization of these penalty weights in ratios. A global
Chapter 4 Unsupervised Machine Learning with Structured Sparsity
53
parameter α ∈ {0.01, 0.1, 1.0} controls the weight attributed to the whole penalty term, including the spatial and the `1 regularization. Individual constraints are expressed in terms of ratios: the `1 ratio: λ1 /(λ1 + λ2 + λ), ∈ {0.1, 0.5, 0.8} and the `T V (or `GN for GraphNet) : λ/(λ1 + λ2 + λ), ∈ {0.1, 0.5, 0.8}. For ElasticNet, we explore the grid of parameters composed of the Cartesian product of α and `1 ratio subsets. For GraphNet PCA and SPCA-TV, we perform a parameter search on a grid of parameters given by the Cartesian product of respectively (α, `1 `GN ) subsets and (α, `1 `T V ) subsets . Concerning SSPCA method, the regularization parameter selects its optimal value in the range {10−8 , ..., 108 } However, in order to ensure that the components extracted have a minimum amount of sparsity, we also included a criteria controlling sparsity: At least half of the features of the components have to be zero. For both real neuroimaging experiments, performance was evaluated through a 5-fold x 5-fold double cross validation pipeline. The double cross-validation process consists of two nested cross-validation loops which are referred to as internal and external cross-validation loops. In the outer (external) loop, all samples are randomly split into subsets referred to as training and test sets. The test sets are exclusively used for model assessment while the train sets are used in the inner (internal) loop for model fitting and selection. The inner folds select the set of parameters minimizing the reconstruction error on the outer fold. For the synthetic data, we used 50 different purposely-generated data sets and 5 inner folds for parameters selection. Reconstruction accuracy In order to evaluate the reconstruction accuracy of the methods, we reported the mean Frobenius norm of the reconstruction error across the folds/data sets, on independent test data. The hypothesis we wanted to test was whether there was a substantial decrease in the reconstruction error of independent data when using SPCA-TV compared to when using Sparse PCA, ElasticNet PCA, GraphNet PCA and SSPCA . It was tested through a related two samples t-test. This choice to compare methods performance on independent test data was motivated by the fact that the optimal reconstruction of the training set is necessarily hindered by spatial and sparsity constraints. We therefore expect SPCA-TV to perform worse on train data than other less constrained methods. However, the TV penalty has a more important purpose than just to minimize the reconstruction error: the estimation of coherent and reproducible loadings. Indeed, clinicians expect that, if images from other patients with comparable clinical conditions had been used, the extracted loading vectors would have turned out to be similar. Therefore, since the ultimate goal of SPCA-TV is to yield stable and reproducible weight maps, it is more relevant to evaluate methods on independent test data. Stability The stability of the loading vectors obtained across various training data sets (variation in the learning samples) was assessed through a similarity measure: the pairwise Dice index between loading vectors obtained with different folds/data sets [101]. We tested whether pairwise Dice indices are significantly higher in SPCA-TV compared other methods. Testing
Chapter 4 Unsupervised Machine Learning with Structured Sparsity
54
this hypothesis is equivalent to testing the sign of the difference of pairwise Dice indices between methods. However, since the pairwise Dice indices are not independent from one another (the folds share many of their learning samples), the direct significance measures are biased. We therefore used permutation testing to estimate empirical p-values. The null hypothesis was tested by simulating samples from the null distribution. We generated 1 000 random permutations of the sign of the difference of pairwise Dice index between the PCA methods under comparisons, and then the statistics on the true data were compared with the ones obtained on the reshuffled data to obtain empirical p-values.
4.4.1
Simulation study
Dataset We generated 50 sets of synthetic data, each composed of 500 images of size 100 × 100 pixels. Images are generated using the following noisy linear system :
u1 V 1 + u2 V 2 + u3 V 3 + � ∈ R10 000 ,
(4.15)
where V = [V 1 , V 2 , V 3 ] ∈ R10 000×3 are sparse and structured loading vectors, illustrated in Figure 4.1. The support of V 1 defines the two upper dots, the support of V 2 defines the two lower dots, while V 3 ’s support delineates the middle dot. The coefficients u = [u1 , u2 , u3 ] that linearly combine the components of V are generated according to a centered Gaussian distribution. The elements of the noise vector � are independent and identically distributed according to a centered Gaussian distribution with a 0.1 signal-to-noise ratio (SNR). This SNR was selected by a previous calibration pipeline, where we tested the efficiency of data reconstruction at multiple SNR ranges running from 0 to 0.5. We decided to work with a 0.1 SNR because it is located in the range of values where standard PCA starts being less efficient in the recovery process. We splitted the 500 artificial images into a test and a training set, with 250 images in each set and learned the decomposition on the training set. Results
Chapter 4 Unsupervised Machine Learning with Structured Sparsity
component 1
component 2
55
component 3
Figure 4.1: Loading vectors V = [V 1 , V 2 , V 3 ] ∈ R10 000×3 used to generate the images
Figure 4.2 represents the loading vectors extracted with one data set. Please note that the sign is arbitrary. Indeed, if we consider the loss of Eq. (4.3), u> and v can be both multiply by -1 without changing anything. We observe that Sparse PCA yields very scattered loading vectors. The loading vectors of SPCA-TV, on the other hand, are sparse; but also organized in clear regions. SPCA-TV provides loading vectors that closely match the ground truth. Table 4.1: Scores are averaged across the 50 independent data sets. We tested whether the scores obtained with existing PCA methods are significantly different from scores obtained with SPCA-TV. Significance notations: ***: p ≤ 10−3
Scores Methods
Test Data Reconstruction Error
MSE
Dice Index
Sparse PCA
1576.0***
0.91***
0.28***
ElasticNet PCA
1572.4***
0.83***
0.43***
GraphNet PCA
1570.8***
0.83***
0.30***
SSPCA
1571.9***
1.54***
0.07***
SPCA-TV
1570.1
0.64
0.52
The reconstruction error is evaluated on the test sets (4.1), with its value over the 50 data sets being significantly lower in SPCA-TV than in Sparse PCA (T = 94.5, p = 3.9 · 10−57 ), ElasticNet PCA (T = 33.2, p = 2.7 · 10−35 , GraphNet PCA (T = 12.7, p = 3.6 · 10−17 and SSPCA from [88] (T = 18.9, p = 3.9 · 10−24 ) ) methods.
Chapter 4 Unsupervised Machine Learning with Structured Sparsity
Sparse PCA
component 1
component 2
component 3
ElasticNet PCA
component 1
component 2
component 3
GraphNet PCA
component 1
component 2
component 3
SSPCA (Jenatton et al, 2010)
component 1
component 2
component 3
SPCA - TV
component 1
component 2
component 3
Figure 4.2: Loading vectors recovered from 250 images using different sparse methods.
56
Chapter 4 Unsupervised Machine Learning with Structured Sparsity
57
A different way of quantifying the reconstruction accuracy for each method is to evaluate how closely the extracted loadings match the known ground truth of simulated data set. We computed the mean squared error (MSE) between the ground truth and the estimated loadings. The results are presented in Table 4.1. We note that the MSE is significantly lower with SPCA-TV than with Sparse PCA (T = 6.9, p = 8.0 · 10−9 ), ElasticNet PCA (T = 6.2, p = 1.1 · 10−07 ), GraphNet-PCA (T = 4.1, p = 1.4 · 10−04 ) and SSPCA (T = 22.6, p = 1.5 · 10−27 ). Moreover, when evaluating the stability of the loading vectors across resampling, we found a higher statistically significant mean Dice index when using SPCA-TV compared to the other methods (p < 0.001). The results are presented in Table 4.1. They indicate that SPCA-TV is more robust to variation in the learning samples than the other sparse methods. SPCA-TV yields reproducible loading vectors across data sets. These results indicate that the SPCATV loadings are not only more stable across resampling but also achieve a better recovery of the underlying variability in independent data than the Sparse PCA, ElasticNet PCA, GraphNet PCA and SSPCA methods. Convergence of the algorithm One of the issues linked to biconvex optimization is the risk of falling into locals minima. Conscious of this potential risk, we set up an experiment in which we ran 50 times the optimization of the same problem, with a different starting point at each run. We then compare the resulting loading vectors obtained at each run, and computed a similarity measure, the Dice index. It quantifies the proximity between each independently-run solution with a different starting point. We obtained a Dice index of 0.99 on the 1st component, 0.99 on the 2nd component, and 0.72 on the 3rd component. Off the strength of this indices, we are confident of this algorithm robustness and ability to converge toward the same stable solution independently from the choice of the starting point.
4.4.2
Surfaces meshes of cortical thickness in Alzheimer disease
Dataset Finally, SPCA-TV was applied to the whole brain anatomical MRI from the ADNI database, the Alzheimer’s Disease Neuroimaging Initiative, (http://adni.loni.usc.edu/). The MR scans are T1-weighted MR images acquired at 1.5 T according to the ADNI acquisition protocol. We selected 133 patients with a diagnosis of mild cognitive impairments (MCI) from the ADNI database who converted to AD within two years during the follow-up period. We used PCA to reveal patterns of atrophy explaining the variability in this population. This could provide indication of possible stratification of the population into more homogeneous subgroups, that may be clinically similar, but with different brain patterns. Objective In order to demonstrate the relevance of using SPCA-TV to reveal variability in any kind
Chapter 4 Unsupervised Machine Learning with Structured Sparsity
58
of imaging data, we worked on meshes of cortical thickness. The 317 379 features are the cortical thickness values at each vertex of the cortical surface. Cortical thickness represents a direct index of atrophy and thus is a potentially powerful candidate to assist in the diagnosis of Alzheimer’s disease ([102], [103]). Therefore, we hypothesized that applying SPCA-TV to the ADNI data set would reveal important sources of variability in cortical thickness measurements. Cortical thickness measures were performed with the FreeSurfer image analysis suite (Massachusetts General Hospital, Boston, MA, USA), which is documented and freely available for download online (http://surfer.nmr.mgh.harvard.edu/). The technical details of this procedure are described in [104], [105] and [106]. All the cortical thickness maps were registered onto the FreeSurfer common template (fsaverage). We applied all PCA methods under study to this data set except SSPCA. Indeed, we could not applied SSPCA method to this data set due to some intrinsic limitations of the method. SSPCA ’s application is restricted to N -dimensional array images. It does not support meshes of cortical surfaces such as the data set used here. Results The loading vectors obtained from the data set with sparse PCA and SPCA-TV are presented in Figure 4.4. As expected, Sparse PCA loadings are not easily interpretable because the patterns are irregular and dispersed throughout the brain surface. In contrast, SPCA-TV reveals structured and smooth clusters in relevant regions. The first loading vector, which maps the whole surface of the brain, can be interpreted as the variability between patients, resulting from a global cortical atrophy, as often observed in AD patients. The second loading vector includes variability in the entorhinal cortex, hippocampus and in temporal regions. Last, the third loading vector might be related to the atrophy of the frontal lobe and captures variability in the precuneus too. Thus, SPCA-TV provides a smooth map that closely matches the well-known brain regions involved in Alzheimer’s disease.[107] Indeed, it is well-documented that cortical atrophy progresses over three main stages in Alzheimer disease.([108], [109]) The cortical structures are sequentially being affected because of the accumulation of amyloid plaques. Cortical atrophy is first observed, in the mild stage of the disease, in regions surrounding the hippocampus ([110], [111], [112]) and the enthorinal cortex ([113]), as seen in the second component. This is consistent with early memory deficits. Then, the disease progresses to a moderate stage; where atrophy gradually extends to the prefrontal association cortex as revealed in the third component ([114]). In the severe stage of the disease, the whole cortex is affected by atrophy ([109]) (as revealed in the first component). In order to assess the clinical significance of these weight maps; we tested the correlation between the scores corresponding to the three components and performance on a clinical test: ADAS. The Alzheimer’s Disease Assessment Scale-Cognitive subscale, is the most widely used general cognitive measure in AD. ADAS is scored in terms of errors, so a high score indicates poor performance. We obtained significant correlations between ADAS test performance
Chapter 4 Unsupervised Machine Learning with Structured Sparsity
59
and components ’scores in Figure 4.3. r = −0.34, p = 4.2 · 10−11 for the first component, r = −0.26, p = 3.6 · 10−7 for the second component and r = −0.35, p = 4.0 · 4.5−12 for the third component) The same behavior is observable for all three components: The ADAS score grows proportionately to the level to which a patient is affected and to the severity of atrophy he presents (in temporal pole, prefrontal region and also globally). Conversely, controls subjects score low on the ADAS metric and present low level of cortical atrophy. Therefore, SPCA-TV provides us with clear biomarkers, that are perfectly relevant to the scope of Alzheimer’s disease progression.
Figure 4.3: Correlation of components scores with ADAS test performance
The reconstruction error is significantly lower in SPCA-TV than in Sparse PCA (T = 12.7, p = 2.1 · 10−4 ), ElasticNet PCA (T = 6.8, p = 2.3 · 10−3 ) and GraphNet PCA (T = 2.83, p = 4.7 · 10−2 ). The results are presented in Table 4.2. Moreover, when assessing the stability of the loading vectors across the folds, the mean Dice index is significantly higher in SPCA-TV than in other methods. Table 4.2: Scores are averaged across the 5 folds. We tested whether the averaged scores obtained with existing PCA methods are significantly lower from scores obtained with SPCATV. Significance notations: ***: p ≤ 10−3 , **: p ≤ 10−2 , *: p ≤ 10−1 .
Scores Methods
Test Data Reconstruction Error
Dice Index
Sparse PCA
2991.8***
0.44**
ElasticNet PCA
2832.6**
0.43**
GraphNet PCA
2813.6*
0.62*
SPCA-TV
2795.0
0.65
Chapter 4 Unsupervised Machine Learning with Structured Sparsity
60
Sparse PCA component 1
+4.5
-4.5
component 2
+1.9
-1.9
component 3
+3.6
-3.6
ElasticNet PCA component 1
+0.19
-0.19
component 2
+0.15
-0.15
component 3
+0.12
-0.12
GraphNet PCA component 1
+1.31
-1.31
component 2
+1.88
-1.88
component 3
+1.38
-1.38
component 1
SPCA - TV +0.25
component 2
0
+0.12
-0.12
component 3
+0.09
-0.09
Figure 4.4: Loading vectors recovered from the 133 MCI patients using different methods
Chapter 4 Unsupervised Machine Learning with Structured Sparsity
4.4.3
61
Parameters effects
The SPCA-TV method has 3 parameters. Each of them has an impact on the aspect of the generated weight maps. In order to attempt to build an empirical intuition of each parameter we shall look at the weight maps. We conducted a sensitivity analysis on the real neuroimaging data set in order to increase the understanding of the relationships between input parameters and output weight maps.
• First, let’s focus on the impact of the `T V ratio parameter, in Figure 4.5. The three rows corresponds to three weight maps yielded by three different values of the `T V ratio parameter, together with fixed parameters α and `1 . The top row corresponds to a low value of `T V , the middle row corresponds to a medium value of `T V while the bottom row correspond to a high value of `T V . As a result, increasing `T V increases the spatial constraint applied to the map, resulting in a more structured and smoother map. In addition, it tends to increase the extent of the support, even with a fixed `1 .
Figure 4.5: Sensitivity analysis : Effect of the variation of the `T V ratio parameter on the weight maps.
• Second, let’s focus on the impact of the `1 ratio parameter in Figure 4.6. The three rows correspond to three weight maps yielded by three different values of the `1 ratio parameter, together with fixed parameters α and `T V . The top row corresponds to a low value of `1 , the middle row corresponds to a medium value of `1 while the bottom row corresponds to a high value of `1 . In this case, increasing `1 increases the sparsity penalty applied on the map, resulting in a more parsimonious map.
Chapter 4 Unsupervised Machine Learning with Structured Sparsity
62
Figure 4.6: Sensitivity analysis : Effect of the variation of the `1 parameter on the weight maps.
• Last, let’s focus on the impact of the α parameter in Figure 4.7. The three rows correspond to three weight maps yielded by three different values of the α parameter, together with fixed parameters `1 and `T V . The top row corresponds to a low value of α, the middle row corresponds to a medium value of α while the bottom row corresponds to a high value of α. The takeaway this time around is that increasing α increases the amount of penalties applied on the map, resulting in a more constrained map. Since the penalty term is composed of both spatial and sparsity constraints, we can observe both aspects beeing reinforced when we increase the α: The weight maps get sparser and more structured. However, if the amount of global penalization is too high, it yields weight maps that are way too sparse with zero-coefficients almost everywhere. (such as the weight map of the third row)
Figure 4.7: Sensitivity analysis : Effect of the variation of the α parameter on the weight maps.
It is also interesting to note the extreme effects of `T V and `1 parameters: Extremely high values of these two parameters tend to push the solution toward two opposite weight maps configuration. Extremely high values of `T V will provide a very extended support with
Chapter 4 Unsupervised Machine Learning with Structured Sparsity
63
constant coefficient values. On the other hand, extremely high value of `1 will tend to yield fully sparse weight maps where every voxels have a zero coefficient.
4.5
Conclusion
We proposed an extension of Sparse PCA that takes into account the spatial structure of the data. We observe that SPCA-TV, in contrast to other existing sparse PCA methods, yields clinically interpretable results and reveals major sources of variability in data, by highlighting structured clusters of interest in the loading vectors. Furthermore, SPCA-TV ’s loading vectors were more stable across the learning samples compared to other methods. SPCA-TV was validated and its applicability was demonstrated on two distinct data sets: we may reach the conclusion that SPCA-TV can be used on any kind of structured configurations, and is able to present structure within the data. Moreover, we will demonstrate its performance on an fMRI dataset of patients with schizophrenia in Chapter 6.
Chapter 5
Identifying a neuroanatomical signature of schizophrenia The work presented in this chapter can be found in:
Identifying a neuroanatomical signature of schizophrenia, reproducible across sites and stages, using machine-learning with structured sparsity. Amicie de Pierrefeu, Tommy L¨ ofstedt, Charles Laidi, Fouad Hadj-Selem, Julie Bourgin, Tomas Hajek, Filip Spaniel, Marian Kolenic, Philippe Ciuciu, Nora Hamdani, Marion Leboyer, Thomas Fovet, Renaud Jardri, Josselin Houenou, Edouard Duchesnay. Acta Psychiatrica Scandinavica , 2018 Interpretable and stable prediction of schizophrenia on a large multisite dataset using machine learning with structured sparsity Amicie de Pierrefeu, Tommy L¨ ofstedt, Charles Laidi, Fouad Hadj-Selem, Marian Kolenic, Philippe Ciuciu, Josselin Houenou, Edouard Duchesnay. 8th International Workshop on Pattern Recognition in Neuroimaging, June 2018
5.1
Abstract
Over the years, structural MRI (sMRI) has been increasingly used to gain insight into the abnormalities inherent to schizophrenia. Previous prediction applications relying on machine learning suggest that individual classification is both feasible and increasingly reliable, however, they focused on predictive performance of the clinical status in cross-sectional designs which is limited in terms of biological perspectives. Indeed, off-the-shelf algorithms are insufficient in providing insight into the neurobiological predictive signature. Moreover, all but one studies depend on relatively small cohort sizes or a single recruiting site. Finally, no study controlled for the disease stage or medications effect. All the above evidence 65
Chapter 5 Identifying a neuroanatomical signature of schizophrenia
66
cast doubt on previous findings reproducibility. First, based on structural MRI (sMRI) we propose a machine learning algorithm, with sparse and spatial regularization (structured sparsity), whose aim is to provide an interpretable brain signature. Second, using large dataset collected from 4 international sites (606 sMRI images collected on 276 schizophrenia patients and 330 matched healthy controls) we assessed the reproducibility across sites of the prediction and the associated predictive signature. Third, for the first time, we evaluated the predictive signature regarding medication and duration of illness using an independent dataset of first-episode patients. Machine learning classifiers based on neuroanatomical features yield significant inter-site prediction accuracies (up to 72%) together with an excellent stability of the predictive signature. This signature provides a neural score which is significantly correlated with the symptom severity and the extent of cognitive impairments. Moreover, this signature demonstrates its efficiency on patients with first-episode psychosis (73% accuracy). These results highlight the existence and emphasize the relevance of a common neuroanatomical signature for schizophrenia, shared by a majority of patients ( 75%) even from an early stage of the disorder. In contrast, the remainder of patients (25%), do not present such brain abnormalities, which in turn directly questions the need for a disorder stratification into more homogeneous subgroups.
5.2
Introduction
Schizophrenia is a disabling chronic mental disorder characterized by various symptoms such as hallucinations, delusions as well as impairments in high-order cognitive functions. The development of magnetic resonance imaging (MRI) provides an effective and noninvasive approach to investigate the neuroanatomy of the brain. Specifically, structural MRI (sMRI) allows the study of structural changes in the brain and their relationship with the clinical diagnosis. Over the years, sMRI has been increasingly used to gain insights on the structural abnormalities inherent to the disorder and to identify brain regions where schizophrenia patients differ significantly from healthy controls [35]. Unfortunately, group analyses do not offer the possibility to uncover individual subject deviations from normality. There is indeed a wide overlap between brain-imaging measurements in schizophrenia patients and the normal range [115]. Thus, group analyses cannot be easily used to assist in the diagnosis process. Recent progress in machine learning together with the availability of large datasets now pave the way for automatic detection of brain disorders, solely based on MRI data [116, 117]. In the past, an extensive number of studies have focused on the prediction of schizophrenia based on neuroanatomical features [59, 118, 119]. These studies uncovered relevant structural brain patterns that are different between controls and patients and that achieve a prediction at the individual level. Based on these structural discrepancies alone, classifiers reached various prediction performances ranging from 65% to 90% of accuracy. However, to date,
Chapter 5 Identifying a neuroanatomical signature of schizophrenia
67
despite initial promising results, these studies have barely impacted clinical practice. Significant challenges still need to be tackled for translational implementation of such findings in psychiatry. Schizophrenia is a complex and very heterogeneous disorder. Small size cohorts, typically composed of highly-selected patients, suffer from a bias in the recruitment. They do not represent the full and broad cross-sectional spectrum of the disorder phenotype. Given this variability, a significant heterogeneity can be found in the effect-sizes and patterns of brain differences across studies [29–31]. To date, most studies recruited subjects scanned at a single acquisition site (i.e., the subjects were scanned at the same site, using similar scanner hardware and MRI protocols). Such results are difficult to generalize to large-scale clinical settings, i.e., with patients scanned at widely different locations [32]. Validation on independent datasets is a more realistic approach to quantifying generalization accuracy. Consequently, multi-site populations are instrumental to achieve consistency and reproducibility in the results. To our knowledge, only few studies have relied on a completely independent validation cohort to estimate prediction performances of a classifier [57–59] Leveraging those studies, we intend to further develop our findings along two different aspects. First, in the context of predictive signature discovery, it is crucial to understand the brains structural patterns that underpin a prediction. Unfortunately, in most cases, despite accurate prediction performance achieved, classifiers still behave as a black box model, not providing objective neuroanatomical markers thus ruling out the prospect of clinical application. We will therefore focus on the interpretability of such predictive patterns. Second, we strive to filter-out chronic pharmaceutical treatments impact on the brain. Given that the literature has consistently reported that some regions of the brain are affected by antipsychotic medication [36], our intention is to evaluate the generalization of the developed predictive models on subjects that are still in an early stage of the disease. Hence, we need to address the non-negligible probability that previous classifiers rely heavily on the medication impacts over the brain rather than as true markers of the disorder able to distinguish healthy individuals from those affected by schizophrenia. Here, we validated automatic methods to classify schizophrenia using exclusively sMRI scans. We tested different sMRI-based features to assess inter-site performance replicability using data from 606 subjects scanned at four distinct sites with no prior coordination. In addition, we investigated the interpretability of the obtained neuroanatomical predictive signature and its independance regarding medication. Finally, we tested the ability of our classifiers to generalize to an independent set of patients with first-episode psychosis.
5.3
Methods
Chapter 5 Identifying a neuroanatomical signature of schizophrenia
5.3.1
68
Participants
Brain imaging data from 4 independent studies with no prior coordination were gathered in the current analysis (http://schizconnect.org). The full dataset included 276 patients with strict schizophrenia, according to DSM-IV criteria, and 330 healthy controls. One additional independent set of healthy controls and patients with first-episode psychosis (FEP) was used for additional validation of the prediction performance. Subjects provided informed consent to participate in their respective studies. Demographic details of all four datasets are summarized in Table 5.1 Table 5.1: Demographic and clinical characteristics of the dataset. The validation set is exclusively used for evaluation of the generalization of the learnt predictive model.
Datasets
NUSDAST
COBRE
NMorphCH
VIP
All sites
PRAGUE
Diagnosis
n
age
gender (%F)
Clinical symptoms scores type (mean + sd) SAPS (17.84 15.2)
Schizophrenia
118
33.95 + 12.87
32
Controls
152
27.96 + 12.58
54
Schizophrenia
77
37.28 + 13.56
16
Controls
87
38.33 11.80
27
Schizophrenia
39
32.21 + 9.48
28
Controls
53
35.97 11.32
56
Schizophrenia
39
32.21 + 9.48
28
Controls
53
35.97 11.32
56
NA
Schizophrenia
276
34.46 + 11.99
27
N/A
Controls
330
32.36 12.53
47
N/A
FEP
43
29.18 + 6.14
56
Controls
90
27.74 6.74
55
SANS (21.15 13.6) NA PANSS POS (14.92 5.23) PANSS NEG (15.07 5.21) NA PANSS POS (14.91 7.14) PANSS NEG (21.40 8.59) NA PANSS POS (14.91 7.14) PANSS NEG (21.40 8.59)
PANSS POS (11.33 3.63) PANSS NEG (13.64 5.86) NA
Information regarding the MRI acquisition protocols are gathered in Table 5.2. Prior to the analysis, raw MRI scans were visually controlled for motion and artifacts. 57 scand did not survived this strict quality control and were excluded from further analysis. (Those subjects are not included in the 606 individuals detailed in Table 5.1.)
Chapter 5 Identifying a neuroanatomical signature of schizophrenia
69
Table 5.2: MRI acquisition protocols
Field Site
Brand
strength
Protocol
(T )
5.3.2
TR
TE
(ms)
(ms)
Slice FOV
thickness (mm)
1
Siemens
1.5
MPRAGE
9.7
4
256x256
1.2
2
Siemens
3
MPRAGE
2530
3.5
256x256
1
3
Siemens
3
MPRAGE
2400
3.16
256x256
1
4
Siemens
3
MPRAGE
2300
2.98
256x256
1.1
5
Siemens
3
MPRAGE
2300
4.63
256x256
1
MRI preprocessing and features extraction
Prior to training classifiers, the first step was to compute samples from the structural MRI scans. We retain 3 differents types of features that are potentially powerful candidates to assist in the diagnosis of schizophrenia (22): • VBM: Grey matter voxel-based morphometry maps were computed for each subject using the procedure described in Chapter 1, using SPM12. This produced 125,959 features representing the local grey matter volume (tissue probability with Jacobian intensity modulation) at each voxel. • Vertex-based cortical thickness features were obtained using FreeSurfer, by mapping the cortical thickness value at each vertex on the cortical surface. This produced 299,862 features representing the cortical thickness at each vertex. • Regions of interest features: 66 structural measurements of regions of interest were extracted with FreeSurfer which automatically compute the volume of subcortical regions and the average thickness of cortical parcels.
5.3.3
Machine learning algorithms
Classification analyses were performed with several classifiers to compare prediction performance, stability and interpretability of the weight maps: We used a linear Support Vector Machine (SVM), implemented in the scikit-learn python library (http://scikit-learn.org), and logistic regressions with respectively ElasticNet, GraphNet and TV-Enet penalties, implemented in the Parsimony package. Those classifiers are detailed in Chapter 2 and 3. Therefore, grey matter VBM and vertex-based cortical thickness features models were evaluated using SVM, Enet, GraphNet and Enet-TV classifiers while ROIs-based model was only conducted using SVM and Enet, given that there is no explicit spatial structure in this last set of features. We expect all classifiers to perform similar in terms of absolute prediction
Chapter 5 Identifying a neuroanatomical signature of schizophrenia
70
performance, but in addition the TV-Enet models will produce an interpretable predictive signature of the disorder organized in few regions of imaging features (voxels or vertices). For all analyses, we included age, gender and site as covariates.
5.3.4
Cross-validation and performance assessment
Performance was evaluated using a double cross-validation (CV) scheme. It consists of two nested cross-validation loops. In the outer (external) loop, a set of subjects is considered as the training data, while the remaining subjects are held out and used as the test data. The test sets were exclusively used for model assessment while the training sets were partitioned into sub-training and validation sets, using the nested 5-fold CV, to set all regularization parameters. The splitting process of the samples into train and test subsets is crucial for performance evaluation. In order to investigate the reproducibility of prediction performance across sites, we chose to carry out a leave-one-site-out procedure (See Figure 5.1) for the outer CV. Subjects from all sites except one are referred as the training data, while all subjects of the remaining site are held out and used as the test data. This inter-site setting is paramount in order to assess the reproducibility of a prediction model on completely independent datasets.
Site 1
Site 2
Site 3
Training set
Site 4
Test set
Figure 5.1: Leave-one-site-out procedure
The classifier performances were assessed by computing the balanced accuracy, sensitivity and specificity using the test samples. Sensitivity is defined as the ability to correctly classify patients whereas specificity evaluates the ability to identify healthy controls. The balanced accuracy score is defined as the average of the sensitivity and specificity. We also implemented the receiver operating characteristic (ROC) curve for each classifier, from which the area under the curve (AUC) was computed. To measure the significance of the prediction scores against chance-level, we used an exact binomial test. Along with the prediction performances, we also targeted a more important goal: the estimation of reproducible weight maps against variations of the learning samples. Indeed, clinicians expect that the identified biomarkers, i.e. the non-null weights of the weight map, to be similar if other patients, with similar clinical conditions, would have been used. We therefore used a similarity measure to assess the stability of those weights maps across resampling: The mean correlation between pairs of weights maps computed across the four
Chapter 5 Identifying a neuroanatomical signature of schizophrenia
71
folds, and denoted rβ . This measure of stability was evaluated on the weight maps provided by the parse classifiers: Enet, GraphNet and Enet-TV. Indeed, SVM yields dense weight map and thus comparing the region selected across fold is not relevant.
5.3.5
Interpreting the predictive signature
In order to analyse the brain regions that drive the prediction, we refitted the best model, determined by the CV, on all subjects of the database and we extracted the associated discriminative weights. These weights revealed the spatial patterns that best discriminate schizophrenia patients from healthy controls. The weights revealed the relative contribution of each feature to the decision function. Negative weights reflect that the associated features (local grey matter density or thickness of the cerebral cortex) were higher in controls than in patients with schizophrenia. Positive weights reflect the converse: feature value is higher in patients than in the controls.
5.3.6
Brain signature and symptomatic level
The neuroanatomical predictive signature can be applied to each individual scan to produce a neural score of the disorder for each patient. In a post-hoc analysis, we investigated to what extent this neural score can track the symptomatic level. We leveraged the cognitive scores and symptom severity scales assessed on on patients. Patient’s cognitive functions were evaluated using a battery of neuropsychological tests that are relevant to cognition abnormalities previously reported in schizophrenia: Crystallized intelligence, Working memory, Episodic memory and Executive functions. Those measurements were only available for a subset of 118 patients. Clinical symptoms scores were evaluated through clinical rating of the symptoms dimensions: the Scale for the Assessment of Positive Symptoms (SAPS) and the Scale for the Assessment of Negative Symptoms (SANS). We evaluated the correlation between the neural score provided by the brain predictive signature and those clinical scores. To do so, we regressed each clinical score on the neural score (obtained with the brain signature), while controlling for the effects of age and gender. A p-values threshold of 0.05 was considered as significant.
5.3.7
Brain signature and medication/duration of illness
The impact of antipsychotic treatments on the brain anatomy have been previously reported in the literature [36, 37]. This raises questions about the validity of the learned models and the predictive signature. Our concern was that patients and controls might be classified with regard to their medication status rather than their diagnosis. In order to discard the hypothesis of a confounding effect of medication on discriminative patterns, we conducted two additional analyses. First, we trained a new classifier with a restricted set of features. Based
Chapter 5 Identifying a neuroanatomical signature of schizophrenia
72
on the literature, we masked out the regions that are known to be affected by antipsychotic drugs, such as the striatum [38, 39]. We created a new predictive model using the remaining features and evaluated its performance. Second, we took benefit of a validation cohort, constituted of 133 subjects: 90 healthy controls and 43 participants with first episode-psychosis (See Table 5.1). Some of those patients have taken antipsychotic medication. However, the duration of treatment is very limited (average: 2.56± 5.1 months). Thus, we assumed that the medication impacts on the brain are very limited in this cohort. We evaluated the ability of the models learned on the full cohort, to predict diagnosis in this new, additional population. These two complementary strategies were designed to ensure that the learned models are independent from medication and duration of illness effects, and mainly rely on brain markers inherent to schizophrenia per se.
5.4 5.4.1
Results Prediction performances
Classification results obtained with the inter-site cross-validation splitting strategy are presented in Table 5.3. The classifiers did not differ in terms of absolute prediction performances. They were all able to significantly distinguish patients from healthy controls using all three features sets. Grey matter VBM and ROIs-based features seem to yield better predictive performance (with an AUC of 0.74 and 0.78 respectively) than vertex based cortical thickness features (with and AUC of 0.70). Table 5.3: Intersite prediction performances and stability using different sets of features and classifiers. Prediction accuracies: Sensitivity (Sen, recall rate of trans samples), Specificity (Spe, recall rate of off samples) and Balanced accuracy (Acc): (Sen+Spe)/2; AUC indicates area under the curve. rβ : mean correlation between pairs of weights maps computed across the four folds. SIGNIFICANCE NOTATIONS: *: p ≤ 102
Features
Grey Matter VBM
Vertex based cortical thickness
ROIs based volume
Classifier
AUC
Acc
Spe
Sen
rβ
SVM
0.74
0.69
0.68
0.69
-
Enet
0.76
0.71
0.68
0.73
0.34
GraphNet
0.75
0.70
0.71
0.69
0.42
TV-Enet
0.74
0.68
0.68
0.68
0.74
SVM
0.69
0.64
0.63
0.65
-
Enet
0.60
0.61
0.61
0.61
0.09
GraphNet
0.67
0.62
0.57
0.67
0.19
TV-Enet
0.70
0.66
0.60
0.71
0.76
SVM
0.78
0.72
0.71
0.72
-
Enet
0.74
0.69
0.69
0.70
-
Chapter 5 Identifying a neuroanatomical signature of schizophrenia
73
The prediction performance yielded on each site are reported in Table 5.4. Table 5.4: Accuracy of prediction on each independent site
Features Grey Matter VBM Vertex based cortical thickness ROIs based volume
5.4.2
Classifier
Site 1
Site 2
Site 3
Site 4
SVM
0.71
0.72
0.66
0.67
TV-Enet
0.74
0.71
0.70
0.67
SVM
0.68
0.65
0.63
0.64
TV-Enet
0.68
0.68
0.66
0.65
SVM
0.73
0.75
0.74
0.73
Neuroanatomical predictive signature
We were also interested in the interpretability of the discriminative weight maps. Predictive weight maps yielded by the classifiers are presented in Figure 5.2 and Figure 5.3:
SVM
+0.00005
-0.00005
-0.00005
ElasticNet
+0.05
-0.05
GraphNet
+0.01
-0.01
TV-Enet
+0.001
-0.001
Figure 5.2: Freesurfer predictive signatures obtained with the classifiers- SVM, ElasticNet, GraphNet and Enet-TV
Chapter 5 Identifying a neuroanatomical signature of schizophrenia
74
Figure 5.3: VBM predictive signatures obtained with the classifiers- SVM, ElasticNet, GraphNet and Enet-TV
When using the regular SVM classifier, the relevance of the obtained discriminative weight maps appear limited: It produces a dense map where all voxels/vertices contribute to the prediction. It is challenging to interpret without arbitrary thresholding. Understanding the structural brain patterns that drive the prediction is crucial. Meanwhile, the predictive maps obtained with TV-Enet classifier appear much more interpretable, since it provides a smooth map made of several clearly identifiable regions. Besides the prediction scores, we also targeted a more important goal with the classifier Enet-TV: the estimation of reproducible weight maps across folds. For VBM features, the mean correlation rβ = 0.74 and for vertex-based features; the mean correlation rβ = 0.76. The weight map yielded for each fold by TV-Enet are presented in Figure 5.4.
Fold 1
Fold 1
Chapter 5 Identifying a neuroanatomical signature of schizophrenia
75
+0.001
Fold 2
Fold 2
-0.001
+0.001
Fold 3
Fold 3
-0.001
+0.001
Fold 4
Fold 4
-0.001
+0.001
-0.001
Figure 5.4: VBM and Freesurfer discriminative weight maps yielded by Enet-TV at each fold
5.4.3
Brain signature and symptomatic level
Since the VBM feature yields better predictive performance than the vertex-based features; we restricted the correlation analysis with clinical scores to the VBM predictive signature. We found significant positive correlations between the VBM predictive signature and both, the negative symptoms scores (r = 0.17, p = 3.5e−2 ) and the positive symptoms scores (r = 0.18, p = 2.2e−2 ). The predictive signature also correlated with the extent of cognitive deficits in all domains tested: Crystallized intelligence, working memory, episodic memory and executive functions (see Table 5.5).
Chapter 5 Identifying a neuroanatomical signature of schizophrenia
76
Table 5.5: Associations between cognitive and symptoms severity scores and the predictive signature.
Clinical scores
r
p-value
SANS
0.17
3.5e−2
SAPS
0.18
1.2e−2
-0.24
4.4e−3
WMS Digit Span
-0.23
7.1e−2
WMS Spatial Span
-0.18
2.3e−2
WMS Letter Number Sequencing
-0.15
4.8e−2
CPT dprime
-0.18
3.5e−2
WMS Logical Memory
-0.23
7.1e−2
WMS Family Picture
-0.18
2.3e−2
WAIS Matrix Reasoning
-0.23
7.1e−2
WCST perseverative errors
-0.18
2.3e−2
Symptoms
Crystallized Intelligence WAIS vocabulary Working Memory
Episodic Memory
Executive Functions
The Figure 5.5 illustrates one of those correlation between the neuroanatomical signature and the positive symptoms score (SAPS) of patients.
Figure 5.5: Correlation between the neuroanatomical signature score and the negative and positive symptoms scores (SANS and SAPS) of patients.
5.4.4
Brain signature and medication/duration of illness influence
The classifiers we developed possibly rely more on the effects of treatment or evolution of the disease on the brain rather than on markers of the disorder to distinguish healthy controls
Chapter 5 Identifying a neuroanatomical signature of schizophrenia
77
from schizophrenia patients. To discard this hypothesis, we ran additional predictive models by masking out the regions that are known to be affected by antipsychotic medications (such as the striatum region). Even without these regions, results are encouraging as we obtained similar prediction accuracy than with the full model. We also assessed the prediction performance of the learned models on an independent set of subjects with a first-episode psychosis (validation cohort, see Table 5.1). This sample was not included in the learning datasets. The prediction performances obtained on those patients are presented in Table 5.6. The prediction performances are promising, ranging from 64 % to 76 % of accuracy, depending on the features used to build the model Table 5.6: Intersite prediction performances on independent subjects with first-episode psychosis. Prediction accuracies: Sensitivity (Sen, recall rate of trans samples), Specificity (Spe, recall rate of off samples) and Balanced accuracy (Acc): (Sen+Spe)/2; AUC indicates area under the curve. SIGNIFICANCE NOTATIONS: *: p ≤ 102
Features
Grey Matter VBM Vertex based cortical thickness ROIs based volume
5.5
Classifier
AUC
Acc
Spe
Sen
SVM
0.78
0.71
0.61
0.81
TV-Enet
0.76
0.73
0.66
0.81
SVM
0.68
0.64
0.59
0.69
TV-Enet
0.64
0.61
0.52
0.69
SVM
0.72
0.66
0.63
0.69
Discussion
In this large inter-site study, we showed that machine-learning classifiers based on neuroanatomical features are able to accurately distinguish controls from schizophrenia patients in an inter-site setting. A predictive neuroanatomical signature associated to the classification process can be extracted and interpreted. Moreover, the models were found independent to duration of illness and have the ability to generalize to the prediction of first-episode psychosis.
5.5.1
Prediction performances
The predictive models obtained robust inter-site prediction performances that are consistent with the average prediction scores reported in the literature [58, 59]. This suggests that the predictive models of schizophrenia we developed here are able to generalize to subjects from unseen sites. This is promising in the scope of cross-site classification of individuals. However, besides the absolute prediction performance, we are also interested in the identification of a neuroanatomical predictive signature of schizophrenia.
Chapter 5 Identifying a neuroanatomical signature of schizophrenia
5.5.2
78
Neuroanatomical predictive signature
The interpretation of the coefficient map is is not straightforward. As raised by some papers [120–122], we are facing a backward decoding problem where we intend to predict the causal clinical status given the brain phenotypes results. Some coefficients can capture a general variability associated to a latent variable (typically the age) that is not specific to the disease of interest. Conversely some regions may be overlooked due to the sparsity constraint. Identifying a neuroanatomical signature of schizophrenia that is clinically interpretable is crucial. All things considered, while the state-of-the-art SVM classifier provides dense patterns of predictors that are clinically uninterpretable, the Enet and GraphNet classifiers yield predictive patterns that are sparse and scattered across the brain. Using the advanced machine learning (TV-Enet) classifier (which performs similar than other classifierst, in terms of absolute prediction performances), we were able to identify an interpretable neuroanatomical predictive signature of schizophrenia, that is organized in, brain regions that are in line with the literature. Moreover, the predictive signature yielded by Enet-TV is reproducible across folds, with similar predictors selected when different samples are used in the training phase. The predictive signature yielded is consistent across the three types of features (identified regions from (i) whole brain voxels or (ii) cortical vertices and (iii) atlas-based ROIs). (See Figure 5.6 and Figure 5.7 for details of this signature). The identified patterns appear largely consistent with available neural data in schizophrenia and may fill the criteria to become a biomarker of the disorder. We indeed found that classification of patients with schizophrenia relied on reduced gray matter compared to healthy controls in the cingulate gyrus, precentral and postcentral gyrus, temporal pole, hippocampus, amygdala and thalamus. These regional deficits of grey matter in schizophrenia patients have been consistently reported in univariate studies [24, 26, 123–125]. On the other hand, we found a regional increase of grey matter in schizophrenia patients compared to healthy controls in the putamen, caudate and pallidum. These local increased GM in schizophrenia were also frequently reported in previous studies [24, 26, 123–126].
Chapter 5 Identifying a neuroanatomical signature of schizophrenia
Clusters
Center in MNI coordinates (x,y,z)
Cluste r size (voxel)
Cluster mean weight
Regions involved
1
(3,-31,25)
240
− 5.9 · 10−4
Cingulate Gyrus
2
(16,10,21)
426
3.7 · 10−4
Right Caudate, Right Putamen, Right Pallidum
3
(-33,-21,63)
2036
− 1.3 · 10−4
Precentral Gyrus, Postcentral Gyrus
4
(-7,60,-6)
1934
− 1.2 · 10−4
Paracingulate Gyrus, Cingulate Gyrus
5
(36,15,27)
4279
− 5 · 10−5
6
(-39,-10,-31)
4608
− 3.2 · 10−5
7
(-12,0,19)
3173
3.2 · 10−5
8
(-6,-10,13)
864
− 2.9 · 10−5
9
(6,-7,13)
338
− 2.1 · 10−5
10
(-66,-37,-15)
303
− 1.8 · 10−5
79
Visualisation
Parahippocampal gyrus, Temporal Pole
Left Hippocampus, Left Amygdala
Left Caudate, Left Putamen, Left Pallidum, Left Lateral Ventricle
Left thalamus
Right Thalamus
Middle Temporal Gyrus
Figure 5.6: Grey matter voxel-based morphometry features: Discriminative clusters. Clusters are presented ordered by weight.
Chapter 5 Identifying a neuroanatomical signature of schizophrenia
Clusters
Center in MNI coordinates (x,y,z)
Cluster size (voxel)
Cluster mean weight
Regions involved
1
(8,-17,39)
678
-0.10
Right Posterior Cingulate Gyrus
2
(5,-48,19)
653
-0.12
Isthmus of Right Cingulate Gyrus
3
(59,5,30)
1085
-0.23
Right Precentral Gyrus
4
(35,1,9)
675
-0.10
Right Insula
5
(-48,-54,-11)
2216
-0.46
Left Inferior Temporal Gyrus
6
(-41,-67,16)
248
-0.05
Left Inferior Parietal Gyrus
7
(-34,-30,63)
256
-0.03
Left Postcentral Gyrus
8
(-11,-73,-4)
591
-0.18
Left Lingual Gyrus
80
Visualisation
Figure 5.7: Vertex-based cortical thickness features: Discriminative clusters. Clusters are presented ordered by weight.
Furthermore, significant correlations were found between this predictive signature and both negative and positive symptom scores. Such result is consistent with the literature where negative symptoms have already been reported to be associated to the extent of structural brain abnormalities in schizophrenia [59, 127]. Additionally, the neural score obtained from
Chapter 5 Identifying a neuroanatomical signature of schizophrenia
81
the predictive signature is also correlated with the extent of cognitive impairments in all the domains that are known to be impacted in schizophrenia. This result is promising since it paves the way towards the use of a neuroanatomical signature as an objective measure to monitor the evolution of the disorder.
5.5.3
Medication/duration of illness influence
We also tested for the prediction performances obtained on the first-episode psychosis cohort. Indeed, from a clinical perspective, the true value of MRI-based prediction lies in the early diagnosis. Indeed, accurately predicting chronic schizophrenia patients affected by the disease for a long time does not provide ground-breaking insight. Instead, what is clinically relevant is the identification of patients who are still at an early stage of the disease. Interestingly, our predictive models appear able to accurately classify first-episode psychosis subjects as patients. This finding suggests that these classifiers mainly rely on true markers of schizophrenia rather than medication effects or duration of illness. The identified neuroanatomical predictive signature seems to generalize to the detection of patients at the early stage of the disorder. Furthermore, because providing early care to reduce the duration of untreated psychosis has been identified as a predictor of long-term outcome in schizophrenia [13], present findings directly question the systematic use of sMRI combined with predictive models to assist clinicians in the early stages of the disorder.
5.5.4
Future work
We demonstrated in this study that it is possible to accurately discriminate schizophrenia patients from controls, using structural MRI. At this stage, this does not imply that such models are able to distinguish patients with various psychiatric conditions. In order to demonstrate the clinical relevance of predictive models such as the one developed in this study, the next step would be to evaluate the specificity of the classifiers in differential diagnosis situations. There is now an urgent need for transdiagnostic studies able to compare the specificity of the identified neuroanatomical predictive signature in schizophrenia but also in bipolar disorder or autism spectrum disorder.
5.6
Conclusion
These results highlight the existence of a neuroanatomical signature of schizophrenia, shared by a majority of patients across different sites and already present a the early stage of the disorder. Moreover, this signature is associated with the symptoms severity and the amount of cognitive deficit. Such neuroanatomical signature is made publicly available at ftp: //ftp.cea.fr//pub/unati/brainomics/papers/scz_predict_vbm. This signature can be
Chapter 5 Identifying a neuroanatomical signature of schizophrenia
82
used by the community with the same strategy than the polygenic score in genetics to summarize anatomical information or determine candidate regions. However, a minority of patients do not present such brain abnormalities, which in turn directly questions the need for a disorder stratification into more homogeneous subgroups.
Chapter 6
Prediction of pre-hallucinations patterns in schizophrenia patients The work presented in this chapter has been published in: Prediction of activation patterns preceding hallucinations in patients with schizophrenia using machine learning with structured sparsity. Amicie de Pierrefeu, Thomas Fovet, Fouad HadjSelem, Tommy L¨ofstedt, Philippe Ciuciu, Stephanie Lefebvre, Pierre Thomas, Renaud Lopes, Renaud Jardri, Edouard Duchesnay. Human brain mapping, 2018
6.1
Abstract
Despite significant progress in the field, the detection of fMRI signal changes during hallucinatory events remains difficult and time-consuming. Thus, this paper first proposes a machine-learning algorithm to automatically identify resting-state fMRI periods that precede hallucinations versus periods that do not. When applied to whole-brain fMRI data, state-of-the-art classification methods, such as support vector machines (SVM), yield dense solutions that are difficult to interpret. We proposed to extend the existing sparse classification methods by taking the spatial structure of brain images into account with structured sparsity using the total variation penalty. Based on this approach, we obtained reliable classifying performances associated with interpretable predictive patterns, composed of two clearly identifiable clusters in speech-related brain regions. The variation in transition-tohallucination functional patterns not only from one patient to another but also from one occurrence to the next (e.g., also depending on the sensory modalities involved) appeared to be the major difficulty when developing effective classifiers. Consequently, second this paper aimed to characterize the variability within the pre-hallucination patterns using an extension of principal component analysis with spatial constraints. The principal components (PCs) 84
Chapter 6 Prediction of pre-hallucinations patterns in schizophrenia patients
85
and the associated basis patterns shed light on the intrinsic structures of the variability present in the dataset. Such results are promising in the scope of innovative fMRI-based therapy for drug-resistant hallucinations, such as fMRI-based neurofeedback.
6.2
Introduction
Hallucinations are defined as abnormal perceptions in the absence of causative stimuli. These experiences, especially auditory hallucinations, constitute fundamental features of psychosis (64-80% lifetime prevalence among schizophrenia-diagnosed patients) and can lead to functional disability and a low quality of life [128] Over the past years, auditory hallucinations have been studied in-depth using brain imaging methods, such as functional and structural magnetic resonance imaging (fMRI and sMRI), to decipher their underlying neural mechanisms. Numerous brain changes have been extensively covered in a wide range of studies in patients suffering from auditory hallucinations (e.g., [129–132]. Beyond location, the functional dynamics of the neural networks involved in auditory hallucinations have also been studied. To address this important question, an increasing number of studies have focused on so-called intrinsic connectivity networks (ICN) and their potential role in the onset of hallucinations [133, 134]. ICNs typically reveal interactions among brain regions when the subject is not engaged in any particular task. Frequently reported networks include the default mode network (DMN), the control executive network (CEN), the salience network (SAL) and the sensorimotor network (SMN) [133]. Numerous studies have asserted that fluctuations in those ICNs are associated with the onset of hallucination periods. For instance, the emergence of hallucinations correlates with a disengagement of the DMN [135]. More recently, stochastic effective connectivity analyses revealed complex interactions among hallucinationrelated networks, DMN, SAL and CEN, during the ignition, active phase, and extinction of hallucinatory experiences [136]. Despite significant progress in the field, capturing the neural correlates of subjective mental events (such as hallucinations) remains a time-consuming task with multiple post-processing steps and analyses. However, recent progress in machine learning has now paved the way for real-time automatic fMRI decoding of hallucination-related patterns. Such developments may have crucial impacts on the implementation of innovative fMRI-based therapy for drugresistant hallucinations, such as fMRI-based neurofeedback [137, 138]. During fMRI-based neurofeedback, brain activity is measured and fed back in real-time to the subject to help her/him progressively achieve voluntary control over her/his own neural activity. Precisely defining strong a priori strategies for choosing the appropriate target brain area/network(s) for fMRI-based protocols appears critical. Interestingly, considering the rapid technical developments of fMRI techniques and the availability of high-performance computing, the pattern
Chapter 6 Prediction of pre-hallucinations patterns in schizophrenia patients
86
classification approach now appears to be one of the potential strategies for fMRI-based neurofeedback sessions. In this context, the feasibility of fMRI-based neurofeedback relies on robust and reliable classifying performances and on the ability to detect hallucinations sufficiently early to allow the patients the necessary time to modulate their own cerebral activity [139]. Rather than detecting hallucinatory events per se, we aim to help patients become aware of the imminence of this experience based on online detection of fMRI signal changes in key networks involved in the ignition of hallucinations. Thus in this study, we specifically focused on the period preceding the occurrence of an hallucination, i.e., the few seconds corresponding to the brains transition from a resting-state to a full hallucinatory state. Interestingly, previous fMRI studies have noted the existence of specific fMRI changes prior to hallucinations [136, 140– 142]. Among the current machine-learning approaches available for fMRI analysis, multivoxel pattern analysis (MVPA), a supervised classification method, is gaining recognition for its potential to accurately discriminate between complex cognitive states [139, 143]. MVPA seeks to identify significantly reproducible spatial activity patterns differentiated according to mental states. Extending these methods to the prediction of the phenomena of transition towards hallucinations should provide better insight into the mechanisms of these subjective experiences. Thus, leveraging real-time pattern decoding capabilities and applying them in the case of hallucinations could lay the foundation for potential solutions for affected individuals. Variations in transition-to-hallucination functional patterns from one patient to another (e.g., due to phenomenological differences) and from one occurrence to the next (e.g., depending on the modalities involved) appears to be the potential major shortcomings in developing an effective classifier. Indeed, such disparities may inexorably lead to a decrease in decoding performances. Therefore, characterizing the variability within the pre-hallucination patterns across subjects and occurrences is highly desired. Principal component analysis (PCA) is one such unsupervised method that has been successfully applied in the analysis of the variability of a given dataset. The principal components (PCs) and the associated basis patterns shed light on the intrinsic structures of the variability present in a dataset. This unsupervised approach is complementary to the supervised approach described above, as it can help with interpreting the classification performances. Here, we applied both supervised and unsupervised machine-learning methods to an fMRI dataset collected during hallucinatory episodes. The goal of this paper was two-fold: i) to predict the activation patterns preceding hallucinations using a supervised analysis and ii) to uncover the variability in these activation patterns during the emergence of hallucinations using unsupervised analysis. The goals of these two analyses appear completely complementary in the context of future fMRI-based clinical and therapeutic applications.
Chapter 6 Prediction of pre-hallucinations patterns in schizophrenia patients
6.3 6.3.1
87
Methods Participants and experimental paradigms
The population was composed of 37 patients with schizophrenia (DSM-IV-TR criteria) who were suffering from very frequent multimodal hallucinations (i.e., more than 10 episodes/hour). Participants were recruited through the FR2SM network (Fdration Rgionale de Recherche en Sant Mentale), which groups all the private/public institutions for mental health in the Hauts-de-France region (62% of the participants were hospitalized at the time recruited, 38% received outpatient care). This sample presents a partial overlap with previous works from our team [136, 144]. The clinical characteristics of the recruited subjects are summarized in Table 6.1. Table 6.1: Clinical characteristics of the recruited samples. CGI = Clinical Global Impressions Scale; EqOZ = Equivalent Olanzapine; PANSS = Positive and Negative Syndrome Scale; AHRS = Auditory Hallucination Rating Scale.
Age (mean ± sd) Sex CGI (mean ± sd)
35.8 ± (9.8) years 10 F / 27 M 4.2 ± (1.6)
Dose of anti-psychotic treatment (EqOZ) (mg/d)
42.5 ± (22,4)
PANSS (mean ± sd)
82.4 ± (20.3)
AHRS (mean ± sd)
26 ± (7)
Average number of hallucination episodes per patient
4
Number of patients experiencing hallucinations (by modality) during the fMRI session Auditory
32
Tactile
7
Visual
6
Gustatory
2
Olfactory
2
fMRI was acquired at rest. Participants were asked to lie in the scanner in a state of wakeful rest with their eyes closed. The subjects experienced an average of 4 hallucinatory episodes per scan. The patients states at different acquisition times were labelled using a semi-automatic difficult procedure, as described in [135, 144] and were assigned to one of the following four categories: transition towards hallucinations (trans), on-going hallucinations (on), no hallucinations (off) and end of hallucinations (end).
Chapter 6 Prediction of pre-hallucinations patterns in schizophrenia patients
88
This labelling task is a non-straightforward two-steps strategy; the first step is a data-driven analysis of the fMRI signal using an ICA in the spatial domain. The second step involves the selection of the ICA components associated with possible sensory experiences that occurred while scanning. This pipeline is said to be semi-automatic since it combined the following: (a) an automatic denoising part, based on the classifiers described in [145] and (b) a manual and time-consuming part, with the use of an immediate post-fMRI interview conducted with the patient, in which the sensory modalities, number of episodes, and phenomenological features of the experiences were specified. The study was approved by the local ethical committee (CPP Nord-Ouest France IV), and written informed consent was obtained for each participant enrolled in the study.
6.3.2
Imaging parameters
The participants underwent an 11-minute anatomical T1 weighted 3D multishot turbo-fieldecho scan (3 T Philips Achieva X-series, with an 8-elements SENSE head coil). The fieldof-view was 256 mm2 with a voxel resolution of 1 mm in all directions. Participants also underwent a blood oxygen level-dependent (BOLD) fMRI session. The parameters of the 3D-PRESTO SENSE sequence were field-of-view 206 x 206 x 153 mm3, TE = 9.6 ms, TR = 19.25 ms, EPI-factor = 15, flip angle = 9, dynamic scan time = 1000 ms. Because of the multishot nature of the PRESTO sequence, the TR is not equivalent to the scan duration. Each fMRI session consisted of 900 volumes collected for a total acquisition time of 15 min.
6.3.3
fMRI Preprocessing
The anatomical and functional data were pre-processed using SPM12 (WELLCOME, Department of Imaging Neuroscience, London, UK) running on MATLAB R2016a (MathWorks, Inc., Natick, Massachusetts, USA). To control for motion-induced artefacts, the point-topoint head motion was estimated for each subject [146]. Excessive head motion (cumulative translation or rotation ≥3mm or 3◦ ) was applied as an exclusion criterion. Applying this filter, one patient was excluded from the analysis. Signal preprocessing consisted of motion correction (realignment of fMRI volumes) and voxelwise linear detrending. Given that we excluded subjects in whom motion was too influential, we estimated that noise had a contained and, therefore, tolerable impact on the remaining subjects. Moreover, concerning the low frequency trends in the fMRI signal, we believed that these slow signal intensity drifts did not create excessive artefacts over the signal, given that we were dealing with very short periods of transition. Hence, applying linear detrending was likely sufficient. Then, we performed coregistration of the individual anatomical T1 images to the functional images and spatial normalization to the Montreal Neurological Institute (MNI) space using DARTEL based on the segmented T1 scans. We did not perform any spatial smoothing step in the preprocessing pipeline. The MNI brain mask was used to restrict voxels considered in the subsequent steps to 67,665 voxels.
Chapter 6 Prediction of pre-hallucinations patterns in schizophrenia patients
6.3.4
89
Computation of samples
Prior to training classifiers, the first step involved computing samples from the fMRI signal. The intention was to convert the fMRI signal into vectors of features reflecting the pattern of activity across voxels at a point in time. We opted against creating the samples directly from the fMRI signal. Instead, we created the samples by estimating the activity within each voxel using a linear model. The design of such a model was a crucial part of the learning process. We used a general linear model (GLM) to estimate the activity within each voxel. From each set of consecutive images within a pre-hallucination state (trans periods) or off state, we created one sample. On average, each trans or off state lasted for 8 consecutive EPI volumes, which appeared sufficient to estimate activity. Based on the GLM, we regressed the fMRI signal time course on a linear ramp function for each set of consecutive volumes. This choice was based on the hypothesis that activation in some regions presents a ramp-like increase during the time preceding the onset of hallucinations.
Figure 6.1: (a) Regression of the fMRI signal time course of a voxel on a linear ramp function (fit is represented in green). (b) Sample created from one set of consecutive prehallucinations scans. The features are the T-statistic values associated with the coefficients of the regression in each voxel
A sigmoid activation in some regions prior to the occurrence of an hallucination is potentially more realistic than a ramp-like activation. However, in order to fit a sigmoid function to a
Chapter 6 Prediction of pre-hallucinations patterns in schizophrenia patients
90
set of points, two parameters need to be estimated. Given the fact we only had a limited set of 8 consecutive pre-hallucination EPI volumes, fitting a sigmoid would have meant leaving only 6 degrees of freedom. Given the arguments above and our wish to reach the highest possible level of robustness, we, thus, chose to use a ramp model in these conditions. Figure 6.1.A represents the evolution of the signal intensity in one single voxel over the 8 consecutive volumes of a pre-hallucination period of a subject. In this specific voxel, the signal presents a ramp-like increase during the pre-hallucination period. Given that most of the patients hallucinated more than once during the scanning session, we had more samples than patients (376 samples created from 36 patients). The samples that we used as inputs to the machine-learning process were the statistical parametric maps associated with the slope coefficients of the regression. (See Figure 6.1.B as an example of one sample). We obtained a dataset of 376 samples: 166 in the resting state (off periods) and 210 in the pre-hallucination state (trans periods) with 67,665 features.
6.3.5
Supervised analysis
Given the slow, partially manual and interview-intensive nature of the cognitive state labelling pipeline (see [135]), we constructed an algorithm in parallel to detect a transitionto-hallucination state in a real-time, automated fashion exclusively relying on the imaging data. We focused the analysis on the transition towards a hallucination state (trans) with the intention of distinguishing it from the resting-state activity (off). Classifiers Learning with hundreds of samples (376) using high-dimensional data (7x10⁴ voxels) was associated with a high risk of overfitting in the training subjects, leading to poor performances of the independent subjects. Such issues of replicability can be addressed using state-of-theart regularized learning algorithms as discussed in Chapter 2 and 3. In this study, we compared the prediction performance and interpretability of weight maps provided by two different classifiers: the linear Support Vector Machine and the TV-Enet classifier. All analyses were performed in Python using the scikit-learn toolbox ([147] and the pylearnparsimony package (https://github.com/neurospin/pylearn-parsimony). Performance metric, cross-validation and model selection Performance was evaluated through a double cross-validation pipeline. The double crossvalidation process consists of two nested cross-validation loops. In the outer (external) loop of the double cross-validation, we employed a leave-one-subject-out pipeline where all subjects except one were referred to as the training data, and the remaining subject was used as test data. The test sets were exclusively used for model assessment, whereas the training sets were used in the inner 5-fold cross-validation loop for model fitting and model selection. Classifier performances were assessed by computing the balanced accuracy, sensitivity and specificity with which the test samples were classified. Sensitivity was defined as the ability to
Chapter 6 Prediction of pre-hallucinations patterns in schizophrenia patients
91
identify the transition towards hallucination state (trans), whereas specificity evaluated the ability to identify the resting-state activity (off). The balanced accuracy score was defined as the average of the sensitivity and specificity. We also implemented the receiver operating characteristic (ROC) curve for each classifier, from which the area under the curve (AUC) was computed. Result significance To measure the significance of the prediction scores for both classifiers, we used an exact binomial test while leveraging a paired two-samples t-test to compare the decoding performances of the two classifiers. Predictive pattern To analyse the brain regions that drive the prediction, we refitted the model on all samples of the dataset and extracted the associated discriminative weight map. This weight map revealed the spatial patterns that best discriminate the two cognitive states (trans and off). The weights revealed the relative contribution of each voxel to the decision function. Positive weights indicated a positive contribution towards predicting the trans state, whereas negative weights signalled a positive contribution towards predicting the off state.
6.3.6
Unsupervised Analysis
Subsequently, in addition to the supervised analysis, we conducted an extensive analysis of the data using unsupervised machine learning. The goal was to characterize the variability within the pre-hallucination scans. PCA can extract the significant mode of variation from high-dimensional data. However, its interpretability remains limited. Indeed, the components produced by PCA are often noisy and exhibit no visually meaningful patterns. Nonetheless, our ultimate goal was to understand the variability in the form of intelligible patterns. In this context, we used SPCA-TV tool, describe in Chapter 4, which is an extension of regular PCA with `1 , `2 , and T V penalties on the PCA loadings, promoting the formation of structured sparse components that are relevant in a neuroscientific scope [148]. We hypothesized that the principal components extracted with SPCA-TV could uncover major trends of variability within the pre-hallucination samples. Thus, the principal components might reveal the existence of subgroups of hallucinations, notably according to the sensory modality involved (e.g., vision, audition, etc.). From the 376 samples, we retained the 210 elements corresponding to the pre-hallucinations samples. We applied SPCA-TV to these 210 samples and interpreted the resulting principal components. Additionally, we computed the explained variance of each component yielded by SPCA-TV and investigated whether these components were really capturing a signature of the cognitive process involved in the onset of hallucinations. To do so, we projected each activation map, off and trans samples, in the basis formed by the principal components and used the subsequent associated scores to decode the mental state of each subject. We used an SVM using the same cross-validation pipeline described in the supervised analysis method section.
Chapter 6 Prediction of pre-hallucinations patterns in schizophrenia patients
6.4 6.4.1
92
Results Supervised analysis
Classification performances The classification results are presented in Table 6.2. Classification of resting state (i.e., non-hallucination) patterns (off) versus transition towards hallucinations patterns (trans) achieved above chance level decoding performances with both methods. Using the SVM classifier, we obtained an AUC of 0.73 and a balanced accuracy of 0.73, with a specificity of 0.78 and a sensitivity of 0.67. When using the TV-Enet classifier, we obtained an AUC of 0.79 and a balanced accuracy of 0.74, with a specificity of 0.76 and a sensitivity of 0.71. The TV-Enet yielded a significantly increased AUC compared to SVM (T = 2.87, p = 0.006). Table 6.2: The performance of the classifiers. Prediction accuracies: sensitivity (recall rate of trans samples), specificity (recall rate of off samples) and balanced accuracy: (Sen+Spe)/2; AUC indicates area under the curve. We tested whether the scores obtained with SVM were significantly different from the scores obtained with TV-Enet. SIGNIFICANCE NOTATIONS: *: p ≤ 10−2
Classifier
AUC
Accuracy
Specificity
Sensitivity
SVM
0.73*
0.73
0.78
0.67
TV-Enet
0.79*
0.74
0.76
0.71
Since the 37 patients included in this study were suffering from multimodal hallucinations (see Table 6.1), we also evaluated the performance of the prediction of the TV-Enet model on two subsamples, one of which comprised the 32 subjects suffering from auditory hallucinations, among other modalities, and the other comprised of the 5 subjects without any auditory hallucinations (Table 6.3). For the cohort of patients experiencing auditory hallucinations, we obtained an AUC of 0.80 and a balanced accuracy of 0.75, with a specificity of 0.76 and a sensitivity of 0.73. For the cohort of patients who were not experiencing auditory hallucinations, we obtained decreased prediction performances, namely, an AUC of 0.75, a balanced accuracy of 0.63, with a specificity of 0.74 and a sensitivity of 0.55. Table 6.3: Prediction performances of the TV-Enet on the subgroup of patients experiencing auditory hallucinations, among other modalities (top row), and on the subgroup of patients who were not experiencing auditory hallucinations. (bottom row)
Presence of Auditory Hallucinations
AUC
Accuracy
Specificity
Sensitivity
Yes
0.80
0.75
0.76
0.73
No
0.75
0.63
0.74
0.55
Chapter 6 Prediction of pre-hallucinations patterns in schizophrenia patients
93
Predictive weight maps When using the regular SVM classifier, the relevance of the obtained discriminating weight maps was limited (Figure 6.2.A). The whole brain seemed to contribute to the prediction. It is clinically challenging to interpret the weight map. The TV-Enet classifier yields a more coherent weight map with two defined stable predictive clusters (Figure 6.2.B). The details of these two clusters are described in Table 6.4.
Figure 6.2: (a) Linear support vector machine (SVM) and (b) TV-Enet predictive weight map
Chapter 6 Prediction of pre-hallucinations patterns in schizophrenia patients
94
Table 6.4: Supervised analysis: The clusters in the discriminative weight map.
Center Clusters
in MNI
Cluster
Cluster mean
coordinates
size
weight
Cortical regions involved
(x,y,z) Precentral Gyrus Postcentral Gyrus Inferior Frontal Gyrus Central Opercular Cortex Anterior and Posterior Right
(53,0,15)
3,541
4.1e−4
Supramarginal Gyrus Insular Cortex Frontal Pole Middle Frontal Gyrus Planum Temporale Temporal Pole Superior Temporal Gyrus Precentral Gyrus Frontal Pole Postcentral Gyrus Middle Frontal Gyrus
Left
(-36,0,28)
10,134
2.0e−4
Superior Frontal Gyrus Insular Cortex Frontal Orbital Cortex Central Opercular Cortex Inferior Frontal Gyrus
6.4.2
Unsupervised analysis
Relevance of components The first component explained 2.5% of the variance. The second component explained 1.4% of the variance. The third component explained 0.09% of the variance. The fourth component explained 0.05% of the variance. The prediction of mental states based on the scores associated with each component yielded a significant decoding performance: the classifier was able to distinguish the trans samples from off samples, with an AUC of 65%, a recall mean of 65%, a sensitivity of 68% and a specificity of 64%. Component weight maps
Chapter 6 Prediction of pre-hallucinations patterns in schizophrenia patients
95
Figure 6.3: SPCA-TV principal components. Note that the sign is arbitrary
The components extracted with the SPCA-TV method were of great interest from a clinical point of view (see Figure 6.3). They revealed structured, interpretable patterns of variability within the different pre-hallucinations periods in our sample. Details regarding the clusters present in each principal component are provided in Table 6.5.
6.5
Discussion
Here, we wanted to automate the detection of specific functional patterns preceding hallucination occurrences in participants scanned at rest. First, using supervised analyses, we found evidence of prediction scores with a reliable level of significance. Our prediction of the emergence of hallucinations appeared to be accurate and yielded highly interpretable associated weight maps. Second, using unsupervised analysis, we characterized the variability of the
Clusters
1
1
2
3
1
1
2
PC
1
2
2
2
3
4
4
(1,-52,30)
(37,-23,26)
(-41,25,1)
(-1,48,25)
(56,-18,25)
(-52,-25,28)
(8,-28,27)
Center in MNI coordinates (x,y,z)
1,173
5,022
1,857
1,988
2,716
4,249
22,002
Cluster size
0.04
0.05
0.08
0.07
0.03
0.05
0.05
Cluster mean weight Precuneus Cortex, Posterior Cingulate Gyrus, Precentral Gyrus, Postcentral Gyrus, Superior Frontal Gyrus, Frontal Pole, Lingual Gyrus Postcentral Gyrus, Precentral Gyrus, Anterior and Posterior Supramarginal Gyrus, Angular Gyrus, Middle Frontal Gyrus, Superior Temporal Gyrus, Middle Temporal Gyrus Postcentral Gyrus, Precentral Gyrus, Anterior and Posterior Supramarginal Gyrus, Angular Gyrus, Superior Temporal Gyrus, Frontal Pole, Paracingulate Gyrus, Anterior Cingulate Gyrus Middle Frontal Gyrus, Frontal Pole, Inferior Frontal Gyrus, Frontal Operculum Cortex, Insular Cortex Precentral Gyrus, Postcentral Gyrus, Middle Frontal Gyrus, Insular Cortex, Superior Parietal Lobule, Angular Gyrus, Posterior Supramarginal Gyrus Precuneus Cortex, Posterior Cingulate Gyrus
Cortical regions involved
Table 6.5: SPCA-TV principal components. Note that the sign is arbitrary
Right and Left
Right
Left
Right and Left
Right
Left
Right and Left
Laterality
Chapter 6 Prediction of pre-hallucinations patterns in schizophrenia patients 96
Chapter 6 Prediction of pre-hallucinations patterns in schizophrenia patients
97
pre-hallucinations patterns across both occurrences and subjects in the form of intelligible components.
6.5.1
Supervised analysis
Decoding Performances The present findings indicated that the two classification algorithms were able to significantly detect the pre-hallucination patterns in brain activity at rest. Crucially, spatial regularization (TV) combined with the elastic net penalty significantly improved the prediction performances (increased AUC) and provided more balanced specificity and sensitivity. Indeed, traditional SVM naturally tends to allocate the off response, which subsequently leads to a good specificity but to a reduced detection rate (sensitivity) of patterns preceding the occurrence of hallucinations. The studied cohort contained patients who were suffering from complex multimodal hallucinations. Thus, the hallucinations captured during acquisition could have been very heterogeneous not only across subjects but also across occurrences. When evaluating each classifiers performance on the non-auditory hallucinations only, we obtained degraded prediction scores as opposed to the ones obtained with the patients experiencing auditory hallucinations, among other modalities. This finding is to be expected since the learning of the model is conducted on 37 subjects, of whom 32 exhibited auditory experiences. Therefore, our predictive model seemed to be more specific to the prediction of auditory hallucinations than any other modalities. Considering the above, the inter-subject decoding performance that was achieved should be considered reasonably satisfactory. Furthermore, a comparison to the seminal procedure used for labelling the scans [135] placed our result into perspective. Compared with the procedure that required the incorporation of information from post-fMRI interviews with patients into the labelling process, the proposed machine learning-based method is fully automatic, relying exclusively on the imaging data. Moreover, the learned model can be applied in real-time during data acquisition. Despite the challenge of gathering so many subjects in an fMRI hallucinations capture dataset (n = 37 subjects), we expect that increasing the sample-size may improve performances. We believe that our prediction model can still gain additional useful information from more data. Even if it is difficult to define a clear-cut line for clinical applications, an accuracy of 80% could be considered as acceptable for use in the scope of fMRI-based therapy for drug-resistant hallucinations, such as fMRI-based neurofeedback. The level of 80% stays an arbitrary threshold here, but it is considered satisfactory since detecting 4/5 hallucinations in a clinical setting is already promising. Predictive weight map interpretation The predictive maps obtained with the SVM method were dense and difficult to interpret without arbitrary thresholding. Even though the prediction performance was relatively good, a physician will never draw a conclusion from such a black-box model in a clinical setting as
Chapter 6 Prediction of pre-hallucinations patterns in schizophrenia patients
98
presented in Figure 6.2.A. Understanding the brain activation patterns that drive the prediction is crucial. In addition, the predictive map obtained with TV-Enet was considerably more interpretable given that it provided a smooth map composed of two clearly identifiable regions. Interestingly, these regions, especially the speech-related brain regions, were previously shown to be involved in hallucinations [149]. First, the two large, stable predictive fronto-temporal clusters appeared consistent with what we currently know of the networks involved in auditory hallucinations. Indeed, numerous studies have highlighted abnormal resting-state functional connectivity among some temporo-parietal, frontal and subcortical regions in patients with auditory hallucinations [129, 150]. Otherwise, patients experiencing auditory hallucinations while in the MRI scanner (in so-called fMRI capture studies) demonstrated significantly increased activation in Brocas area, the insula, left middle and superior temporal gyrus, left inferior parietal lobule and left hippocampal region [135]. Second, the right cluster identified in our study also emphasized the role of the right-sided homologues of the classical speech-related areas (i.e., the right inferior frontal gyrus, right superior temporal and supramarginal gyrus) in auditory hallucinations, as previously described in the literature. It has been hypothesized that activity in these regions, especially the insula and the right homologue of Brocas area, is associated with the occurrence of auditory hallucinations [130, 132], whereas language production in a natural context predominantly activates left-lateralized frontal and temporal language areas. The role of right-sided speech-related areas in the pathophysiology of auditory hallucinations was also mentioned by [151]. By neuromodulating a speech-related fronto-parietal network, these authors demonstrated that a reduction in the resting-state functional connectivity between the left temporo-parietal junction and right inferior frontal areas could be measured, and this reduction was associated with a significant reduction in the severity of the hallucinations. The high rate of auditory hallucinations in this sample may account for the speech-related regions identified in the predictive map. This explains the fact that these regions are crucial in the prediction process of pre-hallucinations patterns. Given that 32 of the 37 patients suffered from auditory hallucinations, among other modalities, it is not surprising that such regions previously associated with auditory-verbal hallucinations have been identified as highly predictive. Conversely, since the number of patients suffering from hallucinations in other modalities (visual, tactile and olfactory) is limited, their weights in the classifier appeared minimal compared to the predictive weights of the auditory hallucinations Consequently, this explained the degraded prediction performances obtained for the non-auditory hallucinations, as presented in Table 6.3. Classification algorithms may ideally benefit from modality-specific training on more restrictive datasets of patients hallucinating in just one sensory modality. However, even if this could be easily performed for voice-hearing, this appears quite challenging for other modalities. Taken together, these results confirm that adding a penalty to account for the spatial structure of the brain seems relevant in fMRI captures, given that it significantly improves the classifier performance and results in clinically interpretable weight maps.
Chapter 6 Prediction of pre-hallucinations patterns in schizophrenia patients
99
Here, we demonstrated that supervised classification methods can accurately predict the imminence of a hallucinatory episode. Thus, leveraging real-time pattern decoding capabilities and applying them in the case of hallucinations could lay the foundation for alternative solutions for affected patients in the near future, such as fMRI-based neurofeedback.
6.5.2 6.5.2.1
Unsupervised analysis Relevance of weight maps
Relevance of weight maps The total amount of explained variance was surprisingly low. Indeed, the activation maps of the resting-state fMRI data preceding hallucinations were very noisy, and only a minor part of its variability could be captured. However, when predicting the mental state of subjects based on the SPCA-TV scores, the decoding accuracy was significant. Naturally, the performance was decreased compared to the performance obtained in the supervised part of this paper, which was expected since we were losing some information from the compression of the 67,655 features into 4 scores. However, the fact that we could still significantly distinguish the prehallucination samples from the resting- state samples using those 4 component scores revealed that they made sense and were specifically related to hallucinations. Consequently, although the explained variance was low due to the resting- state nature of the data, the components were relevant and captured the cognitive processes involved in the onset of hallucinations. Weight map interpretation The variability in the pre-hallucination patterns across occurrences and subjects were represented in the form of intelligible components. The first PC mainly included the weights in the precuneus cortex and the posterior cingulate cortex. The posterior cingulate cortex, which is part of the DMN, is associated with auditory hallucinations [152]. We believe that this component may have captured the visual pathways typically involved in the occurrence of visual hallucinations. The second PC was composed of one activation cluster in the paracingulate gyrus and the anterior cingulate gyrus and two symmetric bilateral activation clusters in the temporal cortex. This fronto-temporal component appeared compatible with the processes at the roots of the auditory hallucinations. Interestingly, some processes involved in the occurrence of hallucinations, such as the monitoring of inner speech processes and error detection, are classical functions of the anterior cingulate cortex included in this component [129, 153]. This second PC yielded regions classically involved in inhibition (paracingulate gyrus, anterior cingulate gyrus) [129, 153]. The severity of auditory hallucinations has been found to be inversely related to the strength of the functional connectivity between the temporal-parietal junction, the anterior cingulate cortex (ACC) and the amygdala [154]. This ACC dysconnectivity supposedly drove the external misattribution observed during auditory hallucinations
Chapter 6 Prediction of pre-hallucinations patterns in schizophrenia patients
100
[153, 155], and might explain global inhibition impairments in the pathophysiology of hallucinations [156], which may account for this feature beyond the schizophrenia-spectrum, as for instance in LSD-induced hallucinations, for instance [157]. The third PC revealed a cluster in the frontal gyrus and the anterior insula. These regions are important for speech production, encompassing the well-known Brocas area and are involved in auditory hallucinations [130, 132]. Finally, the fourth PC included two clusters of opposing signs. In the right hemisphere, there was a large activation cluster that involved the temporo-parietal junction and a deactivation cluster that involved the precuneus cortex and the posterior cingulate gyrus. Interestingly, this PC revealed activation of the brain regions involved in auditory hallucination-related processes and in self-other distinction, such as the right temporo-parietal junction [135, 158, 159], together with a deactivation of key nodes of the DMN, including the posterior cingulate cortex, medial prefrontal cortex, medial temporal cortex and lateral parietal cortex [160]. Our results appeared fully compatible with recent fMRI-capture findings demonstrating that aberrant activations of speech-related areas concomitant with hallucinatory experiences follow complex interactions between ICNs, such as the DMN and the CEN [136]. A disengagement of the DMN during goal-directed behaviours has been seminally evidenced in the resting-state literature [136, 161], and similar mechanisms might be involved in hallucinatory occurrences [135, 144]. Such fluctuations in the ICNs are, thus, thought to be highly involved in the transition from a resting state to an active hallucinatory state.
6.5.3
Perspectives
In the present study, we chose to train a classifier to specifically detect periods preceding the occurrence of hallucinations (i.e., trans periods). As mentioned earlier, several studies have demonstrated that this period is potentially associated with specific brain activations [142] demonstrated reduced activity in the left parahippocampal gyrus, the left superior temporal gyrus (STG), the medial frontal gyrus and the right inferior frontal gyrus (IFG) prior to auditory hallucinations. A study by [162] also revealed increased activation in the right posterior temporal area compared with its right homologue during the same period. The specific patterns observed in the trans period probably corresponded to the triggering mechanisms of the auditory hallucinations, which may have a component in memory [149] and constitute a very interesting target for neurofeedback therapies. Real-time recognition of the trans period using the TV-Enet classifier could enable the delivery of visual information (i.e., visual feedback) regarding the imminent onset of hallucinations to the participant during a fMRI-NF session. Such a procedure could help the subject learn effective coping strategies to prevent the occurrence of hallucinations. Similarly, recent effective connectivity findings revealed that the extinction of auditory hallucinations (end periods) was associated with a takeover of the fronto-parietal CEN [136, 162]. This finding suggests that the termination of auditory hallucinations is a voluntary process that could benefit from, and be reinforced
Chapter 6 Prediction of pre-hallucinations patterns in schizophrenia patients
101
by fMRI-NF learning. We believe that such fMRI-NF based on the TV-Enet classifier could reduce the associated distress based on an improvement in the feelings of control and selfefficacy. One of the major limits of such fMRI-based therapies remains the accessibility and cost of the equipment. It appears fundamental to develop less complex devices as potential second-line treatments for hallucinations, such as near-infrared spectroscopy (NIRS). From this technological transfer perspective, the discriminative maps obtained using the TV-Enet classifier also appear advantageous, given that the identified clusters are cortical regions with activity that are easily measured with NIRS.
6.6
Conclusion
Because the hallucinations were frequently multimodal in the sample of patients recruited for this study, we expected more disparities in the functional patterns associated with their complex hallucinations and the transition towards this state compared with pure auditory experiences. In this context, the significant inter-subject decoding performances obtained appeared satisfactory and are promising for future fMRI-based therapy for drug-resistant hallucinations. We have successfully demonstrated the interest of using structured sparse machine learning tools on a clinical dataset of fMRI-recorded pre-hallucination patterns in a population of schizophrenia patients.
Chapter 7
Investigating the heterogeneity across the schizophrenia spectrum 7.1
Abstract
The pathophysiology of schizophrenia is difficult to understand: We know that it is highly heterogeneous but we are still unable to determine which are relevant subtypes. Such heterogeneity impedes an objective diagnosis of the disorder and the implementation of a targeted treatment. To challenge the view of a single neuroanatomical entity in the schizophrenia spectrum, we investigated whether patients can be stratified into homogenous subtypes based on their neuroanatomical profiles. We conducted a cluster analysis on the basis of neuroanatomical features (cortical thickness and subcortical volumes measurements) to stratify patients into subgroups and investigate differences in demographic, cognitive and symptomatic profiles between those subgroups. The population is constituted of 253 patients, collected at different sites, with chronic schizophrenia, 43 First Episode Psychosis patients (FEP) and 68 At Risk Mental State individuals (ARMS). The 253 schizophrenia patients fall into three anatomically distinct subgroups that have similar demographic characteristics. First, a ”preserved” subgroup composed of 107 patients shows a neuroanatomical profile that lie in the range of controls, together with relatively spared cognitive capacities and mild negative symptoms. Second, a ”deteriorated” subgroup of 86 patients revealed widespread cortical and subcortical atrophies, with impaired cognitive performances, and severe negative symptoms. Last, a third ”intermediate” subgroup of 60 patients presents severe cortical atrophies and normal-range subcortical volumes. Additionally, these patients suffer from cognitive deficits, however they have only mild negative symptoms. Furthermore, such stratification generalizes to FEP and ARMS patients. Using a neuroimaging unsupervised clustering approach, we demonstrated that distinct patterns of brain abnormalities exist in schizophrenia, with a subgroup of patients with large atrophies in subcortical areas revealing the most severe negative symptoms. Those differential patterns of the disorder may be independent from illness 103
Chapter 7 Investigating the heterogeneity across the schizophrenia spectrum
104
duration and/or medication since similar subgroups are found in patients at the beginning of the disorder. Our results strongly suggest that they may be associated with different pathophysiological mechanism. Understanding the heterogeneity of the disorder may pave the way toward a better characterization of the subgroups of patients and thus the implementation of a targeted treatment.
7.2
Introduction
Numerous studies have demonstrated a large panel of brain abnormalities in patients suffering from schizophrenia, even if a considerable between-studies heterogeneity exists in such structural changes. Subcortical atrophies are the most consistently reported finding in schizophrenia, specifically located in the medial temporal lobe (hippocampus and amygdala), and the thalamus [24, 35]. Widespread cortical thinning have also been reported [163, 164]. However, to date, these findings were unable to offer a trust-worthy level of reproducibility. One of the main obstacle to uncover the neuroanatomical correlates of schizophrenia might be the existence of various causes leading to an equifinal entity [165]. Indeed, schizophrenia is thought to be a very heterogeneous disorder, at the clinical, neurobiological and genetics levels [166]. The clinical manifestation of the disorder highly diverges across patients, from the age of onset to clinical symptoms, cognitive disabilities or prognosis. Such heterogeneity impedes the identification of stable markers for the disorder. Hence, no brain marker have been proven so far to have the sensitivity and specificity that is expected for a reliable diagnostic test. Most of the brain imaging studies conducted so far considered this disorder as a single clinical entity and compared heterogeneous schizophrenia patients gathered as a unique group with a population of healthy controls. This, ineluctably, reduced the statistical power to spot significant neuroanatomical deviations from controls. Recently, the use of unsupervised machine learning has become a method of choice to study the heterogeneity underlying brain disorders [167]. A large number of studies have attempted to identify subtypes of schizophrenia by stratifying patients suffering from this disorder into more coherent subgroups. One possible solution is to, first delineate schizophrenia subtypes based on clinical profiles. And second, evaluate the neuroanatomical differences across the subgroups. Recently, some studies adopted this strategy and attempted to investigate the neuroanatomical heterogeneity of the disorder by comparing subgroups of patients, with positive, negative and disorganized symptom dimensions [168–170], with presence or absence of cognitive deficit [171, 172] or based on IQ levels [173]. Such clustering strategies (based on clinical characteristics) however rely on a fundamental assumption: that subgroups have a common underlying pathophysiology [164]. But it stays difficult to fully exclude that patients might share similar symptomatic and/or cognitive profiles and at the same time exhibit distinct pathophysiological mechanisms. We think that clustering patients based on brain imaging data may provide opportunities to overcome some of the up-mentioned limitations. To date, very few studies have attempted to directly stratify schizophrenia using MRI data
Chapter 7 Investigating the heterogeneity across the schizophrenia spectrum
105
[164, 174–176]. A first example comes from [174] who used diffusion tensor analysis to distinguish two groups of patients: One subgroup of patients displayed widespread white matter abnormalities, while another subgroup showed only local abnormalities. Negative symptoms were more severe in patients with widespread white matter abnormalities. Very recently, [176] conducted a cluster analysis based on structural MRI to identify two differents subgroups of patients. One subgroup was associated with widespread brain atrophies. Another subgroup of patients was mainly characterized by severe atrophies in cortical areas, present significantly less negative symptoms and have a reduced illness duration. Those subgroups could result from two different trajectories of the disease or alternatively, be explained by the clinical staging model [177, 178]. Leveraging those studies, we intend here to further develop those empirical findings to disentangle these hypothesis. We took advantage of a multisite population of 253 patients scanned at 4 distinct sites with no prior coordination, to represent the wide, heterogenous spectrum of schizophrenia patients. We conducted a cluster analysis to stratify patients, into distinct homogeneous subgroups, based on neuroanatomical characteristics. We then evaluated differences in demographics, symptoms severity and cognitive performances across groups. Additionally, we assessed the relevance of stratifying schizophrenia patients by evaluating the diagnosis prediction on subgroups using a supervised analysis. Finally, in order to understand whether such brain differences are already present at the very beginning of the disorder, we replicated the exact same pipeline of clustering on two cohorts of patients still in an early stage of the disease: A population of patients suffering from first-episode psychosis (FEP), and a cohort of At Risk Mental State (ARMS) prodromal patients.
7.3
Methods
7.3.1
Participants
Brain imaging data from 4 independent studies with no prior coordination were gathered in the current analysis (http://schizconnect.org). The full dataset included 253 patients with strict schizophrenia, according to DSM-IV criteria, and 330 healthy controls. Two additional independent set of subjects were used for additional validation: 43 first-episode psychosis (FEP) patients and 68 At Risk Mental State (ARMS) prodromal individuals. Subjects provided informed consent to participate in their respective studies. Demographic details of all four datasets are summarized in Table 5.1. MRI acquisition protocols information are gathered in Table 5.2. Neuropsychological and symptoms severity data were available for a subset of 118 chronic schizophrenia patients. Subjects cognitive functions were evaluated using a battery of neuropsychological tests corresponding to broad domains of verbal IQ, working memory, episodic memory and executive functioning. The following cognitive domains were assessed: Crystallised Intelligence: Scaled score from the Vocabulary subtest of the Wechsler Adult Intelligence Scale (WAIS-III) Working Memory: Scaled scores
Chapter 7 Investigating the heterogeneity across the schizophrenia spectrum
106
from the Wechsler Memory Scale, third edition (WMS-III) on Digit Span and Spatial Span subtests. Episodic Memory: Scaled scores from the WMS-III Logical Memory and Family Picture subtests Executive Functions: Time to completion on the Trail Making Test Part B (TMTB), scaled scores on the WAIS-III Matrix Reasoning subtest, number of perseverative errors on the Wisconsin Card sorting Test. Those four cognitive domains have previously shown performance impairments in schizophrenia patients (Reichenberg 2010). Clinical data were evaluated through clinical rating of the symptoms dimensions: the Scale for the Assessment of Positive Symptoms (SAPS) and the Scale for the Assessment of Negative Symptoms (SANS).
7.3.2
MRI features extraction
All MRI scans were controlled and those with poor quality, motion or susceptibility artefacts, were rejected from subsequent analysis. Regions of interest (ROIs) measurements were obtained using Freesurfer, v6.1 (http://surfer.nmr.mgh.harvard.edu/). It automatically computes subject-specific volume estimation of subcortical regions and average thickness of cortical parcels. Both cortical and subcortical features were included in the clustering analysis, in order to cover different aspects of the brain abnormalities reported in schizophrenia. Subcortical features included the average volume of the left and right hippocampus, amygdala and thalamus. To filter out potential treatment effects on our clustering analysis, we decided not to include volume of striatal regions since those areas have been shown impacted by chronic antipsychotic medications [38, 39]. Regarding cortical features, we included the average cortical thickness for each of the four lobes: temporal, parietal, frontal and occipital lobes. These features were standardized into z-scores against the controls distribution. This pipeline was conducted to ensure that each variable has approximately the same influence on the clusters formation.
7.3.3
Cluster analysis
We performed a cluster analysis using K-means algorithm, implemented in sklearn package (http://scikit-learn.org). The cluster analysis was achieved using the neuroanatomical features previously described. It groups the patients into coherent clusters, such that every subject in a cluster is more similar to other subjects in the same cluster than in other clusters. The number of clusters selected was the one that yield the highest silhouette score. We tested k in range 2 to 20 and selected the optimum number of clusters. Additionally, we conducted a stability analysis to evaluate the reproducibility of the clusters yielded by the k-mean algorithm: We used a bootstrap resampling approach with 1000 iterations. The idea is to verify that the clusters holds up under plausible variation in the dataset. Each iteration, we draw a new dataset by subsampling the patients from the original dataset, with replacement. Then, for every cluster present in the original clustering scheme, we identified
Chapter 7 Investigating the heterogeneity across the schizophrenia spectrum
107
the most similar cluster in the new clustering. Finally, we evaluated the agreement of samples group between original clustering and new clustering. This procedure provided indications on the stability of the subgroups under variation of the samples.
7.3.4
Generalization
Then we evaluated whether the stratification rule derived from the large chronic patients population has the ability to generalize to population of patients that are still at an early stage of the disease. The objective is to understand if subgroups with similar neuroanatomical specificites, are already observable at the beginning of the disease. To do so, the exact same pipeline of clustering was conducted on the FEP patients and the ARMS patients. To quantify the subgroups similarities across the three independent cohorts of patients, we assessed an agreement score: For each patient we compared the cluster membership yielded by its own cohort stratification, to the cluster assigned by the stratification rule derived from chronic schizophrenia population. This provided us an objective measure of the generalization of the stratification scheme defined in chronic schizophrenia patients, to patients are the beginning of the disorder. To measure the significance of this agreement score against chancelevel, we leveraged an exact three-class test. (Chance level is 33%)
7.3.5
Statistical analysis
Following the neuroanatomical-based cluster analysis, we examined the group differences in terms of demography, neuroanatomy, cognitive performances and symptoms severity. Group differences were evaluated using Analysis of Variance (ANOVA) (for numerical variables) and chi-square test (for categorical variables), followed by post-hoc pairwise comparisons. Neuropsychological performances were then evaluated across four cognitive domains: Crystallized intelligence, executive functions, working memory and episodic memory. In addition, we also evaluated differences between groups in terms of symptoms severity assessed with the SAPS and SANS scales. We controlled multiple comparisons using the False Discovery Rate (FDR) approach [179], separately for cognitive tests and symptoms measures.
7.3.6
Supervised analysis
We then conducted a supervised analysis to predict diagnosis (schizophrenia or healthy control) based on the 7 selected MRI-based features. The goal was to assess the benefits of stratifying the schizophrenia patients into more homogeneous subgroups, prior to the classification process. We compare the prediction performance obtained on the full dataset (all schizophrenia patients versus all controls) to the prediction performance obtained on subgroups of
Chapter 7 Investigating the heterogeneity across the schizophrenia spectrum
108
schizophrenia versus all controls. Classification analyses were performed with linear Support Vector Machine (SVM), implemented in the scikit-learn python library. (http://scikitlearn.org). Performance was evaluated using a double 5x5 cross validation (CV) pipeline. The double cross-validation process consists of two nested cross-validation loops. In the five outer (external) loop, a set of subjects is considered as the training data, while the remaining subjects are held out and used as the test data. The test sets were exclusively used for model assessment while the train sets were used in inner five loops for model fitting and model selection. The C parameter of the SVM method was set internally in the nested 5-fold crossvalidation loop. To measure the significance of the prediction scores against chance-level, we used an exact binomial test.
7.4 7.4.1
Results Anatomical specificities of cluster
The 3 clusters solution appears to be the optimal number of clusters since it maximizes the silhouette score. All three clusters did not show any statistical differences in age, ratios of gender and ratios of site of origin (Table 7.1).
Chapter 7 Investigating the heterogeneity across the schizophrenia spectrum
109
Figure 7.1: Cluster analysis results on Chronic schizophrenia patients, First episode psychosis patients and At Risk Mental State individuals
The anatomical specificities of the three clusters are illustrated Figure 7.1. A first group of 86 patients (34%) appears highly atrophied in all subcortical and cortical regions, compared to controls (p < 1e−15 ). We qualified this subgroup as the anatomically deteriorated subgroup. A second group of 60 patients (24%), displays severe atrophies at the cortical level compared to controls (p < 1e−13 ). However, those patients lie in the range of controls regarding subcortical features. We named it the cortical atrophies subgroup. Last, a third group of 107 patients (42%), that are anatomically very close to the control population range in term of neuroanatomy, considered preserved. The stability analysis carried out with the bootstrap pipeline reveals a good reproducibility of clusters across resampling of subjects. Indeed, across iterations, the bootstrap analysis demonstrated a mean agreement of 91%. Therefore, the strength of the clustering patterns seems to be robust and holds up across resampling. It is significantly better than random assignation into clusters.
Chapter 7 Investigating the heterogeneity across the schizophrenia spectrum
7.4.2
110
Generalization
Additionally, the clustering analysis conducted on the subjects still in an early stage of the disease yield similar subgroups (Figure 7.1): Both FEP and ARMS cohorts can be separated into three subgroups, that reproduce well the neuroanatomical specificities of the subgroups derived in chronic schizophrenia patients. The agreement rate obtained between FEP population-specific stratification rule, and the chronic schizophrenia stratification rule is 56%. Concerning the ARMS cohort, the agreement rate is 72%. Those results are significantly better than random assignation, that would be 33.33% in such a three cases problem. It seems that the stratification scheme defined in chronic schizophrenia patients generalize well to the subtyping of early-stages individuals.
7.4.3
Clinical specificity of clusters
Regarding cognitive performances, controls perform significantly better than patients in all domains tested (p < 4.5e−11 ). More insightful, preserved patients perform significantly better than both deteriorated and cortical patients in terms of crystallized intelligence and working memory (Table 7.1 and Figure 7.2), with the noticeable exception of episodic memory and executive functions. Deteriorated and cortical groups were equally impaired on the four cognitive domains evaluated.
Demographics Age Gender Site Symptoms SAPS SANS Crystallized Intelligence WAIS vocabulary Working memory WMS Digit Span WMS Spatial Span Episodic memory WMS Logical Memory WMS Family Picture Executive Functions WAIS Matrix Reasoning Trails B time WCST perseverative errors
Measure
35.0 ±11.2 36/24 13/10/29/8 5.6 ±3.4 7.4 ±3.9 7.7 ±3.3 7.7 ±2.1 6.0 ±3.4 6.0 ±3.4 5.9 ±2.2 8.6 ±3.3 143 ±82 26 ±17
5.4 ±4.1 10.7 ±4.6 6.4 ±3.3 7.6 ±3.3 5.9 ±3.4 5.8 ±2.9 6.6 ±3.2 7.9 ±3.3 137 ±71 27 ±21
Cortical atrophies (n = 60)
33.98 ±12.3 61/25 21/11/42/12
Deteriorated (n = 86)
10 ±3.2 116 ±62 20 ±12
6.4 ±3.1 6.9 ±3.2
9.0 ±2.8 8.1 ±2.5
9.8 ±3.2
4.6 ±3.6 7.9 ±4.1
34.9 ±12.8 82/25 35/15/45/12
Preserved (n = 107)
Subgroups defined by cluster analysis
4.64 0.90 3.11
1.61 1.54
3.43 5.74
8.82
0.70 6.26
0.18 5.14 3.38
F
0.02 0.41 0.06
0.24 0.24
0.90 0.39 4.55
0.75 1.57
7.43 10.7
7.20
2.1e−3 0.05 0.01
1.26 0.29
0.32 2.63 2.89
T
0.44 0.53 0.06
0.44 0.33
0.02 0.01
0.02
0.52 0.59
0.75 0.10 0.41
p-value
Preserved vs Deteriorated+cortical
0.49 4e−3
0.83 0.07 0.76
p-value
ANOVA /χ2 3 subgroups
2.63 0.27 0.01
0.36 0.03
1.58 2.96
0.84
0.03 9.15
-0.53 1.45 0.49
T
0.44 0.81 0.90
0.81 0.90
0.56 0.44
0.72
0.85 6e−3
0.59 0.23 0.92
p-value
Deteriorated vs cortical
Table 7.1: Empirical subgroup characteristics: Demographics, Symptoms and Cognitive measures . Cognitive and Symptoms severity tests p-values were corrected for multiple comparisons, using the FDR method.
Chapter 7 Investigating the heterogeneity across the schizophrenia spectrum 111
Chapter 7 Investigating the heterogeneity across the schizophrenia spectrum
112
Figure 7.2: Cognitive profile of the 3 subgroups. Trails B time and WCST perseverative errors: Higher scores means worse performance
Regarding symptoms severity, no significant group-differences were found in the amount of positive symptoms. However, we did find differences in negative symptoms severity across subgroups. Indeed, deteriorated patients display significantly more negative symptoms than cortical patients (Table 7.1).
7.4.4
Supervised analysis
Prediction of clinical status based on the MRI-based features yield significant, almost limited, accuracy (AUC = 0.73) when using all schizophrenia patients and controls. (Table 7.2) Stratifying patients into more homogeneous subgroups, prior to the supervised analysis yields insightful results by drastically increasing prediction performances when distinguishing controls from deteriorated patients (AUC = 0.94) and controls from cortical patients (AUC = 0.91). Preserved patients were more hardly distinguishable from the controls (AUC = 0.57).
Chapter 7 Investigating the heterogeneity across the schizophrenia spectrum
113
Table 7.2: Prediction performance of clinical status based on MRI-based features. SCZ: Schizophrenia; HC: healthy controls
7.5
AUC
Acc
Spe
Sen
All SCZ vs HC
0.73
0.67
0.66
0.67
Deteriorated SCZ vs HC
0.94
0.81
0.65
0.99
Cortical atrophies SCZ vs HC
0.91
0.80
0.61
1.0
Preserved SCZ vs HC
0.57
0.56
0.51
0.62
Discussion
So far, the highly diverse forms schizophrenia can take and the late-onset of cognitive and clinical symptoms have hindered the establishment of a consistent etiology for this disorder. Using a brain imaging unsupervised approach, we intended to challenge the view of a single disease entity in schizophrenia. Each schizophrenia patient from the population under study falls into one of three anatomically distinct subgroups, despite similar demographic characteristics: a preserved subgroup of 107 patients, a deteriorated subgroup of 86 patients and a cortical subgroup of 60 patients. Bootstrap-based analysis demonstrated the stability and reproducibility of the proposed clustering across resampling. This finding provides strong evidence that schizophrenia patients can be categorized into relevant subtypes based on their neuroanatomical profile. Moreover, we evidenced differences in symptoms severity, and cognitive deficits across the three neuroanatomically derived subtypes of schizophrenia. Such results support our hypothesis that there are distinct pathophysiological processes underpinning the subgroups condition. The preserved subgroup is anatomically close to controls. Both subcortical volumes and cortical thickness of those patients lie in the range of control subjects. Moreover, patients in this preserved group performed statistically significantly better than other patients in term of crystallized intelligence and working memory. Therefore, It seems that normal range brain structure is associated with relatively spared cognitive capabilities. Those findings are consistent with results largely reported in the literature, that is, a non-negligible proportion of schizophrenia patients are characterized by a relatively spared cognition [171, 180, 181]. Those patients remain impaired in terms of cognitive profile relative to controls, but are significantly healthier than other patients [182]. The deteriorated group revealed prominent subcortical and cortical atrophies. Atrophies of the hippocampus amygdala and thalamus have been widely reported in the literature [26, 124, 125] and specifically in a recent large scale study from the ENIGMA consortium [35]. Additionally, many studies have also evidenced widespread cortical thinning in schizophrenia patients [163, 183]. Those patients display severe cognitive deficits compared to the
Chapter 7 Investigating the heterogeneity across the schizophrenia spectrum
114
preserved patients. The existence of a deteriorated subgroup of schizophrenia patients, presenting widespread brain atrophies together with severe cognitive impairments is consistent with previous studies [172, 173, 176, 184]. Additionally, patients within this group exhibit greater amount of negative symptoms than cortical or preserved patients. Severity of negative symptoms have already been reported to be associated with amount of brain atrophies in schizophrenia patients [77, 176, 185, 186]. The cortical group revealed a prominent cortical thinning. Surprisingly, subcortical volumes of those patients lie in the range of normal controls values. Those patients present severe cognitive deficits compared to the preserved subgroup. However, they are spared in terms of negative symptoms. Their amount of negative symptoms is comparable with the amount seen in preserved patients. This finding replicates the recent results of [176], that is, a specific group of patients, mainly characterized by cortical atrophies, are relatively spared in term of negative symptoms severity. Therefore, It seems that negative symptoms are related to specific deficits in subcortical areas, notably involving the hippocampus, amygdala and thalamus. We did not find any significant differences in cognitive profiles between deteriorated and cortical patients. Both groups of patients share similar cognitive impairments despite exhibiting different neuroanatomical disease signatures. Such findings supports a modern neuroscience view of cognitive functions that are supported by networks, instead of isolated hyper specialized brain modules. Again, this finding highlights the relevance of stratifying patients based on neuroanatomy. Indeed, it can be argued that studies stratifying patients on the basis of cognitive profile [170, 173], suffer from a reduced sensibility to detect group-specific structural brain pattern, since patients within a single group might result from diverse neuroanatomical signatures. The existence of the ”preserved” and ”deteriorated” subgroups of patients is compatible with the hypothesis of a schizophrenia severity spectrum. Those patients would constitute the two extremes along this spectrum. However, the existence of a third group, characterized by cortical atrophies, challenges this view. Moreover, those three subgroups have been shown to be present even in early-stages populations. Indeed, we successfully replicated the existence of those three specific subgroups in both ARMS and FEP population. Overall, these clustering results conclusively disprove the seminal hypothesis of a unique neuroanatomical abnormalities profile in schizophrenia, with a continuum along which individual patients can be placed. Moreover, these subgroups might result from differential disease trajectories driven by genetic and/or external variables. Indeed, the fact than those specific subgroups are already present at very early stages of the disease might be an indication that such neuroanatomical divergence between patients is not due to time of illness or medication impacts. So far, despite initial promising results, the impact of computer-aided diagnosis based on brain markers, has been limited. Indeed, the identification of schizophrenia-specific features is limited by the anatomical heterogeneity of the disease. The current study have shown that
Chapter 7 Investigating the heterogeneity across the schizophrenia spectrum
115
prior stratification of patients into subgroups, drastically improves the accuracy of individualized diagnosis. Such a result is promising in the scope of translational implementation of computer-assisted diagnosis in psychiatry. However, the preserved group of patients is arduous to predict, because those patients are very similar to controls in terms of neuroanatomy. Limitations and futur work We need to acknowledge some limitations. First, we conducted the clustering on a large database composed of patients scanned at four different sites. Using multisite data allowed to gather as many samples as possible to obtain a wide overview of the schizophrenia spectrum. The impact of scanning sites on the features might influence the identification of subgroups. However, to filter-out those unwanted artifacts, we statistically controlled the features for the effect of site. Moreover, Freesurfer ROIs measurements has been shown to be relatively robust to inter-site variations [187]. Furthermore, the 3 groups do not show significant differences in ratio of patients from each site. All together, we are pretty confident, that the impact of scanning site did not contaminated too much our clustering analysis. Second, the stratification can be further improved by adding more features to the clustering analysis. Indeed, in the current study, we restricted the analysis to simple features, mapping subcortical volume and cortical thickness. However, the incorporation of other brain characteristics could be used to better define subgroups of patients. For example, the inclusion of white-matter features could provide complementary information [171, 174]. Third, it would be interesting to investigate the longitudinal behavior of the three subgroups. Here, we only have cross sectional data, that only evaluate the patient at one point in time. It would be interesting to investigate the trajectories dynamics across time and groups.
7.6
Conclusion
Overall, this present study disproved the idea that there is one single neuroanatomical entity in schizophrenia, with a continuum along which individual patients can be placed. Rather, we demonstrated, in a relatively large multisite sample, that distinct subgroups of patients, displaying differential brain atrophies, exist and subsequently reveal distinct cognitive and symptomatic profiles. Moreover, this stratification have shown to be generalizable to earlystages patients.
Conclusion Contributions Throughout this thesis, we have developed interpretable machine learning algorithms that can capture complex relationships in various neuroimaging datasets. In a clinical perspective, besides the predictive performance itself, the predictive markers are also very important. Given the limitations of state-of-the-art sparse algorithms to produce stable and interpretable predictive signatures, we have pushed forward the regularization approaches by extending classical algorithms. The incorporation of structural constraints, with the T V penalty, forces the solution to adhere to biological priors, producing more plausible and interpretable solutions. Such structured penalty was shown to be highly relevant when incorporated in a supervised classification scheme and in an unsupervised PCA problem. We demonstrated the performance, interpretability and versatility of those algorithms on both sMRI and fMRI datasets of patients with schizophrenia. On the one hand, we highlighted the existence of a neuroanatomical signature, across sites and stages, shared by a majority of patients with schizophrenia disorder and independent of medication impacts on the brain. On the other hand, we have identified an interpretable functional predictive signature (clusters in speechrelated brain regions) of the upcoming hallucinations in patients with schizophrenia, offering perspectives of rehabilitation using neuro-feedback approaches. However, despite initial promising results, progress in machine-learning and MRI-based diagnosis has not yet been converted into new clinical applications and significant challenges still need to be tackled for translational implementation of such findings in psychiatry.
Limitations • Early Diagnosis: Applications of diagnosis based on MRI are currently limited to existing, case-control cross-sectional, studies that were retrospectively explored to evaluate the capacity of ML algorithms to predict the clinical status. From a clinical perspective,
117
Conclusion
118
those predictions have limited interest. Indeed, the true value of MRI-based prediction lies in the early diagnosis. Accurately predicting chronic schizophrenia patients affected by the disease for a long time does not provide ground-breaking insight. Instead, what is clinically relevant is the identification of patients who are still at an early stage of the disease. Early detection of schizophrenia is crucial. Indeed, it allows early intervention methods and we know that providing early care to reduce the duration of untreated psychosis has been identified as a predictor of long-term outcome in schizophrenia. Therefore, being able to spot patients that are still in an early stage of the disorder is essential. We have shown that a relatively good prediction performance can be obtained on first episode psychosis patients (70%). • Heterogeneity of the disorder: Schizophrenia is thought to be a very heterogeneous disorder, at the clinical, neurobiological and genetics levels. The clinical manifestation of the disorder highly diverges across patients, from the age of onset to clinical symptoms, cognitive disabilities or prognosis. We have seen in this thesis that such heterogeneity impedes the identification of stable markers of the disorder. Hence, no brain markers have been proven so far to have the sensitivity and specificity that is expected for a reliable diagnostic test. Further, treating patients in a personalized medicine framework requires the identification of homogeneous, neurobiologically based subtypes of schizophrenia (See Figure 7.3). The exploratory study conducted in Chapter 7 clearly highlights the existence of subtypes of schizophrenia disorder. It would be interesting to reproduce such stratification in others cohorts of patients with schizophrenia. Within these subgroups, associations with genetic mutation are more likely to be discovered and targeted treatments are more likely to be efficient. Deciphering schizophrenia into more homogeneous subtypes is therefore a major challenge, and may help to the development of personalized medicine.
Figure 7.3: Stratification of population into homogeneous subgroups
• Transdiagnostic studies: We demonstrated in this thesis that it is possible to significantly discriminate schizophrenia patients from controls, using structural MRI. At this stage, this does not imply that such models are able to distinguish patients with various psychiatric conditions. In order to demonstrate the clinical relevance of predictive models such as the one developed in this study, the next step would be to evaluate
Conclusion
119
the specificity of the classifiers in differential diagnosis situations. There is now an urgent need for transdiagnostic studies able to compare the specificity of the identified neuroanatomical predictive signature in schizophrenia but also in bipolar disorder or autism spectrum disorder.
Perspectives Transfer of knowledge Psychiatric disorders are currently defined into categories based on behavioral and clinical symptoms outlined in the DSM. Designed as a diagnostic tool, the DSM considers different disorders as distinct entities. However, boundaries between disorders are often not as strict as the DSM suggests. To provide an alternative framework for research into psychiatric disorders, the US National Institute of Mental Health has recently introduced the Research Domain Criteria (RDoC) project. In the RDoC, several domains reflect a different brain system in which functioning is impaired, to different degrees, in different psychiatric conditions. The RDoC methodology distinguishes itself from traditional systems of diagnostic criteria. Unlike conventional diagnostic systems, such as the DSM which uses categorization, RDoc is a ”dimensional system” that relies on dimensions that span the range from normal to abnormal. The major RDoC research constructs include : Negative Valence Systems, Positive Valence Systems, Cognitive Systems, Systems for Social Processes and Arousal/Modulatory Systems. Such dimensional analysis strategy can be conducted on large heterogenous cohorts, that are not focused on one specific pathology, but rather include a wide range of patient suffering from various pathologies. The recent emergence of large transdiagnostic cohorts (> 104 subjects) such as: the Healthy Brain Network (HBN), UK Biobank, EU-IMAGEN, Human Connectome Project (HCP)) raises questions as to whether such large datasets can be leveraged to learn relevant knowledge which can be transferred to smaller and clinically focused cohorts. The transfer of knowledge from large transdiagnostic cohorts to specific psychiatric cohorts would be an interesting perspective to identify brain signatures of mental illness.
Toward Deep Learning While conventional machine learning classifiers, such as SVM or Logistic Regression, remain very popular approaches within the neuroimaging community, an alternative family of Machine Learning methods, known as deep learning (DL) is gaining considerable attention in the scientific community. Deep Learning approaches differ from regular machine learning approaches by their ability to learn the optimal representation of a dataset through hierarchical, consecutive nonlinear transformations, achieving increasingly higher levels of abstraction and
Conclusion
120
complexity. The building blocks of DL neural networks are inspired by how the human brain processes information and are organized in layers. A deep neural network typically consists of an input layer, two or more hidden layers and an output layer. The input layer contains the raw data, such as the voxels intensities of images; the hidden layers learn and store increasingly more abstract representations of the data; these features are then transmitted to the output layer that assigns the observations to classes (such as controls or patients in case of binary prediction of clinical status). Learning of the model is completed using an iterative process of adjustment of the weights of the network. The main difference between DL approaches and conventional machine learning methods is the fact that the features are not manually engineered before being fed to the classifier in DL. They are directly learnt by the neural network. Given its ability to detect hidden complex patterns, very recently, deep learning has been applied in neuroimaging studies of psychiatric disorders, such as schizophrenia. Indeed, since high-level features can be more robust against noise, deep architectures may be more convenient to identify diagnostic and prognostic biomarkers than conventional ML methods. Specifically, over the past years, Convolutional neural network (CNN) have been shown to be particularity successful in the field of computer vision (Figure 7.4).
Figure 7.4: Generic structure of a CNN
So far, to the best of our knowledge, only one study [188] has applied a deep learning approach in the specific case of schizophrenia diagnosis based on sMRI data. Using structural MRI data from four independent studies, [188] applied a deep model to the original preprocessed images obtaining an impressive F-score of 91%. This study suggests that DL can effectively classify schizophrenia patients on the basis of neuroanatomical information. However, the risk of overfitting is high when using extremely complex models, in the specific
Conclusion
121
case of neuroimaging dataset, where the number of features highly exceeds the number of samples. Moreover, DL is a very flexible approach, where is it possible to combine different architectures and hyperparameters within the same model. Finding the right architecture of a model is extremely painful. Although deep neural networks seem to provide superior performances in pattern recognition, their interpretability is their Achille’s heel. Currently, it is thought that deep learning methods reach high discrimination accuracy at the cost of low interpretability of their black-box representations. In a clinical perspective, not providing objective neuroanatomical markers to justify the decision, is particularly undesirable. Since the goal of this thesis was to focus on the interpretability of predictive models, we have preferred focusing on linear machine learning methods, that are more interpretable. However, new methodological advances are currently being developed on the interpretability of such model. Therefore the success and the interpretability of deep learning approach in neuroimaging-based diagnosis of schizophrenia remain to be elucidated in future work.
Closing remarks The ability of MRI to be a diagnosis tool remains under question, particularly because of the small size of the datasets. This thesis paves the way toward analysis on large heterogeneous datasets. We show that prediction is doable in a clinical setting. Although the intersite prediction accuracy (70%) is not sufficient to perform individual diagnosis, we have highlighted the existence of a neuroanatomical signature of schizophrenia, shared across sites and stages of the disease. These results open a wide perspective for the future: with the technological breakthrough in acquisition methods, the availability of datasets of growing size and the stratification of schizophrenia into more homogeneous subgroup, MRI may become a cornerstone for clinical use.
Summary in French Introduction La schizophr´enie est un trouble mental chronique caract´eris´e par une vari´et´e de symptˆomes tels que des hallucinations, des ´episodes d´elirant ainsi que des d´eficiences dans les fonctions cognitives. Le d´eveloppement de l’imagerie par r´esonance magn´etique (IRM) fournit une approche efficace et non invasive pour ´etudier le cerveau. Plus pr´ecis´ement, l’IRM structurelle (IRMs) permet l’´etude des changements anatomiques dans le cerveau et leur relation avec le diagnostic clinique. Au fil des ans, l’IRMs a ´et´e de plus en plus utilis´ee pour mieux comprendre les anomalies structurelles inh´erentes au trouble et pour identifier les r´egions du cerveau o` u les patients atteints de schizophr´enie diff`erent significativement des controles. Malheureusement, les approches d’analyses univari´ees peuvent difficilement d´etecter des r´eseaux subtils et diffus de d´eficites neuroanatomiques `a travers le cerveau et se limitent `a faire des inf´erences au niveau du groupe. Ces approches ne peuvent donc pas ˆetre utilis´ees pour aider au diagnostic. Pour aborder les limites de l’analyse de groupe, la communaut´e de neuroimagerie s’est r´ecemment tourn´ee vers des approches d’apprentissage automatique, dites ”machine learning”. Ces m´ethodes sont particuli`erement attrayantes car elles permettent d’explorer conjointement les caract´eristiques du cerveau pour d´etecter des motifs (patterns) et faire des inf´erences au niveau d’un seul individu. Les progr`es r´ecents dans l’apprentissage automatique et l’apparition de grandes bases de donn´ees disponibles publiquement ouvrent maintenant la voie vers la d´etection automatique des caract´eristiques sp´ecifiques `a la schizophr´enie, uniquement bas´ee sur les donn´ees acquis en IRM. Cependant, malgr´e des r´esultats initialement tr`es prometteurs, ces progr`es n’ont pas encore ´et´e convertis en de nouvelles applications cliniques. Certains d´efis significatifs doivent encore ˆetre abord´es pour utiliser ces r´esultats en psychiatrie. Premi`erement, dans un contexte d’identification de signatures pr´edictives d’une maladie, il est crucial de comprendre les mod`eles du cerveau sous-jacent `a une pr´ediction. Malheureusement, dans la plupart des cas, malgr´e des performances de pr´ediction relativement pr´ecises, les mod`eles de classification se comportent toujours comme des mod`eles ”boˆıte noire”, ne fournissant pas de marqueurs objectifs dans le cerveau, ce qui exclut la possibilit´e 123
Summary in French
124
d’applications cliniques. Deuxi`emement, la schizophr´enie est un trouble tr`es h´et´erog`ene qui empˆeche un diagnostic objectif de celui-ci et la mise en place d’un traitement cibl´e.
Vers des mod` eles interpretables Pour surmonter ces difficult´es, nous avons d’abord d´evelopp´e des algorithmes d’apprentissage automatique stables et interpr´etables qui peuvent capturer des relations complexes dans divers ensembles de donn´ees de neuro-imagerie. Les approches d’apprentissage automatique sont des outils pratiques pour identifier les marqueurs pr´edictifs d’une maladie c´er´ebrale. Dans le cas des mod`eles lin´eaires, les param`etres estim´es forment une carte spatiale dans le domaine de l’image. Cependant, la minimisation d’une erreur de pr´ediction donne peu de contrˆole sur les d´etails fins des cartes correspondantes. Malheureusement, dans la plupart des cas, malgr´e des performances de pr´ediction pr´ecises, les mod`eles de classification se comportent toujours comme un mod`ele de boˆıte noire. En effet, la plupart des mod`eles predictifs, tels que le SVM (Machine `a Vecteur de Support), produisent des mod`eles denses de pr´edicteurs difficiles `a interpr´eter. Bien que certaines m´ethodes existent pour d´efinir des seuils permettant de d´ecouvrir des r´egions du cerveau qui contribuent de mani`ere significative au processus de classification, elles ne produisent pas de cartes de poids interpr´etables en soi et ne fournissent pas de marqueurs neuroanatomiques objectifs sur lesquels la d´ecision est prise. Pourtant, il est essentiel que la m´ethode fournisse des mod`eles pr´edictifs significatifs afin de r´ev´eler les biomarqueurs de neuro-imagerie des pathologies. Dans le contexte de la d´ecouverte de signatures pr´edictives, il est crucial de comprendre les structures du cerveau qui sous-tendent la pr´ediction. Cette absence d’interpr´etabilit´e de la d´ecision exclut la possibilit´e d’une application clinique. Etant donn´e les limites des algorithmes parcimonieux `a produire de telles signatures pr´edictives, nous avons propos´e d’am´eliorer ces approches de r´egularisation en ´etendant les algorithmes classiques. L’incorporation de contraintes structurelles, avec la p´enalit´e ”Variation Totale”, dit TV, oblige la solution ` a adh´erer `a des hypoth`eses biologiques, produisant des solutions plausibles et plus interpr´etables d’un point de vue clinique. La p´enalit´e structur´ee peut ˆetre int´egr´ee `a la fois dans un syst`eme de classification supervis´e (Enet-TV) et dans un probl`eme non supervis´e d’analyse en composante principale (PCA-TV). Nous avons d´emontr´e la performance, l’interpr´etabilit´e et la polyvalence d’Enet-TV et de PCA-TV sur des ensembles de donn´ees IRM et IRMf de patients atteints de schizophr´enie.
Une signature anatomique de la schizoph´ enie Au fil des ann´ees, l’IRM anatomique a ´et´e de plus en plus utilis´ee pour mieux comprendre les anomalies inh´erentes ` a la schizophr´enie. Les applications de pr´ediction de la maladie
Summary in French
125
reposant sur l’apprentissage automatique sugg`erent que la classification individuelle est `a la fois faisable et fiable. Cependant, la plupart des ´etudes se concentrent avant tout sur la performance de pr´ediction du statut clinique, limit´ee en termes de perspectives biologiques. En effet, les algorithmes conventionels ne parviennent pas `a identifier une signature pr´edictive interpr´etable de la pathologie dans le cerveau. De plus, toutes les ´etudes, sauf une, d´ependent de tailles de cohorte relativement petites ou d’un seul site de recrutement. Enfin, aucune ´etude ne contrˆ ole l’impact potentiel du stade d’avancement de la maladie ou l’effet des m´edicaments. Toutes les preuves ci-dessus mettent en doute la reproductibilit´e des r´esultats pr´ec´edents. Tout d’abord, sur la base de l’IRM structurelle, nous avons propos´e un algorithme d’apprentissage automatique, avec r´egularisation de parsimonie structur´ee, dont le but est de fournir une signature c´er´ebrale interpr´etable (Figure 7.6). Deuxi`emement, en utilisant une large base de donn´ees recueillies `a partir de 4 sites internationaux (606 images IRM recueillies sur 276 patients schizophr`enes et 330 t´emoins sains appari´es), nous avons ´evalu´e la reproductibilit´e du mod`ele predictif `a travers les sites et la signature pr´edictive associ´ee. Troisi`emement, pour la premi`ere fois, nous avons ´evalu´e l’independance de la signature pr´edictive concernant les m´edicaments et la dur´ee de la maladie en utilisant un ensemble de donn´ees ind´ependantes des patients, au tout d´ebut de la maladie, dit ”premier ´episode”. Les mod`eles pr´edictifs produisent une pr´ecision de pr´ediction inter-site significative (jusqu’` a 72%) ainsi qu’une excellente stabilit´e de la signature pr´edictive associ´ee. Cette signature fournit un score cerebral qui est significativement corr´el´e avec la s´ev´erit´e des symptˆomes et l’´etendue des d´eficits cognitifs. De plus, cette signature d´emontre son efficacit´e chez les patients pr´esentant un premier ´episode de psychose (pr´ecision de la pr´ediction de 73%). Ces r´esultats soulignent l’existence et la pertinence d’une signature neuroanatomique commune pour la schizophr´enie, partag´ee par une majorit´e de patients (75%) mˆeme `a un stade pr´ecoce de la maladie. En revanche, le reste des patients (25%) ne pr´esentent pas de telles anomalies c´er´ebrales, ce qui remet directement en question la n´ecessit´e d’une stratification des patients
TV-Enet
souffrant de schizophr´enie en sous-groupes plus homog`enes.
Figure 7.5: Signature pr´edictive de la schizophr´enie obtenue `a l’aide d’un algorithme d’apprentissage automatique, avec r´egularisation de parsimonie structur´ee
Summary in French
126
Une signature fonctionelle de l’hallucination Malgr´e des progr`es significatifs dans ce domaine, la d´etection des modifications du signal d’IRM fonctionelle au cours de p´eriodes d’hallucinations reste longue et difficile. Ainsi, nous avons d’abord propos´e un algorithme d’apprentissage automatique pour identifier les p´eriodes d’IRMf, collect´ees au repos, qui pr´ec`edent les hallucinations. Lorsqu’elles sont appliqu´ees ` a des donn´ees d’IRMf de cerveau entier, les m´ethodes de classification `a la pointe, telles que les machines ` a vecteurs de support (SVM), fournissent des solutions denses qui sont difficiles `a interpr´eter. Nous avons propos´e d’´etendre les m´ethodes existantes de classification parcimonieuse en prenant en compte la structure spatiale des images c´er´ebrales et la parcimonie structur´ee en utilisant la p´enalit´e de variation totale (TV). Sur la base de cette approche, nous avons obtenu des performances de classification fiables associ´ees `a des mod`eles pr´edictifs interpr´etables, compos´es de deux clusters clairement identifiables dans des r´egions c´er´ebrales li´ees `a la parole (Figure 7.6). La variabilit´e des mod`eles fonctionnels de transition vers l’hallucination, non seulement d’un patient `a l’autre, mais aussi d’une occurrence `a la suivante (par exemple, en fonction des modalit´es sensorielles impliqu´ees) semble ˆetre la difficult´e majeure lors du d´eveloppement de mod`eles pr´edictif efficaces. Par cons´equent, en second lieu, nous avons caracteris´e la variabilit´e au sein des mod`eles de pr´e-hallucination en utilisant une extension de l’analyse en composantes principales avec des contraintes spatiales. Les composantes principales (PC) identifient les structures intrins`eques de la variabilit´e pr´esente dans l’ensemble de donn´ees. De tels r´esultats sont prometteurs dans le cadre d’une th´erapie innovante pour les hallucinations pharmacor´esistantes, telles que le neurofeedback bas´e sur l’IRMf.
Figure 7.6: Signature de la transition vers l’hallucinations. A: SVM et B:Enet-TV
Summary in French
127
Stratification de la schizophr´ enie La physiopathologie de la schizophr´enie est difficile `a comprendre parce qu’elle est tr`es h´et´erog`ene. Une telle h´et´erog´en´eit´e empˆeche un diagnostic objectif du trouble et la mise en place d’un traitement cibl´e. Pour mieux comprendre l’h´et´erog´en´eit´e de la schizophr´enie et comment elle limite la performance du diagnostic, nous avons effectu´e une analyse de stratification bas´ee sur les donn´ees d’IRMs pour s´eparer une grande population multi-site de patients schizophr`enes en sous groupe plus homog`enes. Nous avons effectu´e une analyse en clusters sur la base de caract´eristiques neuroanatomiques (´epaisseur corticale et mesures de volumes sous-corticaux) pour stratifier les patients en sous-groupes et ´etudier les diff´erences de profils d´emographiques, cognitifs et symptomatiques entre ces sous-groupes (Figure 7.7). La population d’etude est constitu´ee de 253 patients atteints de schizophr´enie chronique, de 43 patients premiers episodes psychotiques (FEP) et de 68 avec un ´etat mental `a risque (ARMS). Les 253 patients atteints de schizophr´enie appartiennent `a trois sous-groupes anatomiquement distincts ayant des caract´eristiques d´emographiques similaires. Tout d’abord, un sousgroupe pr´eserv´e compos´e de 107 patients montre un profil neuroanatomique qui se situe dans la gamme des contrˆ oles, ainsi que des capacit´es cognitives relativement ´epargn´ees et des symptˆ omes n´egatifs l´egers. Deuxi`emement, un sous-groupe de 86 patients ayant subi une d´et´erioration a r´ev´el´e des atrophies corticales et sous-corticales ´etendues, avec des performances cognitives alt´er´ees, et des symptˆomes n´egatifs s´ev`eres. Enfin, un troisi`eme sousgroupe interm´ediaire de 60 patients pr´esente des atrophies corticales s´ev`eres et des volumes sous corticaux normaux. En outre, ces patients souffrent de d´eficits cognitifs, mais ils n’ont que des symptˆ omes n´egatifs l´egers. De plus, cette stratification est g´en´eralis´ee aux patients FEP et ARMS. En utilisant une approche de regroupement non supervis´e de neuroimagerie, nous avons d´emontr´e qu’il existe des sch´emas distincts d’anomalies c´er´ebrales dans la schizophr´enie, avec un sous-groupe de patients pr´esentant de grandes atrophies dans les zones sous-corticales r´ev´elant les symptˆ omes n´egatifs les plus s´ev`eres. Ces profils diff´erentiels de la maladie peuvent ˆetre ind´ependants de la dur´ee de la maladie et / ou des m´edicaments, puisque des sous-groupes similaires sont trouv´es chez les patients au d´ebut du trouble. Nos r´esultats sugg`erent qu’ils peuvent ˆetre associ´es `a diff´erents m´ecanismes physiopathologiques. Comprendre l’h´et´erog´en´eit´e du trouble peut ouvrir la voie vers une meilleure caract´erisation des sous-groupes de patients et donc la mise en place d’un traitement cibl´e.
Summary in French
128
Figure 7.7: Stratification d’une population en sous-groupe homog`ene
Conclusion La capacit´e de l’IRM ` a ˆetre un outil de diagnostic reste remise en question, notamment en raison de la petite taille des ensembles de donn´ees. Cette th`ese ouvre la voie `a l’analyse de grands ensembles de donn´ees de neuroimagerie h´et´erog`enes. Nous avons montr´e que la pr´ediction est faisable dans un contexte clinique. Bien que la pr´ecision de la pr´ediction inter-site (70%) ne soit pas suffisante pour effectuer un diagnostic individuel, nous avons mis en ´evidence l’existence d’une signature neuroanatomique de la schizophr´enie, commune `a travers les sites et les stades de la maladie. Ces r´esultats ouvrent une large perspective pour l’avenir: avec la perc´ee technologique dans les m´ethodes d’acquisition, l’apparition de base de donn´ees de taille croissante et la stratification de la schizophr´enie en sous-groupe plus homog`enes, l’IRM pourrait devenir pertinente pour une utilisation clinique.
Bibliography [1] Michael S Ritsner. Handbook of Schizophrenia Spectrum Disorders, Volume III: Therapeutic Approaches, Comorbidity, and Outcomes, volume 3. Springer, 2011. [2] Stephan Ripke, Benjamin M Neale, Aiden Corvin, James TR Walters, Kai-How Farh, Peter A Holmans, Phil Lee, Brendan Bulik-Sullivan, David A Collier, Hailiang Huang, et al. Biological insights from 108 schizophrenia-associated genetic loci, 2014. [3] Agnieszka Laba-Stefanek, Ewelina Dziwota, and Marcin Olajossy. Genetic and environmental factors in the etiology of schizophrenia-towards mainstreaming. Current Problems of Psychiatry, 17(4):243–249, 2016. [4] Majella Byrne, Esben Agerbo, Birgit Bennedsen, William W Eaton, and Preben Bo Mortensen. Obstetric conditions and risk of first admission with schizophrenia: a danish national register based study. Schizophrenia research, 97(1):51–59, 2007. [5] Mark GA Opler and Ezra S Susser. Fetal environment and schizophrenia. Environmental health perspectives, 113(9):1239, 2005. [6] Jim Van Os and Jean-Paul Selten. Prenatal exposure to maternal stress and subsequent schizophrenia: the may 1940 invasion of the netherlands. The british journal of psychiatry, 172(4):324–326, 1998. [7] Sven Andr´easson, Ann Engstr¨om, Peter Allebeck, and Ulf Rydberg. Cannabis and schizophrenia a longitudinal study of swedish conscripts. The Lancet, 330(8574):1483– 1486, 1987. [8] Jim Van Os, Maarten Bak, Manan Hanssen, RV Bijl, Ron De Graaf, and Helene Verdoux. Cannabis use and psychosis: a longitudinal population-based study. American journal of epidemiology, 156(4):319–327, 2002. [9] Jeffrey A Lieberman, T Scott Stroup, Joseph P McEvoy, Marvin S Swartz, Robert A Rosenheck, Diana O Perkins, Richard SE Keefe, Sonia M Davis, Clarence E Davis, Barry D Lebowitz, et al. Effectiveness of antipsychotic drugs in patients with chronic schizophrenia. New England Journal of Medicine, 353(12):1209–1223, 2005.
130
Bibliography
131
[10] Robin Emsley, Bonginkosi Chiliza, Laila Asmal, and Brian H Harvey. The nature of relapse in schizophrenia. BMC psychiatry, 13(1):50, 2013. [11] Tor K Larsen, Thomas H McGlashan, and Lars Conrad Moe. First-episode schizophrenia: I. early course parameters. Schizophrenia Bulletin, 22(2):241, 1996. [12] Jeffrey A Lieberman, Diana Perkins, Aysenil Belger, Miranda Chakos, Fred Jarskog, Kalina Boteva, and John Gilmore. The early stages of schizophrenia: speculations on pathogenesis, pathophysiology, and therapeutic approaches. Biological psychiatry, 50 (11):884–897, 2001. [13] Matti Penttil¨ a, Erika J¨ a¨ askel¨ ainen, Noora Hirvonen, Matti Isohanni, and Jouko Miettunen. Duration of untreated psychosis as predictor of long-term outcome in schizophrenia: systematic review and meta-analysis. The British Journal of Psychiatry, 205(2): 88–94, 2014. [14] American Psychiatric Association et al. Diagnostic and statistical manual of mental disorders-iv-tr. Washington, DC: American Psychiatric Association, 2000. [15] Hugo G Schnack, Mireille Nieuwenhuis, Neeltje EM van Haren, Lucija Abramovic, Thomas W Scheewe, Rachel M Brouwer, Hilleke E Hulshoff Pol, and Ren´e S Kahn. Can structural mri aid in clinical classification? a machine learning study in two independent samples of patients with schizophrenia, bipolar disorder and healthy subjects. Neuroimage, 84:299–306, 2014. [16] Sander V Haijma, Neeltje Van Haren, Wiepke Cahn, P C´edric MP Koolschijn, Hilleke E Hulshoff Pol, and Ren´e S Kahn. Brain volumes in schizophrenia: a meta-analysis in over 18 000 subjects. Schizophrenia bulletin, 39(5):1129–1138, 2012. [17] Bayanne Olabi, Ian Ellison-Wright, Andrew M McIntosh, Stephen J Wood, Ed Bullmore, and Stephen M Lawrie. Are there progressive brain changes in schizophrenia? a meta-analysis of structural magnetic resonance imaging studies. Biological psychiatry, 70(1):88–96, 2011. [18] Russell A Poldrack, Jeanette A Mumford, and Thomas E Nichols. Handbook of functional MRI data analysis. Cambridge University Press, 2011. [19] John Ashburner. A fast diffeomorphic image registration algorithm. Neuroimage, 38 (1):95–113, 2007. doi: 10.1016/j.neuroimage.2007.07.007. [20] Karl J Friston, Andrew P Holmes, Keith J Worsley, J-P Poline, Chris D Frith, and Richard SJ Frackowiak. Statistical parametric maps in functional imaging: a general linear approach. Human brain mapping, 2(4):189–210, 1994. [21] EveC Johnstone, Chris D Frith, Timothy Crow, Janet Husband, and L Kreel. Cerebral ventricular size and cognitive impairment in chronic schizophrenia. The Lancet, 308 (7992):924–926, 1976.
Bibliography
132
[22] Martha E Shenton, Chandlee C Dickey, Melissa Frumin, and Robert W McCarley. A review of mri findings in schizophrenia. Schizophrenia research, 49(1):1–52, 2001. [23] Ian C Wright, Sophia Rabe-Hesketh, Peter WR Woodruff, Anthony S David, Robin M Murray, and Edward T Bullmore.
Meta-analysis of regional brain volumes in
schizophrenia. American Journal of Psychiatry, 157(1):16–25, 2000. [24] Robyn Honea, Tim J Crow, Dick Passingham, and Clare E Mackay. Regional deficits in brain volume in schizophrenia: a meta-analysis of voxel-based morphometry studies. American Journal of Psychiatry, 162(12):2233–2245, 2005. [25] Monica Baiano, A David, A Versace, Raphael Churchill, Matteo Balestrieri, and Paolo Brambilla. Anterior cingulate volumes in schizophrenia: a systematic review and a meta-analysis of mri studies. Schizophrenia research, 93(1):1–12, 2007. [26] Alex Fornito, Murat Y¨ ucel, Jatinder Patti, Stephen Wood, and Christos Pantelis. Mapping grey matter reductions in schizophrenia: an anatomical likelihood estimation analysis of voxel-based morphometry studies. Schizophrenia research, 108(1):104–113, 2009. [27] Alison Kopelman, Nancy C Andreasen, and Peg Nopoulos. Morphology of the anterior cingulate gyrus in patients with schizophrenia: relationship to typical neuroleptic exposure. American Journal of Psychiatry, 162(10):1872–1878, 2005. [28] Laurie McCormick, Lawrence Decker, Peg Nopoulos, Beng-Choon Ho, and Nancy Andreasen. Effects of atypical and typical neuroleptics on anterior cingulate volume in schizophrenia. Schizophrenia Research, 80(1):73–84, 2005. [29] A Vita, L De Peri, C Silenzi, and M Dieci. Brain morphology in first-episode schizophrenia: a meta-analysis of quantitative magnetic resonance imaging studies. Schizophrenia research, 82(1):75–88, 2006. [30] Fulvia Adriano, Ilaria Spoletini, Carlo Caltagirone, and Gianfranco Spalletta. Updated meta-analyses reveal thalamus volume reduction in patients with first-episode and chronic schizophrenia. Schizophrenia research, 123(1):1–14, 2010. [31] Alana M Shepherd, Kristin R Laurens, Sandra L Matheson, Vaughan J Carr, and Melissa J Green. Systematic meta-review and quality assessment of the structural brain alterations in schizophrenia. Neuroscience & Biobehavioral Reviews, 36(4):1342– 1356, 2012. [32] Pierre Orban, Christian Dansereau, Laurence Desbois, Violaine Mongeau-P´erusse, ´ Charles-Edouard Gigu`ere, Hien Nguyen, Adrianna Mendrek, Emmanuel Stip, and Pierre Bellec. Multisite generalizability of schizophrenia diagnosis classification based on functional brain connectivity. Schizophrenia research, 192:167–171, 2018.
Bibliography
133
[33] Emre Bora, Alex Fornito, Joaquim Radua, Mark Walterfang, Marc Seal, Stephen J Wood, Murat Y¨ ucel, Dennis Velakoulis, and Christos Pantelis. Neuroanatomical abnormalities in schizophrenia: a multimodal voxelwise meta-analysis and meta-regression analysis. Schizophrenia research, 127(1):46–57, 2011. [34] Paul M Thompson, Jason L Stein, Sarah E Medland, Derrek P Hibar, Alejandro Arias Vasquez, Miguel E Renteria, Roberto Toro, Neda Jahanshad, Gunter Schumann, Barbara Franke, et al. The enigma consortium: large-scale collaborative analyses of neuroimaging and genetic data. Brain imaging and behavior, 8(2):153–182, 2014. [35] Theo GM van Erp, Derrek P Hibar, Jerod M Rasmussen, David C Glahn, Godfrey D Pearlson, Ole A Andreassen, Ingrid Agartz, Lars T Westlye, Unn K Haukvik, Anders M Dale, et al. Subcortical brain volume abnormalities in 2028 individuals with schizophrenia and 2540 healthy controls via the enigma consortium. Molecular psychiatry, 21(4): 547, 2016. [36] Joaquim Radua, S Borgwardt, A Crescini, D Mataix-Cols, A Meyer-Lindenberg, PK McGuire, and P Fusar-Poli. Multimodal meta-analysis of structural and functional brain changes in first episode psychosis and the effects of antipsychotic medication. Neuroscience & Biobehavioral Reviews, 36(10):2325–2333, 2012. [37] Roberto Roiz-Santia˜ nez, Paula Suarez-Pinilla, and Benedicto Crespo-Facorro. Brain structural effects of antipsychotic treatment in schizophrenia: a systematic review. Current neuropharmacology, 13(4):422–434, 2015. [38] Renata Smieskova, Paolo Fusar-Poli, Paul Allen, Kerstin Bendfeldt, Rolf-Dieter Stieglitz, Juergen Drewe, Ernst Radue, Philip McGuire, Anita Riecher-Rossler, and Stefan Borgwardt. The effects of antipsychotics on the brain: what have we learnt from structural imaging of schizophrenia? a systematic review. Current pharmaceutical design, 15(22):2535–2549, 2009. [39] Ulysses S Torres, Eduardo Portela-Oliveira, Stefan Borgwardt, and Geraldo F Busatto. Structural brain changes associated with antipsychotic treatment in schizophrenia as revealed by voxel-based morphometric mri: an activation likelihood estimation metaanalysis. BMC psychiatry, 13(1):342, 2013. [40] Marek Kubicki, Martha Elizabeth Shenton, Dean Salisbury, Y Hirayasu, Kazue Kasai, Ron Kikinis, Ferenc A Jolesz, and Robert William McCarley. Voxel-based morphometric analysis of gray matter in first episode schizophrenia. Neuroimage, 17(4):1711–1719, 2002. [41] R Grant Steen, Courtney Mull, Robert Mcclure, Robert M Hamer, and Jeffrey A Lieberman. Brain volume in first-episode schizophrenia: systematic review and metaanalysis of magnetic resonance imaging studies. The British Journal of Psychiatry, 188 (6):510–518, 2006.
Bibliography
134
[42] Neeltje EM van Haren, Hilleke E Hulshoff Pol, Hugo G Schnack, Wiepke Cahn, Rachel Brans, Inge Carati, Monica Rais, and Ren´e S Kahn. Progressive brain volume loss in schizophrenia over the course of the illness: evidence of maturational abnormalities in early adulthood. Biological Psychiatry, 63(1):106–113, 2008. [43] Hilleke E Hulshoff Pol and Ren´e S Kahn. What happens after the first episode? a review of progressive brain changes in chronically ill patients with schizophrenia. Schizophrenia bulletin, 34(2):354–366, 2008. [44] Stefan J Borgwardt, PHILIP K McGUIRE, Jacqueline Aston, Gregor Berger, Paola ¨ Dazzan, UTE Gschwandtner, Marlon PflUger, Marcus D’souza, Ernst-Wilhelm Radue, and Anita Riecher-R¨ ossler. Structural brain abnormalities in individuals with an atrisk mental state who later develop psychosis. The British Journal of Psychiatry, 191 (S51):s69–s75, 2007. [45] Paola Dazzan, Bridget Soulsby, Andrea Mechelli, Stephen J Wood, Dennis Velakoulis, Lisa J Phillips, Alison R Yung, Xavier Chitnis, Ashleigh Lin, Robin M Murray, et al. Volumetric abnormalities predating the onset of schizophrenia and affective psychoses: an mri study in subjects at ultrahigh risk of psychosis. Schizophrenia bulletin, 38(5): 1083–1091, 2011. [46] Vladimir Vapnik. The nature of statistical learning theory. Springer science & business media, 2013. [47] Andrei Tikhonov. On the stability of inverse problems. [48] Arthur E Hoerl and Robert W Kennard. Ridge regression: Biased estimation for nonorthogonal problems. Technometrics, 12(1):55–67, 1970. [49] Robert Tibshirani. Regression shrinkage and selection via the lasso. Journal of the Royal Statistical Society. Series B (Methodological), pages 267–288, 1996. [50] Amir Beck and Marc Teboulle. A fast iterative shrinkage-thresholding algorithm for linear inverse problems. SIAM journal on imaging sciences, 2(1):183–202, 2009. [51] Hui Zou and Trevor Hastie. Regularization and variable selection via the elastic net. Journal of the Royal Statistical Society: Series B (Statistical Methodology), 67(2):301– 320, 2005. [52] Christos Davatzikos, Dinggang Shen, Ruben C Gur, Xiaoying Wu, Dengfeng Liu, Yong Fan, Paul Hughett, Bruce I Turetsky, and Raquel E Gur. Whole-brain morphometric study of schizophrenia revealing a spatially complex set of focal abnormalities. Archives of general psychiatry, 62(11):1218–1227, 2005. [53] Yong Fan, Dinggang Shen, Ruben C Gur, Raquel E Gur, and Christos Davatzikos. Compare: classification of morphological patterns using adaptive regional elements. IEEE transactions on medical imaging, 26(1):93–105, 2007.
Bibliography
135
[54] Nikolaos Koutsouleris, Eva M Meisenzahl, Christos Davatzikos, Ronald Bottlender, Thomas Frodl, Johanna Scheuerecker, Gisela Schmitt, Thomas Zetzsche, Petra Decker, Maximilian Reiser, et al. Use of neuroanatomical pattern classification to identify subjects in at-risk mental states of psychosis and predict disease transition. Archives of general psychiatry, 66(7):700–712, 2009. [55] Nikolaos Koutsouleris, Christos Davatzikos, Ronald Bottlender, Katja PatschurekKliche, Johanna Scheuerecker, Petra Decker, Christian Gaser, Hans-J¨ urgen M¨oller, and Eva M Meisenzahl. Early recognition and disease prediction in the at-risk mental states for psychosis using neurocognitive pattern classification. Schizophrenia bulletin, 38(6):1200–1215, 2011. [56] Nikolaos Koutsouleris, Anita Riecher-R¨ossler, Eva M Meisenzahl, Renata Smieskova, Erich Studerus, Lana Kambeitz-Ilankovic, Sebastian von Saldern, Carlos Cabral, Maximilian Reiser, Peter Falkai, et al. Detecting the psychosis prodrome across high-risk populations using neuroanatomical biomarkers. Schizophrenia bulletin, 41(2):471–482, 2014. [57] Yasuhiro Kawasaki, Michio Suzuki, Ferath Kherif, Tsutomu Takahashi, Shi-Yu Zhou, Kazue Nakamura, Mie Matsui, Tomiki Sumiyoshi, Hikaru Seto, and Masayoshi Kurachi. Multivariate voxel-based morphometry successfully differentiates schizophrenia patients from healthy controls. Neuroimage, 34(1):235–242, 2007. [58] Mireille Nieuwenhuis, Neeltje EM van Haren, Hilleke E Hulshoff Pol, Wiepke Cahn, Ren´e S Kahn, and Hugo G Schnack. Classification of schizophrenia patients and healthy controls from structural mri scans in two large independent samples. Neuroimage, 61 (3):606–612, 2012. [59] Martin Rozycki, Theodore D Satterthwaite, Nikolaos Koutsouleris, Guray Erus, Jimit Doshi, Daniel H Wolf, Yong Fan, Raquel E Gur, Ruben C Gur, Eva M Meisenzahl, et al. Multisite machine learning analysis provides a robust structural imaging signature of schizophrenia detectable across diverse patient populations and within individuals. Schizophrenia bulletin, 2017. [60] Bilwaj Gaonkar and Christos Davatzikos. Analytic estimation of statistical significance maps for support vector machine based multi-variate image analysis and classification. Neuroimage, 78:270–283, 2013. [61] Ze Wang, Anna R Childress, Jiongjiong Wang, and John A Detre. Support vector machine learning-based fmri data group analysis. NeuroImage, 36(4):1139–1151, 2007. [62] Logan Grosenick, Brad Klingenberg, Kiefer Katovich, Brian Knutson, and Jonathan E Taylor. Interpretable whole-brain prediction analysis with graphnet. NeuroImage, 72: 304–321, 2013.
Bibliography
136
[63] Mathieu Dubois, Fouad Hadj-Selem, Tommy Lofstedt, Matthieu Perrot, Clara Fischer, Vincent Frouin, and Edouard Duchesnay. Predictive support recovery with tv-elastic net penalty and logistic regression: an application to structural mri. In Pattern Recognition in Neuroimaging, 2014 International Workshop on, pages 1–4. IEEE, 2014. [64] Alexandre Gramfort, Bertrand Thirion, and Ga¨el Varoquaux. Identifying predictive regions from fmri with tv-l1 prior. In Pattern Recognition in Neuroimaging (PRNI), 2013 International Workshop on, pages 17–20. IEEE, 2013. [65] Mark Schmidt, Nicolas L Roux, and Francis R Bach. Convergence rates of inexact proximal-gradient methods for convex optimization. In Advances in neural information processing systems, pages 1458–1466, 2011. [66] Vincent Michel, Alexandre Gramfort, Ga¨el Varoquaux, Evelyn Eger, and Bertrand Thirion. Total variation regularization for fmri-based prediction of behavior. IEEE transactions on medical imaging, 30(7):1328–1340, 2011. [67] Yurii Nesterov. Smooth minimization of non-smooth functions. Mathematical programming, 103(1):127–152, 2005. [68] Amir Beck and Marc Teboulle. A Fast Iterative Shrinkage-Thresholding Algorithm for Linear Inverse Problems. SIAM Journal on Imaging Sciences, 2(1):183–202, 2009. ISSN 1936-4954. doi: 10.1137/080716542. [69] Ingrid Daubechies, Michel Defrise, and Christine De Mol. An iterative thresholding algorithm for linear inverse problems with a sparsity constraint. Communications on Pure and Applied Mathematics: A Journal Issued by the Courant Institute of Mathematical Sciences, 57(11):1413–1457, 2004. [70] Yurri. Nesterov. Smooth minimization of non-smooth functions. Mathematical Programming, 103(1):127–152, 2005. ISSN 0025-5610. doi: 10.1007/s10107-004-0552-5. [71] Xi.Chen, Lin. Qihang, Kim. Seyoung, Jaime. Carbonell., and Eric. Xing. Smoothing proximal gradient method for general structured sparse regression. The Annals of Applied Statistics, 6(2):719–752, 2012. ISSN 1941-7330. doi: 10.1214/11-AOAS514. [72] Fouad Hadj-Selem, Tommy Lofstedt, Vincent Frouin, Vincent Guillemot, and Edouard Duchesnay. An Iterative Smoothing Algorithm for Regression with Structured Sparsity. arXiv:1605.09658 [stat], 2016. URL http://arxiv.org/abs/1605.09658. arXiv: 1605.09658. [73] Jonathan. Borwein and Adrian Lewis.
Convex Analysis and Nonlinear Optimiza-
tion: Theory and Examples. CMS Books in Mathematics. Springer, 2006. ISBN 9780387295701. URL http://books.google.fr/books?id=TXWzqEkAa7IC. [74] Julien. Mairal. puter vision.
Sparse coding for machine learning, image processing and com´ PhD thesis, Ecole normale sup´erieure, Cachan, 2010. URL http:
//tel.archives-ouvertes.fr/tel-00595312.
Bibliography
137
[75] Ming Li, Yadong Liu, Fanglin Chen, and Dewen Hu. Including signal intensity increases the performance of blind source separation on brain imaging data. IEEE transactions on medical imaging, 34(2):551–563, 2015. [76] Julien. Mairal, Francis. Bach, Jean J. Ponce, and G. Sapiro. Online Learning for Matrix Factorization and Sparse Coding. J. Mach. Learn. Res., 11:19–60, 2010. ISSN 1532-4435. URL http://dl.acm.org/citation.cfm?id=1756006.1756008. [77] Mahdi Ramezani, Kristopher Marble, Heather Trang, and Purang Abolmaesumi Ingrid Johnsrude. Joint sparse representation of brain activity patterns in multi-task fmri data. IEEE transactions on medical imaging, 34(1):2–12, 2015. [78] Ian Jolliffe, Nickolay Trendafilov, and Mudassir Uddin. A Modified Principal Component Technique Based on the LASSO. Journal of Computational and Graphical Statistics, 12(3):531–547, 2003. ISSN 1061-8600, 1537-2715. doi: 10.1198/1061860032148. URL http://www.tandfonline.com/doi/abs/10.1198/1061860032148. [79] Hui Zou, Trevor Hastie, and Robert Tibshirani. Sparse Principal Component Analysis. Journal of Computational and Graphical Statistics, 15(2):265–286, 2006. ISSN 10618600, 1537-2715. doi: 10.1198/106186006X113430. URL http://www.tandfonline. com/doi/abs/10.1198/106186006X113430. [80] Alexandre d’Aspremont, Laurent El Ghaoui, Michael Jordan, and Gert Lanckriet. A Direct Formulation for Sparse PCA Using Semidefinite Programming. SIAM Review, 49(3):434–448, 2007. ISSN 0036-1445, 1095-7200. doi: 10.1137/050645506. URL http: //epubs.siam.org/doi/abs/10.1137/050645506. [81] Daniela Witten, Robert Tibshirani, and Trevor Hastie. A penalized matrix decomposition, with applications to sparse principal components and canonical correlation analysis. Biostatistics, 10(3):515–534, 2009. ISSN 1465-4644, 1468-4357. doi: 10.1093/biostatistics/kxp008.
URL http://biostatistics.oxfordjournals.org/
cgi/doi/10.1093/biostatistics/kxp008. [82] Michel Journe, Yurii. Nesterov, Peter Richtrik, and Rodolphe Sepulchre. Generalized Power Method for Sparse Principal Component Analysis. J. Mach. Learn. Res., 11:517– 553, 2010. ISSN 1532-4435. URL http://dl.acm.org/citation.cfm?id=1756006. 1756021. [83] Harini Eavani, Theodore Satterthwaite, Roman Filipovych, Raquel Gur, and Christos Davatzikos. Identifying sparse connectivity patterns in the brain using resting-state fmri. Neuroimage, 105:286–299, 2015. [84] Hui Shen, Huaze Xu, Lubing Wang, Yu Lei, Liu Yang, Peng Zhang, Jian Qin, Ling Zeng, Zontang Zhou, Zheng Yang, and Dewen Hu. Making group inferences using sparse representation of resting-state functional mri data with application to sleep deprivation. Human Brain Mapping, 38(9):4671–4689, 2017.
Bibliography [85] Korbinian Brodmann.
138 Vergleichende lokalisationslehre der grosshirnrinde in ihren
prinzipien dargestellt auf grund des zellenbaues. 1909. [86] Daniel Felleman and David Van Essen. Distributed hierarchical processing in the primate cerebral cortex. Cerebral cortex (New York, NY: 1991), 1(1):1–47, 1991. [87] Rudolf Nieuwenhuys. The myeloarchitectonic studies on the human cerebral cortex of the vogt–vogt school, and their significance for the interpretation of functional neuroimaging data. Brain Structure and Function, 218(2):303–352, 2013. [88] Rodolphe Jenatton, Guillaume Obozinski, and Francis Bach. Structured sparse principal component analysis. In International Conference on Artificial Intelligence and Statistics (AISTATS), 2010. [89] Ruixin Guo, Mihye Ahn, Hongtu Zhu, and the Alzheimers Disease Neuroimaging Initiative. Spatially weighted principal component analysis for imaging classification. Journal of Computational and Graphical Statistics, 24:274–296, 2015. [90] Wen-Ting. Wang and Hsin-Cheng. Huang. Regularized Principal Component Analysis for Spatial Data. ArXiv e-prints, 2015. [91] Logan Grosenick, Brad Klingenberg, Kiefer Katovich, Brian Knutson, and Jonathan Taylor. Interpretable whole-brain prediction analysis with GraphNet. NeuroImage, 72: 304–321, May 2013. ISSN 1053-8119. doi: 10.1016/j.neuroimage.2012.12.062. URL http://www.sciencedirect.com/science/article/pii/S1053811912012487. [92] Benjamin Kandel, David Wolk, James Gee, and Brian Avants. Predicting Cognitive Data from Medical Images Using Sparse Linear Regression. Information processing in medical imaging : proceedings of the ... conference, 23:86–97, 2013. ISSN 1011-2499. URL http://www.ncbi.nlm.nih.gov/pmc/articles/PMC4603981/. [93] Bernard Ng, Arash Vahdat, Ghassan Hamarneh, and Rafeef Abugharbieh. Generalized Sparse Classifiers for Decoding Cognitive States in fMRI. In SpringerLink, pages 108– 115, Beijing, China, September 2012. Springer Berlin Heidelberg. URL http://link. springer.com/chapter/10.1007/978-3-642-15948-0_14. DOI: 10.1007/978-3-64215948-0 14. [94] Elvis Dohmatob, Michael Eickenberg, Bertrand Thirion, and Gael Varoquaux. Speeding-up model-selection in GraphNet via early-stopping and univariate featurescreening. June 2015. URL https://hal.inria.fr/hal-01147731/document. [95] Holger Mohr, Utta Wolfensteller, Steffi Frimmel, and Hannes Ruge. Sparse regularization techniques provide novel insights into outcome integration processes. NeuroImage, 104:163–176, January 2015. ISSN 1053-8119. doi: 10.1016/j.neuroimage.2014.10.025. URL http://www.sciencedirect.com/science/article/pii/S1053811914008490.
Bibliography
139
[96] Alexandre Abraham, Elvis Dohmatob, Bertrand Thirion, Dimitri Samaras, and Gael Varoquaux. Extracting brain regions from rest fmri with total-variation constrained dictionary learning. In Medical Image Computing and Computer-Assisted Intervention - MICCAI 2013 - 16th International Conference, Nagoya, Japan, 2013, Proceedings, Part II, pages 607–615, 2013. doi: 10.1007/978-3-642-40763-5 75. URL http://dx. doi.org/10.1007/978-3-642-40763-5_75. [97] Amir Beck and Marc Teboulle. Fast gradient-based algorithms for constrained total variation image denoising and deblurring problems. IEEE Trans. Image Processing, 18 (11):2419–2434, 2009. doi: 10.1109/TIP.2009.2028250. URL http://dx.doi.org/10. 1109/TIP.2009.2028250. [98] Lester W. Mackey. Deflation Methods for Sparse PCA. In D. Koller, D. Schuurmans, Y. Bengio, and L. Bottou, editors, Advances in Neural Information Processing Systems 21, pages 1017–1024. Curran Associates, Inc., 2009. URL http://papers.nips.cc/ paper/3575-deflation-methods-for-sparse-pca.pdf. [99] Stephen Boyd and Lieven Vandenberghe. Convex Optimization. Cambridge University Press, New York, NY, USA, 2004. ISBN 0521833787. [100] Fabian Pedregosa, Gael Varoquaux, Alexandre Gramfort, Vincent Michel, Bertrand Thirion, Olivier Grisel, Mathieu Blondel, Peter Prettenhofer, Ron Weiss, Vincent Dubourg, Jake Vanderplas, Alexandre Passos, David Cournapeau, Matthieu Brucher, Matthieu Perrot, and Edouard Duchesnay. Scikit-learn: Machine learning in Python. Journal of Machine Learning Research, 12:2825–2830, 2011. [101] Lee Dice. Measures of the amount of ecologic association between species. Ecology, 26: 297–302, 1945. [102] Akram Bakkour, John Morris, and Bradford Dickerson. The cortical signature of prodromal ad: regional thinning predicts mild ad dementia. Neurology, 72:1048–1055, 2009. [103] Bradford Dickerson, Eric Feczko, Jean Augustinack, Jenni Pacheco, John Morris, and Bruce Fischl. Differential effects of aging and alzheimer’s disease on medial temporal lobe cortical thickness and surface area. Neurobiology of aging, 30:432–440, 2009. [104] John Sled, Alex Zijdenbos, and Alan Evans. A nonparametric method for automatic correction of intensity nonuniformity in mri data. IEEE Trans Med Imaging, 17:87–97, 1998. [105] Anders Dale, Bruce Fischl, and Martin I. Sereno. Cortical surface-based analysis: I. segmentation and surface reconstruction. NeuroImage, 9(2):179 – 194, 1999. [106] Bruce B. Fischl, M. Sereno, and A. Dale. Cortical surface-based analysis: Ii: Inflation, flattening, and a surface-based coordinate system. NeuroImage, 9(2):195 – 207, 1999.
Bibliography
140
[107] Giovanni Frisoni, Nick Fox, Clifford Jack, Ph Scheltens, and Paul Thompson. The clinical use of structural MRI in Alzheimer disease. Nat Rev Neurol, 6(2):67–77, 2010. doi: 10.1038/nrneurol.2009.215. [108] Heiko Braak and Eva Braak. Neuropathological stageing of alzheimer-related changes. Acta Neuropathologica, 82(4):239–259, 1991.
ISSN 1432-0533.
doi:
10.1007/
BF00308809. URL http://dx.doi.org/10.1007/BF00308809. [109] Andre Delacourte, Jean-Philippe David, Nicolas Sergeant, L Buee, A Wattez, P Vermersch, F Ghozali, C Fallet-Bianco, F Pasquier, F Lebert, et al. The biochemical pathway of neurofibrillary degeneration in aging and alzheimers disease. Neurology, 52 (6):1158–1158, 1999. [110] Clifford Jack, Maria Shiung, Jeffrey Gunter, PC Obrien, SD Weigand, David S Knopman, Bradley F Boeve, Robert J Ivnik, Glenn E Smith, RH Cha, et al. Comparison of different mri brain atrophy rate measures with clinical disease progression in ad. Neurology, 62(4):591–600, 2004. [111] Basil Ridha, Valerie Anderson, Josephine Barnes, Richard Boyes, Sona Price, Martin Rossor, Jennifer Whitwell, Lisa Jenkins, Ronald Black, Michae Micheal Grundman, et al. Volumetric mri and cognitive measures in alzheimer disease. Journal of neurology, 255(4):567–574, 2008. [112] Paul Thompson, Kiralee Hayashi, Greig de Zubicaray, Andrew Janke, Stephen Rose, James Semple, Michael Hong, David Herman, David Gravano, David Doddrell, and Arthur Toga. Mapping hippocampal and ventricular change in alzheimer disease. NeuroImage, 22(4):1754 – 1766, 2004. ISSN 1053-8119. doi: http://dx.doi.org/10.1016/ j.neuroimage.2004.03.040. URL http://www.sciencedirect.com/science/article/ pii/S105381190400196X. [113] Valerie Cardenas, LL Chao, Colin Studholme, Kristin Yaffe, Bruce Miller, Cindee Madison, Shannon Buckley, Dan Mungas, Norbert Schuff, and Michael Weiner. Brain atrophy associated with baseline and longitudinal measures of cognition. Neurobiology of aging, 32(4):572–580, 2011. [114] Carrie McDonald, Linda McEvoy, Lusineh Gharapetian, Christine Fennema-Notestine, Donald Hagler, Dominic Holland, Akihide Koyama, James Brewer, Anders Dale, Alzheimers Disease Neuroimaging Initiative, et al. Regional rates of neocortical atrophy from normal aging to early alzheimer disease. Neurology, 73(6):457–465, 2009. [115] Daqiang Sun, Theo GM van Erp, Paul M Thompson, Carrie E Bearden, Melita Daley, Leila Kushan, Molly E Hardt, Keith H Nuechterlein, Arthur W Toga, and Tyrone D Cannon. Elucidating a magnetic resonance imaging-based neuroanatomic biomarker for psychosis: classification analysis using probabilistic brain atlas and machine learning algorithms. Biological psychiatry, 66(11):1055–1060, 2009.
Bibliography
141
[116] Graziella Orru, William Pettersson-Yeo, Andre F Marquand, Giuseppe Sartori, and Andrea Mechelli. Using support vector machine to identify imaging biomarkers of neurological and psychiatric disease: a critical review. Neuroscience & Biobehavioral Reviews, 36(4):1140–1152, 2012. [117] Joseph Kambeitz, Lana Kambeitz-Ilankovic, Stefan Leucht, Stephen Wood, Christos Davatzikos, Berend Malchow, Peter Falkai, and Nikolaos Koutsouleris. Detecting neuroimaging biomarkers for schizophrenia: a meta-analysis of multivariate pattern recognition studies. Neuropsychopharmacology, 40(7):1742, 2015. [118] Xiaobing Lu, Yongzhe Yang, Fengchun Wu, Minjian Gao, Yong Xu, Yue Zhang, Yongcheng Yao, Xin Du, Chengwei Li, Lei Wu, et al. Discriminative analysis of schizophrenia using support vector machine and recursive feature elimination on structural mri images. Medicine, 95(30), 2016. [119] Mert R Sabuncu, Ender Konukoglu, Alzheimers Disease Neuroimaging Initiative, et al. Clinical prediction from structural brain mri scans: a large-scale empirical study. Neuroinformatics, 13(1):31–46, 2015. [120] Stefan Haufe, Frank Meinecke, Kai G¨orgen, Sven D¨ahne, John-Dylan Haynes, Benjamin Blankertz, and Felix Bießmann. On the interpretation of weight vectors of linear models in multivariate neuroimaging. Neuroimage, 87:96–110, 2014. ¨ [121] Sebastian Weichwald, Timm Meyer, Ozan Ozdenizci, Bernhard Sch¨olkopf, Tonio Ball, and Moritz Grosse-Wentrup. Causal interpretation rules for encoding and decoding models in neuroimaging. NeuroImage, 110:48–59, 2015. [122] Seyed Mostafa Kia, Sandro Vega Pons, Nathan Weisz, and Andrea Passerini. Interpretability of multivariate brain maps in linear brain decoding: Definition, and heuristic quantification in multivariate analysis of meg time-locked effects. Frontiers in neuroscience, 10:619, 2017. [123] David C Glahn, Angela R Laird, Ian Ellison-Wright, Sarah M Thelen, Jennifer L Robinson, Jack L Lancaster, Edward Bullmore, and Peter T Fox. Meta-analysis of gray matter anomalies in schizophrenia: application of anatomic likelihood estimation and network analysis. Biological psychiatry, 64(9):774–781, 2008. [124] Ulysses S Torres, Fabio LS Duran, Maristela S Schaufelberger, Jos´e AS Crippa, Mario R Louz˜ a, Paulo C Sallet, Caroline YO Kanegusuku, Helio Elkis, Wagner F Gattaz, D´ebora P Bassitt, et al. Patterns of regional gray matter loss at different stages of schizophrenia: A multisite, cross-sectional vbm study in first-episode and chronic illness. NeuroImage: Clinical, 12:1–15, 2016. [125] Gwang-Won Kim, Yun-Hyeon Kim, and Gwang-Woo Jeong. Whole brain volume changes and its correlation with clinical symptom severity in patients with schizophrenia: A dartel-based vbm study. PloS one, 12(5):e0177251, 2017.
Bibliography
142
[126] Hilleke E Hulshoff Pol, Hugo G Schnack, Ren´e CW Mandl, Neeltje EM van Haren, Hilde Koning, D Louis Collins, Alan C Evans, and Ren´e S Kahn. Focal gray matter density changes in schizophrenia. Archives of General Psychiatry, 58(12):1118–1125, 2001. [127] Wenting Ren, Su Lui, Wei Deng, Fei Li, Mingli Li, Xiaoqi Huang, Yuqing Wang, Tao Li, John A Sweeney, and Qiyong Gong. Anatomical and functional brain abnormalities in drug-naive first-episode schizophrenia. American Journal of Psychiatry, 170(11): 1308–1316, 2013. [128] Simon McCarthy-Jones, David Smailes, Aiden Corvin, Michael Gill, Derek W Morris, Timothy G Dinan, Kieran C Murphy, John L Waddington, Gary Donohoe, Robert Dudley, et al. Occurrence and co-occurrence of hallucinations by modality in schizophreniaspectrum disorders. Psychiatry research, 252:154–160, 2017. [129] Paul Allen, Frank Larøi, Philip K McGuire, and Andr`e Aleman. The hallucinating brain: a review of structural and functional neuroimaging studies of hallucinations. Neuroscience & Biobehavioral Reviews, 32(1):175–191, 2008. [130] Renaud Jardri, Alexandre Pouchet, Delphine Pins, and Pierre Thomas. Cortical activations during auditory verbal hallucinations in schizophrenia: a coordinate-based meta-analysis. American Journal of Psychiatry, 168(1):73–81, 2011. [131] Marc Bohlken, K Hugdahl, and Iris Sommer. Auditory verbal hallucinations: neuroimaging and treatment. Psychological medicine, 47(2):199–208, 2017. [132] Iris EC Sommer, Kelly MJ Diederen, Jan-Dirk Blom, Anne Willems, Leila Kushan, Karin Slotema, Marco PM Boks, Kirstin Daalman, Hans W Hoek, Sebastiaan FW Neggers, et al. Auditory verbal hallucinations predominantly activate the right inferior frontal area. Brain, 131(12):3169–3177, 2008. [133] Ben Alderson-Day, Kelly Diederen, Charles Fernyhough, Judith M Ford, Guillermo Horga, Daniel S Margulies, Simon McCarthy-Jones, Georg Northoff, James M Shine, Jessica Turner, et al. Auditory hallucinations and the brains resting-state networks: findings and methodological observations. Schizophrenia bulletin, 42(5):1110–1123, 2016. [134] Georg Northoff and Pengmin Qin. How can the brain’s resting state activity generate hallucinations? a resting state hypothesis of auditory verbal hallucinations. Schizophrenia research, 127(1):202–214, 2011. [135] Renaud Jardri, Pierre Thomas, Christine Delmaire, Pierre Delion, and Delphine Pins. The neurodynamic organization of modality-dependent hallucinations. Cerebral Cortex, pages 1108–1117, 2013.
Bibliography
143
[136] St´ephanie Lefebvre, Morgane Demeulemeester, Arnaud Leroy, Christine Delmaire, Renaud Lopes, Delphine Pins, Pierre Thomas, and Renaud Jardri. Network dynamics during the different stages of hallucinations in schizophrenia. Human brain mapping, 37(7):2571–2586, 2016. [137] Martijn Arns, J-M Batail, St´ephanie Bioulac, Marco Congedo, Christophe Daudet, Dominique Drapier, Thomas Fovet, Renaud Jardri, M Le-Van-Quyen, Fabien Lotte, et al. Neurofeedback: One of today’s techniques in psychiatry? L’Enc´ephale, 43(2): 135–145, 2017. [138] Thomas Fovet, Renaud Jardri, and David Linden. Current issues in the use of fmribased neurofeedback to relieve psychiatric symptoms. Current pharmaceutical design, 21(23):3384–3394, 2015. [139] Thomas Fovet, Natasza Orlov, Miriam Dyck, Paul Allen, Klaus Mathiak, and Renaud Jardri. Translating neurocognitive models of auditory-verbal hallucinations into therapy: using real-time fmri-neurofeedback to treat voices. Frontiers in psychiatry, 7:103, 2016. [140] Belinda R Lennox, S Bert, G Park, Peter B Jones, and Peter G Morris. Spatial and temporal mapping of neural activity associated with auditory hallucinations. The Lancet, 353(9153):644, 1999. [141] Ralph E Hoffman, Adam W Anderson, Maxine Varanko, John C Gore, and Michelle Hampson. Time course of regional brain activation associated with onset of auditory/verbal hallucinations. The British Journal of Psychiatry, 193(5):424–425, 2008. [142] Kelly MJ Diederen, Sebastiaan FW Neggers, Kirstin Daalman, Jan Dirk Blom, Rutger Goekoop, Ren´e S Kahn, and Iris EC Sommer. Deactivation of the parahippocampal gyrus preceding auditory hallucinations in schizophrenia. American Journal of Psychiatry, 167(4):427–435, 2010. [143] James V Haxby, Andrew C Connolly, and J Swaroop Guntupalli. Decoding neural representational spaces using multivariate pattern analysis. Annual review of neuroscience, 37:435–456, 2014. [144] Arnaud Leroy, Jack R Foucher, Delphine Pins, Christine Delmaire, Pierre Thomas, Mathilde M Roser, St´ephanie Lefebvre, Ali Amad, Thomas Fovet, Nemat Jaafari, et al. fmri capture of auditory hallucinations: Validation of the two-steps method. Human brain mapping, 38(10):4966–4979, 2017. [145] Federico De Martino, Francesco Gentile, Fabrizio Esposito, Marco Balsi, Francesco Di Salle, Rainer Goebel, and Elia Formisano. Classification of fmri independent components using ic-fingerprints and support vector machine classifiers. Neuroimage, 34 (1):177–194, 2007.
Bibliography
144
[146] Koene RA Van Dijk, Mert R Sabuncu, and Randy L Buckner. The influence of head motion on intrinsic functional connectivity mri. Neuroimage, 59(1):431–438, 2012. [147] Fabian Pedregosa, Ga¨el Varoquaux, Alexandre Gramfort, Vincent Michel, Bertrand Thirion, Olivier Grisel, Mathieu Blondel, Peter Prettenhofer, Ron Weiss, Vincent Dubourg, et al. Scikit-learn: Machine learning in python. Journal of machine learning research, 12(Oct):2825–2830, 2011. [148] Amicie de Pierrefeu, Tommy L¨ofstedt, Fouad Hadj-Selem, Mathieu Dubois, Renaud Jardri, Thomas Fovet, Philippe Ciuciu, Vincent Frouin, and Edouard Duchesnay. Structured sparse principal components analysis with the tv-elastic net penalty. IEEE transactions on medical imaging, 37(2):396–407, 2018. ´ [149] Branislava Curvci´ c-Blake, Judith M Ford, Daniela Hubl, Natasza D Orlov, Iris E Sommer, Flavie Waters, Paul Allen, Renaud Jardri, Peter W Woodruff, Olivier David, et al. Interaction of language, auditory and memory brain networks in auditory verbal hallucinations. Progress in neurobiology, 148:1–20, 2017. [150] Ben Alderson-Day, Simon McCarthy-Jones, and Charles Fernyhough. Hearing voices in the resting brain: a review of intrinsic functional connectivity research on auditory verbal hallucinations. Neuroscience & Biobehavioral Reviews, 55:78–87, 2015. [151] Marine Mondino, Emmanuel Poulet, Marie-Fran¸coise Suaud-Chagny, and Jerome Brunelin. Anodal tdcs targeting the left temporo-parietal junction disrupts verbal reality-monitoring. Neuropsychologia, 89:478–484, 2016. [152] Anna Rotarska-Jagiela, Vincent van de Ven, Viola Oertel-Kn¨ochel, Peter J Uhlhaas, Kai Vogeley, and David EJ Linden. Resting-state functional network correlates of psychotic symptoms in schizophrenia. Schizophrenia research, 117(1):21–30, 2010. [153] Andrea Mechelli, Paul Allen, Edson Amaro, Cynthia HY Fu, Steven CR Williams, Michael J Brammer, Louise C Johns, and Philip K McGuire. Misattribution of speech and impaired connectivity in patients with auditory verbal hallucinations. Human brain mapping, 28(11):1213–1222, 2007. [154] Ans Vercammen, Henderikus Knegtering, Johann A den Boer, Edith J Liemburg, and Andr´e Aleman. Auditory hallucinations in schizophrenia are associated with reduced functional connectivity of the temporo-parietal area. Biological psychiatry, 67(10): 912–918, 2010. [155] Paul Allen, Edson Amaro, Cynthia HY Fu, Steven CR Williams, Michael J Brammer, Louise C Johns, and PHILIP K McGUIRE. Neural correlates of the misattribution of speech in schizophrenia. The British Journal of Psychiatry, 190(2):162–169, 2007.
Bibliography
145
[156] Renaud Jardri, Kenneth Hugdahl, Matthew Hughes, J´erˆome Brunelin, Flavie Waters, Ben Alderson-Day, Dave Smailes, Philipp Sterzer, Philip R Corlett, Pantelis Leptourgos, et al. Are hallucinations due to an imbalance between excitatory and inhibitory influences on the brain? Schizophrenia bulletin, 42(5):1124–1134, 2016. [157] Andre Schmidt, Felix M¨ uller, Claudia Lenz, Patrick Dolder, Yasmin Schmid, Davide Zanchi, Undine Lang, Matthias Liechti, and Stefan Borgwardt. Acute lsd effects on response inhibition neural networks. Psychological medicine, pages 1–13, 2017. [158] Jean Decety and Claus Lamm. The role of the right temporoparietal junction in social interaction: how low-level computational processes contribute to meta-cognition. The Neuroscientist, 13(6):580–593, 2007. [159] Marion Plaze, Jean-Fran¸cois Mangin, Marie-Laure Paill`ere-Martinot, Eric Artiges, Jean-Pierre Oli´e, Marie-Odile Krebs, Rapha¨el Gaillard, Jean-Luc Martinot, and Arnaud Cachia. who is talking to me?self–other attribution of auditory hallucinations and sulcation of the right temporoparietal junction. Schizophrenia research, 169(1): 95–100, 2015. [160] Randy L Buckner, Jessica R Andrews-Hanna, and Daniel L Schacter. The brain’s default network. Annals of the New York Academy of Sciences, 1124(1):1–38, 2008. [161] Marcus E Raichle, Michael D Fox, Abraham Z Snyder, Justin L Vincent, Maurizio Corbetta, and David C Van Essen. From the cover: The human brain is intrinsically organized into dynamic, anticorrelated. [162] Ralph E Hoffman and Michelle Hampson. Functional connectivity studies of patients with auditory verbal hallucinations. Frontiers in Human Neuroscience, 6:6, 2012. [163] Lars M Rimol, Ragnar Nesv˚ ag, Don J Hagler, Ørjan Bergmann, Christine FennemaNotestine, Cecilie B Hartberg, Unn K Haukvik, Elisabeth Lange, Chris J Pung, Andres Server, et al. Cortical volume, surface area, and thickness in schizophrenia and bipolar disorder. Biological psychiatry, 71(6):552–560, 2012. [164] Genichi Sugihara, Naoya Oishi, Shuraku Son, Manabu Kubota, Hidehiko Takahashi, and Toshiya Murai. Distinct patterns of cerebral cortical thinning in schizophrenia: a neuroimaging data-driven approach. Schizophrenia bulletin, 43(4):900–906, 2016. [165] Isobel W Green and Jill R Glausier. Different paths to core pathology: the equifinal model of the schizophrenia syndrome. Schizophrenia bulletin, 42(3):542–549, 2015. [166] Brian Kirkpatrick, Robert W Buchanan, David E Ross, and William T Carpenter. A separate disease within the syndrome of schizophrenia. Archives of general psychiatry, 58(2):165–171, 2001. [167] Andre F Marquand, Thomas Wolfers, Maarten Mennes, Jan Buitelaar, and Christian F Beckmann. Beyond lumping and splitting: a review of computational approaches
Bibliography
146
for stratifying psychiatric disorders. Biological psychiatry: cognitive neuroscience and neuroimaging, 1(5):433–447, 2016. [168] Nikolaos Koutsouleris, Christian Gaser, Markus J¨ager, Ronald Bottlender, Thomas Frodl, Silvia Holzinger, Gisela JE Schmitt, Thomas Zetzsche, Bernhard Burgermeister, Johanna Scheuerecker, et al. Structural correlates of psychopathological symptom dimensions in schizophrenia: a voxel-based morphometric study. Neuroimage, 39(4): 1600–1612, 2008. [169] Igor Nenadic, Heinrich Sauer, and Christian Gaser. Distinct pattern of brain structural deficits in subsyndromes of schizophrenia delineated by psychopathology. Neuroimage, 49(2):1153–1160, 2010. [170] Tianhao Zhang, Nikolaos Koutsouleris, Eva Meisenzahl, and Christos Davatzikos. Heterogeneity of structural brain changes in subtypes of schizophrenia revealed using magnetic resonance imaging pattern analysis. Schizophrenia bulletin, 41(1):74–84, 2014. [171] Aristotle N Voineskos, George Foussias, Jason Lerch, Daniel Felsky, Gary Remington, Tarek K Rajji, Nancy Lobaugh, Bruce G Pollock, and Benoit H Mulsant. Neuroimaging evidence for the deficit subtype of schizophrenia. JAMA psychiatry, 70(5):472–480, 2013. [172] Neil D Woodward and Stephan Heckers. Brain structure in neuropsychologically defined subgroups of schizophrenia and psychotic bipolar disorder. Schizophrenia bulletin, 41(6):1349–1359, 2015. [173] Danielle Weinberg, Rhoshel Lenroot, Isabella Jacomb, Katherine Allen, Jason Bruggemann, Ruth Wells, Ryan Balzan, Dennis Liu, Cherrie Galletly, Stanley V Catts, et al. Cognitive subtypes of schizophrenia characterized by differential brain volumetric reductions and cognitive decline. JAMA psychiatry, 73(12):1251–1259, 2016. [174] Huaiqiang Sun, Su Lui, Li Yao, Wei Deng, Yuan Xiao, Wenjing Zhang, Xiaoqi Huang, Junmei Hu, Feng Bi, Tao Li, et al. Two patterns of white matter abnormalities in medication-naive patients with first-episode schizophrenia revealed by diffusion tensor imaging and cluster analysis. JAMA psychiatry, 72(7):678–686, 2015. [175] Elena I Ivleva, Brett A Clementz, Anthony M Dutcher, Sara JM Arnold, Haekyung Jeon-Slaughter, Sina Aslan, Bradley Witte, Gaurav Poudyal, Hanzhang Lu, Shashwath A Meda, et al. Brain structure biomarkers in the psychosis biotypes: findings from the bipolar-schizophrenia network for intermediate phenotypes. Biological psychiatry, 82(1):26–39, 2017. [176] Dominic B Dwyer, Carlos Cabral, Lana Kambeitz-Ilankovic, Rachele Sanfelici, Joseph Kambeitz, Vince Calhoun, Peter Falkai, Christos Pantelis, Eva Meisenzahl, and Nikolaos Koutsouleris. Brain subtyping enhances the neuroanatomical discrimination of schizophrenia. Schizophrenia bulletin, 2017.
Bibliography
147
[177] Patrick D McGorry, Ian B Hickie, Alison R Yung, Christos Pantelis, and Henry J Jackson. Clinical staging of psychiatric disorders: a heuristic framework for choosing earlier, safer and more effective interventions. Australian and New Zealand Journal of Psychiatry, 40(8):616–622, 2006. [178] Ashleigh Lin, Renate LEP Reniers, and Stephen J Wood. Clinical staging in severe mental disorder: evidence from neurocognition and neuroimaging. The British Journal of Psychiatry, 202(s54):s11–s17, 2013. [179] Yoav Benjamini and Yosef Hochberg. Controlling the false discovery rate: a practical and powerful approach to multiple testing. Journal of the royal statistical society. Series B (Methodological), pages 289–300, 1995. [180] Barton W Palmer, Robert K Heaton, Jane S Paulsen, Julie Kuck, David Braff, M Jackuelyn Harris, Sidney Zisook, and Dilip V Jeste. Is it possible to be schizophrenic yet neuropsychologically normal? Neuropsychology, 11(3):437, 1997. [181] Ian C Gould, Alana M Shepherd, Kristin R Laurens, Murray J Cairns, Vaughan J Carr, and Melissa J Green. Multivariate neuroanatomical classification of cognitive subtypes in schizophrenia: a support vector machine learning approach. NeuroImage: Clinical, 6:229–236, 2014. [182] Thomas W Weickert, Terry E Goldberg, James M Gold, Llewellen B Bigelow, Michael F Egan, and Daniel R Weinberger. Cognitive impairments in patients with schizophrenia displaying preserved and compromised intellect. Archives of General Psychiatry, 57 (9):907–913, 2000. [183] Lena Palaniyappan and Peter F Liddle. Dissociable morphometric differences of the inferior parietal lobule in schizophrenia. European archives of psychiatry and clinical neuroscience, 262(7):579–587, 2012. [184] Bruce E Wexler, Hongtu Zhu, Morris D Bell, Sarah S Nicholls, Robert K Fulbright, John C Gore, Tiziano Colibazzi, Jose Amat, Ravi Bansal, and Bradley S Peterson. Neuropsychological near normality and brain structure abnormality in schizophrenia. American Journal of Psychiatry, 166(2):189–195, 2009. [185] Christoffer Rahm, Benny Liberg, Greg Reckless, Olga Ousdal, Ingrid Melle, Ole A Andreassen, and Ingrid Agartz. Negative symptoms in schizophrenia show association with amygdala volumes and neural activation during affective processing. Acta neuropsychiatrica, 27(4):213–220, 2015. [186] New Fei Ho, Juan Eugenio Iglesias, Min Yi Sum, Carissa Nadia Kuswanto, Yih Yian Sitoh, Joshua De Souza, Zhaoping Hong, Bruce Fischl, Joshua L Roffman, Juan Zhou, et al. Progression from selective to general involvement of hippocampal subfields in schizophrenia. Molecular psychiatry, 22(1):142, 2017.
Bibliography
148
[187] Julian Maclaren, Zhaoying Han, Sjoerd B Vos, Nancy Fischbein, and Roland Bammer. Reliability of brain volume measurements: a test-retest dataset. Scientific data, 1: 140037, 2014. [188] Sergey M Plis, Devon R Hjelm, Ruslan Salakhutdinov, Elena A Allen, Henry J Bockholt, Jeffrey D Long, Hans J Johnson, Jane S Paulsen, Jessica A Turner, and Vince D Calhoun. Deep learning for neuroimaging: a validation study. Frontiers in neuroscience, 8:229, 2014.
Titre:
Apprentissage automatique avec parcimonie structur´ee: Application au ph´enotypage bas´e sur la neuroimagerie pour la schizophr´enie Mots cl´ es: Schizophr´enie; Hallucinations, Apprentissage automatique, Neuroimagerie, Biomarqueurs
R´ esum´ e: La schizophr´enie est un trouble mental, chronique et invalidant caract´eris´e par divers symptˆ omes tels que des hallucinations, des ´episodes d´elirant ainsi que des d´eficiences dans les fonctions cognitives. Au fil des ans, l’Imagerie par Resonance Magn´etique (IRM) a ´et´e de plus en plus utilis´ee pour mieux comprendre les anomalies structurelles et fonctionnelles inh´erentes a ` ce trouble. Les progr`es r´ecents en apprentissage automatique et l’apparition de large base de donn´ees ouvrent maintenant la voie vers la d´ecouverte de biomarqueurs pour le diagnostic / pronostic assist´e par ordinateur. Compte tenu des
limitations des algorithmes actuels ` a produire des signatures pr´edictives stable et interpr´etable, nous avons prolong´e les approches classique de r´egularisation avec des contraintes structurelles provenant de la structure spatiale du cerveau afin de: forcer la solution a ` adh´erer aux hypoth`eses biologiques, produisant des solutions interpr´etable et plausible. De telles contraintes structurelles ont ´et´e utilis´ees pour d’abord identifier une signature neuroanatomique de la schizophr´enie et ensuite une signature fonctionnelle des hallucinations chez les patients atteints de schizophr´enie.
Title:
Machine Learning with Structured Sparsity: Application to Neuroimaging-based Phenotyping in Schizophrenia Keywords: Schizophrenia; Hallucinations, Machine learning, Neuroimaging, Biomarkers
Abstract: Schizophrenia is a disabling chronic with structural constraints issued from the known mental disorder characterized by various symptoms such as hallucinations, delusions as well as impairments in high-order cognitive functions. Over the years, Magnetic Resonance Imaging (MRI) has been increasingly used to gain insights on the structural and functional abnormalities inherent to the disorder. Recent progress in machine learning together with the availability of large datasets now pave the way to capture complex relationships to make inferences at an individual level in the perspective of computeraided diagnosis/prognosis or biomarkers discovery. Given the limitations of state-of-the-art sparse algorithms to produce stable and interpretable predictive signatures, we have pushed forward the regularization approaches extending classical algorithms
biological structure (spatial structure of the brain) in order to force the solution to adhere to biological priors, producing more plausible interpretable solutions. Such structured sparsity constraints have been leveraged to identify first, a neuroanatomical signature of schizophrenia and second a neuroimaging functional signature of hallucinations in patients with schizophrenia. Additionally, we also extended the popular PCA (Principal Component Analysis) with spatial regularization to identify interpretable patterns of the neuroimaging variability in either functional or anatomical meshes of the cortical surface.
Universit´ e Paris-Saclay Espace Technologique / Immeuble Discovery Route de l’Orme aux Merisiers RD 128 / 91190 Saint-Aubin, France


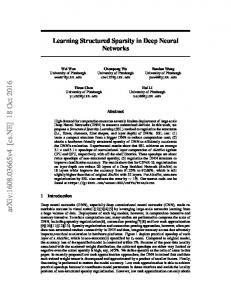

![[PDF] Statistical Learning with Sparsity - Google Sites](https://m.moam.info/img/260x300/pdf-statistical-learning-with-sparsity-google-site_64784385097c4786708ca0b1.jpg)