Available online at www.sciencedirect.com
ScienceDirect Materials Today: Proceedings 2 (2015) 1841 – 1848
4th International Conference on Materials Processing and Characterization
Machine vision for tool status monitoring in turning Inconel 718 using blob analysis Y D Chethana*, H V Ravindrab, Y T Krishne gowdac and Bharath Kumar Sd a
Maharaja Institute of Technology, Mysore, Karnataka, India b P.E.S. College of Engineering, Mandya, Karnataka, India; c Maharaja Institute of Technology, Mysore, Karnataka, India d P.E.S. College of Engineering, Mandya, Karnataka, India
Abstract The automation of the manufacturing process plays an important role in improving productivity. For this, monitoring and diagnostic systems are becoming increasingly necessary in manufacturing. This paper describes A new method, based on a machine vision is proposed to estimate the tool status in cutting inserts in order to identify the time for its replacement. A lathe and a machine vision system have been used to obtain cutting inserts images. A binary image for each of the cutting insert images have been obtained by applying several pre-processing and segmenting operations. Every wear region has been described by means of three features representing the state of the cutting tool viz. wear area; perimeter and compactness are studied here as features and found to be effective in tool condition monitoring. Once all these features are extracted after processing of an image, tool status, whether worn out or not worn out (serviceable), is decided. Test results show that prevalent tool status can be monitored robustly in a real production environment and therefore the manufacturing automation can be improved. © 2015 2014Elsevier The Authors. Ltd. All rights reserved. © Ltd. AllElsevier rights reserved. Selectionand andpeer-review peer-review under responsibility the conference committee members the 4th International Selection under responsibility of theofconference committee members of the 4thofInternational conferenceconference on Materialson Materials Processing and Characterization. Processing and Characterization. Keywords: blob analysis ; machine vision; inconel718;
1. Introduction Tool condition monitoring is important for improving process efficiency, ensuring product quality, and reducing unnecessary tool change costs as well as machine downtime. There is a need to develop a system for * Corresponding author. Tel.::08232-220043-268; fax: 08232-222075 E-mail address:
[email protected]
2214-7853 © 2015 Elsevier Ltd. All rights reserved. Selection and peer-review under responsibility of the conference committee members of the 4th International conference on Materials Processing and Characterization. doi:10.1016/j.matpr.2015.07.124
1842
Y.D. Chethan et al. / Materials Today: Proceedings 2 (2015) 1841 – 1848
machining operation has traditionally been categorized into two approaches: direct and indirect. In the direct approach the actual quantity of the variable, e.g. tool wear, is measured. Examples of direct measurement in this case are the use of cameras for visual inspection, laser beams, and electrical resistance. Many direct methods can only be used as laboratory techniques. This is largely due to the practical limitations caused by access problems during machining, illumination and the use of cutting fluid. However, direct measurement has a high degree of accuracy and has been employed extensively in research laboratories to support the investigations of fundamental measurable phenomena during machining processes. In indirect methods, tool condition is not captured directly, but estimated from the measurable signal feature. This signal feature is extracted through signal processing steps to obtain a sensitive and accurate representation of its state. Indirect methods include those based on sensing of the cutting forces [1], vibrations [2], acoustic emission [3], and motor current [4]. Successful tool status monitoring requires that a number of technical tasks are understood and handled. The wear process must be understood in order to be able to use proper monitoring signals and signal analysis techniques. Diagnostic methods that can analyze the state of the tool automatically must also be understood. Because of the complexity of the problem many different types of approaches have been developed and tested. This paper gives a brief description of monitoring methods and tries to explain why these methods can be expected to work. In order to provide a broad view of tool status monitoring using machine vision technique and their implementation in tool status monitoring system (TCMS), this paper reviews three key features of a TCMS, namely (a) vision sensors, (b) image acquisition, and (c) processing and feature extraction for interpretation. 2. Machine vision The use of machine vision in the visualization of tool status is fairly wide spread in the manufacturing literature. Several researchers have examined the usage of machine vision for the measurement of tool wear. For example, S. Kurada et al.[5] presented image processing techniques and machine vision systems can enable direct tool wear measurement to be accomplished in-cycle. The Comprehensive literature reviews have been published by, C.K. Huang[6],have discussed about the development of an automated flank wear measurement scheme using vision system for a micro drill. The majority of previous research efforts utilize simple image processing techniques that are prone to error especially under varying illumination conditions. In this paper, a new technique to monitor tool status in turning processes, using machine vision monitoring system for an existing machine tool, that can monitor tool status through processing and extracting the machine vision based image features. 3. Experimental Conditions Nickel-base super alloy Inconel 718 is a high-strength, thermal-resistant. Because of its excellent mechanical properties, it plays an important part in recent years in aerospace, petroleum and nuclear energy industries. Due to the extreme toughness and work hardening characteristic of the alloy, the problem of machining Inconel 718 is one of ever-increasing magnitude. The experiments were conducted for different cutting speed and feed combinations. The cutting speeds considered are 280 RPM, 450 RPM and 710 RPM. Feeds considered are 0.05 mm/rev, 0.06 mm/rev and 0.07 mm/rev. Experimental set-up is as shown in the Fig. 1Table 1 shows the chemical composition of work material in percentage by weight. And Table 2 shows the specification of NIKON D-90 Digital camera used in the experiment. Table 1 The Chemical Composition Of Work Material In Percentage Work material Nickel Chromium Iron Niobium Molybdenum Aluminium Carbon
Inconel 718 53% 19% 18.5% 5.1% 3% 0.5% 0.08%
Y.D. Chethan et al. / Materials Today: Proceedings 2 (2015) 1841 – 1848
1843
Fig. 1 The Experimental Set Up For The Acquisition Of An Image Using Machine Vision Table 2 Specification of NIKON D-90 Digital camera Sensor Image sizes Sensor cleaning Autofocus Lens servo
Continuous White balance LCD monitor Dimensions Weight Movie mode
• 12.3 million effective pixels • 4,288 x 2,848 (12 MP) • 3,216 x 2,136 • 2,144 x 1,424 • Image Sensor Cleaning • Image Dust Off • Nikon Multi-CAM1000 • Single-servo • Continuous-servo • Automatic Manual focus (M) • 4.5 fps • Auto • 3.0" TFT LCD • 170 degree viewing angle • Removable protective cover 132 x 103 x 77 mm • No battery: 620 g • With battery: 703 g Yes
4. Introduction to blob analysis Blob analysis is a branch of image analysis that allows identifying groups of pixels (known as blobs) within a grayscale image. Once these regions are identified, it is possible to carry out different types of analyses. Some examples include calculating selected blob features, discard regions automatically that are not of interest and classify regions according to feature values. 4.1. Steps to blob analysis No matter what the image, the basic steps for performing a blob analysis are the same: x Acquire an image. x Use enhancement operations on the image to prepare it for blob Analysis. x Make the blobs clearly identifiable (use a segmentation procedure). x Select the features to calculate. x Calculate the features and analyze the results.
1844
Y.D. Chethan et al. / Materials Today: Proceedings 2 (2015) 1841 – 1848
4.2. Features One of the most important tasks in blob analysis is identifying features to analyze. The following are some blob features. o Area and Perimeter In blob analysis it is assumed that anun calibrated image contains pixels that are 1 unit by 1 unit in size. Therefore, the area of any pixel is 1 unit squared and the perimeter is 4 units. In this case, the area of a blob is the sum of the pixels in the blob. The perimeter is the total number of pixel sides in the blob, as shown in Fig.4. The processing of the images of the tool insert will be done using view flex image processing software and feature extraction from the images are carried out to obtain features like area, perimeter etc. Area =Area of the tool wear region, the number of pixels within the tool wear region Perimeter= Perimeter of the tool wear region, the length of the tool wear region in pixel Due to the increase in area and perimeter of the tool wear region for corresponding increase in the actual tool wear
Fig. 2: Pixel area and perimeter
o
Compactness
Compactness is defined as the ratio of the blob area to the area of the bounding bar. It can be used to distinguish compact blob from non compact one. Compactness =
୰ୣୟ୭ୠ୪୭ୠ ୧ୢ୲୦୭୲୦ୣୠ୪୭ୠ
----------- Eq 4.1
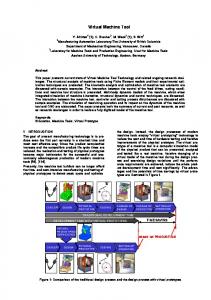
5. Tool status monitoring by machine vision approach Tool status visualization and monitoring of the coated carbide insert during turning inconel 718 was done using Machine vision approach. Tool wear was measured using tool maker’s microscope for which trend will be generated and comparative study will be carried with the Machine vision results. The experimental results which were acquired are presented below. Fig 6 [a] [b] [c] [d] shows the machine vision with machining time for various feed rate at speed of 280 RPM and Depth of Cut 0.2 mm. Initial cutting tests were carried out to capture images and processed them to obtain information about the change. The sequence of processed image is as shown in Fig.5(a)and 5(b) in each process image as well as to extract suitable features. Finally, small area blobs that are present in the image must be eliminated, leaving only the too1 wear blob. Morphological erosion, with a 5 X 5 structuring element, was performed on the binary image. Worn out insert is as shown in fig.5(c)
Y.D. Chethan et al. / Materials Today: Proceedings 2 (2015) 1841 – 1848
Figure.3: a) Fresh tool Image (Before processing)
1845
b) Tool with region of interest(After processing) c) Tool status as seen under machine vision system
5.1Effect of machine vision parameters on tool status According to figure 7[b], for the cutting condition of450 rpm, 0.06 mm/rev and 0.2 mm, progressive wear area seems to have 3 effects on the machining time. Firstly it shows a moderate increases in magnitude, which can be attributed to the rapid tool status from 29766 pixels to 34974 pixels. This may be because the wear rate is higher initially when cutting edges are fresh. When a fresh cutting edge is used, the contact area between the job and the tool will be very small and the contact pressure will be high. Also for the fresh edge, the micro roughness will be normally higher because of the grinding marks on the tool. These factors can result in higher order status during initial period of machining. Secondly the magnitude become steadier from 37579 pixels to 43089 pixels, this is the indication of steady status. After the initial higher order status, in most of the cases a steady status region is observed where very little amount of status takes place, over a period of time. This kind of behavior can be attributed to the smoothening of the micro roughness of the tool resulting in increased contact area between the tool and the work piece. This in turn results in reduced contact pressure due to which, there can be reduction in tool status. Thirdly, the slope of the tool status in turning cycle change from 43089 pixels to 48889 pixels so much so that the point at which the tool insert status (area) begins to rise, another indicator for severe tool worn. After the steady period of status, an increase in status rate is observed in most of the cases until the limiting condition is obtained. During the steady status period, micro roughness of the tool is decreased resulting in better surface finish of the work piece. This causes increased contact area over a period of time, because of the increased rubbing action, contact temperature can increase. At higher temperature, there can be localized melting formation of built up edge. This built up edge also breaks after sometime, carrying a portion of the tool material. Thus with localized fracturing and chipping of the tool, status rate becomes higher which also results in increased roughness of the work piece surface. The maximum slope yield useful results that determine the maximum value of tool area in terms of pixels and would be well correlated to tool status in general. The similar trend was observed for other vision parameters. Cutting tool status stages for machine vision parameters like wear area, perimeter and compactness can be monitored for different cutting condition is shown in the Figure 6 [b] [c] [d], Figure 7 [b] [c] [d] and Figure 8 [b] [c] [d] respectively. The sensitivities of Machine vision parameters in monitoring tool status decrease in the order: wear area, perimeter and compactness.
1846
Y.D. Chethan et al. / Materials Today: Proceedings 2 (2015) 1841 – 1848
[a] Tool wear VS Machining time
[c] Perimeter VS Machining time
[b] Wear area VS Machining time
[d] Compactness VS Machining time
Fig.4: Machine vision parameters with Machining time for various feed rate at speed of 280 RPM and Depth of Cut 0.2 mm
[a] Tool wear VS Machining time
[b] Wear area VS Machining time
Y.D. Chethan et al. / Materials Today: Proceedings 2 (2015) 1841 – 1848
[c] Perimeter VS Machining time
[d] Compactness VS Machining time
Fig. 5: Machine vision parameters with Machining time for various feed rate at speed of 450 RPM and Depth of Cut 0.2 mm
[a] Tool wear VS Machining time
[c] Perimeter VS Machining time
[b] Wear area VS Machining time
[d] Compactness VS Machining time
Fig. 6: Machine vision parameters with Machining time for various feed rate at speed of 710 RPM and Depth of Cut 0.2 mm
1847
1848
Y.D. Chethan et al. / Materials Today: Proceedings 2 (2015) 1841 – 1848
6. Conclusions In this study, the application of image processing using machine vision technology applied for tool and work piece status monitoring were discussed. The digital image processing techniques are very useful for fast and easier visualization of tool status which are very difficult to recognize by other modes. However, a non contact and less costly tool status monitoring can be established with the help of image processing through machine vision. Some established observation from the study is: x Back lighting system and high resolution camera should be utilized to enhance the image capturing capability in tool status monitoring. x Tool status monitoring is done by first capture images of drill bit, extracting image feature before and after cutting using machine vision system. x Tool status monitored using machine vision parameters that is area, perimeter and compactness shows a remarkable similarity with the characteristic three distinct phases depicted on both the status time and area (pixels) time plot. x Better correlation of actual tool wear and estimated tool wear status using machine vision was observed References [1]
S.N. Huang, K.K. Tan, Y.S. Wong, C.W. de Silva, H.L.Goh,W.W.Tan “Tool wear detection and fault diagnosis based on cutting force Monitoring” (2007) 444–451 [2] ]NicolasGuibert, HenriParis, Joe Rech, Christophe Claudin” Identification of thrust force models for vibratory drilling” (2009) 730–738. [3] Martín P. Gómez, Alfredo M. Hey, José E. Ruzzante, Carlos E. D´Attellis”Tool wear evaluation in drilling by acoustic emission” (2010) 819–825 [4] H.Y kim et.al ”Real Time Drill Wear estimation Based On Spindle Motor Power” (2002) 267-273 [5] Kurada and Bradley “a review of machine vision sensors for tool condition monitoring computer in industry, volume34 (1) elsevier-oct1, 1997 [6] J.C. Su, C.K. Huang1, Y.S. Tarng ”Automated Flank Wear measurementof Micro drills Using Machine Vision” (2006) 328–33 [7] Dutta, S., S.K. Pal, S. Mukhopadhyay, and R.Sen. "Application of digital image processing intool condition monitoring: A review", CIRPJournal of Manufacturing Science andTechnology, Vol. 6, Issue 3, 2013, pp. 212-232. [8] Jian Zhou, Qiang Zhou, Liu Yang, Gang Wu, “Acquisition and rendering of characteristic images of the wearSurfaces of running parts within machinery”, Wear, Vol. 265, 2008, pp. 540–545. [9] Y.C.Tas¸an, M.B.de Rooij, D.J.Schipper, “Measurement of wear on asperity level using image-processing techniques”, Wear, Vol. 258, 2005, pp. 83–91. [10] Dimla E. DimlaSnr. “Sensor signals for tool-wear monitoring in metal cutting operations—a review of methods” International Journal of Machine Tools & Manufacture 40 (2000) 1073–1098 [11] R. Teti, K. Jemielniak,G.O’Donnell, D. Dornfeld Advanced monitoring of machining operations CIRP Annals - Manufacturing Technology 59 (2010) 717–73 [12] Y D Chethan H V Ravindra ,“parametric optimization in drilling en8 tool steel and drill wear monitoring using machine vision applied with taguchi technique” Procedia Materials Science 5 ( 2014 ) 1442 – 1449