1 This work is carried out in Alibaba Cloud Computing. Company are mainly designed for performance problems detection at the level of service components.
Magnifier: Online Detection of Performance Problems in Large-Scale Cloud Computing Systems Haibo Mi1, Huaimin Wang1, Gang Yin1, Hua Cai2, Qi Zhou2, Tingtao Sun2, Yangfan Zhou3 1. National Laboratory for Parallel and Distributed Processing, National University of Defense Technology, China 2. Computing Platform, Alibaba Cloud Computing Company, Hangzhou, China 3. Dept. of Computer Science & Engineering, The Chinese Univ. of Hong Kong, Shatin, Hong Kong Abstract In large-scale cloud computing systems, even a simple user request may go through numerous of services that are deployed on different physical machines. As a result, it is a great challenge to online localize the prime causes of performance degradation in such systems. Existing end-to-end request tracing approaches are not suitable for online anomaly detection because their time complexity is exponential in the size of the trace logs. In this paper, we propose an approach, namely Magnifier, to rapidly diagnose the source of performance degradation in large-scale non-stop cloud systems. In Magnifier, the execution path graph of a user request is modeled by a hierarchical structure including component layer, module layer and function layer, and anomalies are detected from higher layer to lower layer separately. In each layer every node is assigned a newly created identifier in addition to the global identifier of the request, which significantly decreases the size of parsing trace logs and accelerates the anomaly detection process. We conduct extensive experiments over a real-world enterprise system (the Alibaba cloud computing platform) providing services for the public. The results show that Magnifier can locate the prime causes of performance degradation more accurately and efficiently1.
1. Introduction In large-scale computing cloud systems, even a simple user request may go through numerous of services that are deployed on different physical machines [14]. When system performance degrades, it is generally a laborintensive task for developers to locate which parts of the system cause such degradation. Especially for some critical non-stop services, fast detection of performance problems becomes even more important to guarantee the user experiences. However, current cloud computing systems generally lack an effective tool for helping developers localize the performance problems. Recent approaches (e.g., [3, 11]) 1
This work is carried out in Alibaba Cloud Computing Company
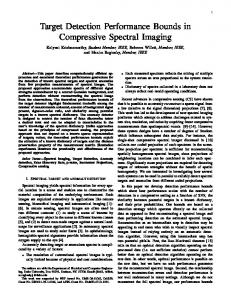
Figure 1. Hierarchical Structure of Requests.
are mainly designed for performance problems detection at the level of service components. Generally, most of time developers not only want to know which service components have problem, but also they need to identify the prime cause of each problem with a finer granularity (e.g., some methods). Unfortunately, the computation complexity will rise dramatically if current approaches are adopted. This is unacceptable for online non-stop cloud computing systems. This paper aims to accelerate the efficiency of locating the performance problems in finer granularity. We notice that a cloud computing system is typically implemented in a hierarchical manner. A system is composed by a lot of service components, each of which is typically encapsulated in a virtual machine (e.g., JVM for systems implemented in Java). Each component contains a lot of modules (e.g., Java packages running in a JVM) and each module can provide a lot of APIs (application programming interfaces), which are in essential methods provided by the module. Hence, we propose to model the trace of a user request as a hierarchical tree with three layers: component layer, module layer and function layer respectively. An example of a hierarchical tree is shown in Fig.1. Based on such a hierarchical tracing structure, we design a tool, namely Magnifier, for online diagnosis of the prime cause of the performance problems for cloud computing systems. Magnifier first compares the behaviors of the components that user requests go through in abnormal period (i.e., when performance degrades) with those in normal period. The component that contributes most to such degradation is found. Magnifier checks the module layer of the abnormal component, and localizes Top K modules which are the
the service components receive the request sequentially. The server threads retrieved by the components from the thread pool don’t use the client _ tid as their unique identifiers, but generate new component _ tids and treat the client _ tid as their father. The server threads set the client _ tid back during their destructing process. Similarly, when a request enters into the module layer, each related module is assigned a unique module _ tid and treats the component _ tid as its father. In the function layer, it is the same as the above two layers. Practically more layers could de designed to detect anomaly with a finer granularity inside the methods. Figure 2. Example of identifier changes in a request flow
dominating cause of the performance degradation. Finally, after applying a principal components analysis [7] to filter out methods with little influence to the performance degradation, Magnifier can locate the methods which are the root cause of the performance degradation of the whole cloud computing system. We verify the effectiveness of Magnifier in the Alibaba cloud computing platform, a real-world enterprise-class cloud computing infrastructure providing services for the public. The experiment results show that compared with the most recent approach [15], our approach can localize the performance problems in a finer granularity much more efficiently. The rest of this paper is organized as follows. Section 2 presents a typical scenario which shows how the unique identifier changes in a request flow. In Section 3, we introduce how to organize the identifiers in different layers belonging to the same request. In Section 4, we elaborate the design of Magnifier. Section 5 presents our experimental studies. We review the related work in Section 6 and conclude this paper in Section 7.
2. Typical Scenario In large-scale cloud computing systems, a typical user operation request (e.g. requirement for saving file) may go through several of components. For instance, in an online file-sharing service, when a user operation request comes, it will invoke a series of components such as user meta index, content index and distributed file system, etc. In each component, multiple of modules are called; and numerous of methods are invoked inside each module. In each layer every node is attached a new unique identifier in addition to the global identifier of the request, as is shown in Fig.1, which helps decrease the complexity of parsing trace logs and accelerates the anomaly detection process. Fig. 2 shows how a unique identifier changes in a request flow. First, a client thread with a global client _ tid asks an operation through RPC call, and then
3. Trace Generating When making the fine-grained measure with instrumentation, we must try to decrease the disturbance to the system performance as much as possible. Just as former researches, such as [14], thread-local storage is used to store the request identifier, which is transmitted between client and server through RPC call. Also timeinterval based and request-number based sampling policies are provided to users. Time-interval sampling policy is to record requests’ latencies in the execution paths at a given time interval, while request numberbased policy is to record the latencies every fixed number of requests.
3.1. Explicit Instrumentation Points Basically, three kinds of interfaces are provided to users for tracing a request, which are TRACE_LOG, TRACE_ID and TRACE_NESTED_ID. TRACE_LOG is used to explicitly add annotations at trace points. The other two are used to generate identifiers. All interfaces are implemented in a way of RAII [12]. RAII is a programming idiom that requires the allocation and deconstruction of resources explicitly. In this way, the microsecond-level timestamps of start time and end time are recorded into trace logs in the constructor and destructor of interfaces respectively. Fig. 3 shows an example of modifying a request identifier and adding an annotation in the component layer. Generally, each component has an entry point which dispatches a request to specific modules depending on the module name that the request asks for. The identifier is impactful in the scope of bracket pair. The only difference between TRACE_NESTED_ID and TRACE_ID is whether to change the request identifier or not. In class of TRACE_NESTED_ID, we stitch different identifiers together which belong to the same request. First, we initialize a new child _ tid in the constructor of TRACE_NESTED_ID and store
1. { 2. TRACE_NESTED_ID(); 3. TRACE_LOG( Description); 4. HandleRequest( ){…...}; 5. } Figure 3. Example of modifying request id and adding an annotation
parent _ tid in a temporary variable. Then as Fig. 4 shows, the child _ tid and parent _ tid are correlated with an explicit log. The structure of “key: value” pair is the same as other non-change trace point, therefore it is transparent to the collector daemon and there is no extra parsing effort. In the end, the parent _ tid is set back during destructing process of the interface when it's scope ends.
3.2. Trace Collection
TRACE _LOG ( ("__trace_parent__", parentID) ("__trace_child__", childID)); Figure 4. Explicitly tag the relationship of two identifiers belonging to the same request
the component cij that a request i passes, and tij represents its response latency. Let α be the latency threshold of the kind of user operation, we can divide the requests to two sets depending on whether the response latency exceeds α . Let NC = {r | r =< (kijm , tij ) >, ∑ j∈N tij ≤ α } be the normal set
AC = {r | r =< (kijm , tij ) >, ∑ j∈N tij > α }
and
be
the
abnormal set. In the component layer requests in the same kind of operations take fixed calling sequences (e.g. content index component could not be accessed to before meta index component in the operation of ReadFile in filesharing service). Hence, the kinds of component cij are the
In Magnifier, trace collecting daemons deployed on each server parse the trace logs at a controlled time interval and dump the extracted properties into a structured database cluster in parallel. The relationship between the parent _ tid and the child _ tid is stored into an index table so that we can efficiently get the data of different layers according to a small set of SQL queries.
deviation from the normal set NC , which respectively represent the normal response latency and the fluctuation range of the component cij . Similarly, the abnormal
4. Problems Detection with Magnifier
response latency and fluctuation range could be represented as M 'j and V j' respectively, which are the
same. Let M j and V j be the mean value and standard
In this section, we make use of the hierarchical structures of request execution paths to detect the system performance problems from the top layer to the bottom layer.
mean value and standard deviation from abnormal set AC . We measure the fluctuation proportion of each component’s response latency to the total processing time through normalization. The normal and abnormal fluctuation ratio of the component cij in the kind of
4.1. Localizing the Abnormal Components
operation m are defined as S j = V j
Generally, each type of user operations has specific performance requirement by operators. For instance, the latency of File Read operations with data size less than 100KB are not allowed to exceed 50 milliseconds. A user operation request is identified as an abnormal if its response latency exceeds the required threshold. By comparing the behavior of components between the problem and non-problem periods, we can quickly localize the components whose performance fluctuates most severely. Note that the failed requests have been filtered out which finish abnormally fast due to some errors. Statistically, they take up less than 0.05% in our experiments. Let N represent the set of components in the system. For a type of user operation m , all of its requests in a given time periods could be obtained from a simple “SELECT” query. According to the client _ tid of each
S =V
request i , a sequence of < (kijm , tij ) >, j ∈ N can be
constructed, where kijm represents the component _ tid of
' j
' j
∑
j∈N
V
' j
∑
j ∈N
Vj
and
respectively. And the normal and
abnormal latency weighing ratio of component cij are defined as Fj = M j
∑
j ∈N
M j and Fj' = M 'j
∑
j ∈N
M 'j
correspondingly. Through ranking the fluctuation extent of each component from the abnormal to normal, we can locate the most abnormal ones. The fluctuation extent of the component is defined as follows: D j = ( F j' / F j ) * ( S 'j / S j )
(1)
It is worth pointing out that the way of localizing the abnormal components is general and could be used to locate the abnormal elements in other layers. The algorithm on localizing the abnormal element is generalized in Table 1.
Table 1. Algorithm of localizing the abnormal elements Algorithm1 1. 2. 3. 4.
Localizing the abnormal element
Compute normal response latency and fluctuation range of each element; Compute abnormal response latency and fluctuation range of each element; Compute fluctuation extent of each element; Rank elements according to the extent.
4.2. Localizing the Abnormal Modules
In the component layer, requests have been divided to the normal set NC and the abnormal set AC according to threshold α . Here, we can use this information to construct corresponding normal and abnormal set of modules. However, requests in module layer may pass different branches. For example, the execution path of ReadFile operation in the content index component may change depending whether the required file is in the cache or not. It becomes meaningless to compare fluctuation extent of requests with different path sequences. Therefore, requests should be grouped together with similar behavior. Because of the requirement for timely detecting problems in the online environment, a fast incremental clustering algorithm is applied (i.e. requests with the same execution paths are grouped together). For each request, all relevant modules could be stitched together through the same father _ tid . The whole process of clustering can be finished by traversing the data one time and the complexity of this clustering algorithm is approximately O ( n) . The resulting clusters are the basis of constructing normal and abnormal sets. We separate each group of requests to normal and abnormal sets depending on whether its father _ tid is in set NC or not. Then fluctuation extent of each module in resulting clusters can be computed and the top K abnormal modules can be selected by adopting algorithm 1. 4.3. Localizing the Abnormal functions
In this layer, we try to localize the functions which dominate the performance fluctuation of their father modules. There are many functions in one module whose execution latencies are quite short comparing with the entire processing time for the user request. Generally, they have minus influence on performance. A typical principal component analysis (PCA) [7] is applied to filter out those functions. Functions are probably recalled many times in once user operation request. For simplicity, all response latencies of the same function in the same request are summed together as its total latency.
Table 2. Principal functions of some modules Module Name Commit Modify Write Read ReadRange
Number of Relevant Functions 35 31 32 37 36
Number of Principal Functions 6 3 5 4 5
The target of PCA is to extract the most influential elements from high dimensional data. PCA is widely adopted in a lot of practical fields, e.g., anomaly detection [4, 8, 22], neural networks [9], etc. It is effective to decrease data dimension and has a linear runtime relationship with the number of feature vectors, which is quite suitable for solving our problems of separate out the principal functions. Extracting principal functions with PCA. Principal functions are those which take up longer response latency. Suppose there are n types of functions invoked by their father module in m times requests. First, we construct a ndimensional column latency ratio vector for each request. Each dimension is defined as yij = rij ∑ rij . rij and ∑ rij represent the response latency of function i
and the sum of response latency in the j -th request, therefore yij represents latency ratio in all relevant functions in the module. Second, we gather all ndimensional column vectors to construct a n × m matrix Y as a function latency ratio matrix, where each column corresponds to one latency ratio vector. Then on basis of matrix Y , PCA captures dominant functions through the diagonalization of the covariance matrix (1 n − 1) YY T . Finally, we can select different numbers of the principal functions according to the variance threshold of data (Be default, we set the threshold to 90%). Table 2 lists the principal functions of some modules in our system, which shows the effectiveness of PCA. The number of the relevant functions is the number of instrumentation points in each module. Averagely in the function layer, there are about 30 instrumented points in each module and the number of principal functions is not more than 4. Localizing the abnormal functions. This is the last step of our approach. After going into the function layer of the abnormal module, we try to find out the abnormal ones from the principal functions. First, principal functions with the same module _ tid are stitched together. Then, we separate them out to normal and abnormal sets and locate the abnormal functions just like what we do in the module layer.
Figure 5. Workloads in the small cluster
Figure 6. Workloads in the large cluster
Figure 7. Disturbance to CPU under different sample rate
Figure 8. Disturbance to Disk Write Rate under different sample rate
5. Evaluation 5.1. Experimental Setup All the following experiments are based on the Alibaba distributed computing platform, which contains a series of service components, e.g. distributed scheduler, storage, communication, monitor, etc. The application we use is a file-sharing service, which is deployed on the distributed computing infrastructure. When operations’ response latency exceeds than the required threshold under the steady load, we try to detect problems of the computing infrastructure. Every result is the average of 10 trials of the experiments. Cluster Size and Workloads. We study the efficiency of Magnifier in two clusters with different sizes, 40 and 100 hosts respectively. The workload of the larger cluster is twice bigger than the smaller one. Two types of user operations are applied, which are SaveFile and ListFile. The workload snapshots of the two clusters are showed as Fig. 5 and 6. Sample Rate and Threshold for Each Operation. Different sampling rates have different influence on the effect and efficiency of the approach. It is beyond the scope of this paper that how to set the proper sample rate adaptively depending on whether the cluster is busy or not. The threshold α for each operation is system-specific.
Magnifier provides an interface for its users to tune the values. In this paper, the values are set by the users according to the data sizes which two operations need to save or read. For simplicity, the sizes of data are constants; hence the threshold of each operation can be got under the help of relative operators.
5.2. Trace Generation Overhead In this section, we compare extra overheads that Magnifier brings to systems under the conditions of different sample rates during generating trace log. The CPU usage and disk write rate without tracing are considered as the benchmark values. Fig. 7 shows the disturbance to CPU usage. The disturbance is measured with the subtract value of CPU usage at different sample rate to the CPU benchmark. We can observe the maximum overhead is below 1% in both clusters, and there is much less influence on the large cluster. The maximum value is below 0.2%, which shows Magnifier has much high scalability. The ratio of disk write rate to the disk benchmark is used to measure the extra overhead of disk write. As Fig. 8 shows, there is averagely 1.3% over disk write rate comparing with not tracing. And the extra overhead decreases significantly as sample rate increases. In the experiment stage, the average disk write rate per physical
machine is about 6MB/s, in that case the extra 80KB/s overhead has little influence to the clusters. In other experiments, we sample one for every 200 requests by default.
5.3. Efficiency of Magnifier In this section we study the efficiency of Magnifier for detecting the abnormal functions in the conditions of different trace log volume. Averagely, the small cluster generates about 3GB log volume per hour (about 12 million lines), whereas the larger one generates 12GB per hour. Magnifier is used to compared with Full Paths Clustering (FPC) proposed in [15], and in order to accelerate the speed of FPC, we refine it with PCA. Table 3 lists the computing time of three approaches with different data volume. From the table, we can conclude that Magnifier has much advantage over FPC no matter applying PCA or not.
5.4. Effectiveness of Magnifier There are many factors which could cause performance degradation in large-scale distributed systems. In this section, we evaluate the effectiveness of Magnifier on basis of two common issues. Both experiments are based on an hour data volume of the two clusters respectively. Failover. In large-scale cloud computing systems, failures are the norm rather than the exception [6]. In case of service inaccessibility, the distributed platform provides perfect failover mechanism. In our experiment, we manually kill one fourth of chunk server services which are used to store files into disks. In this situation, most response latency of SaveFile operations exceeds the given threshold obviously. We use Magnifier to detect which functions are the primary causes. Fig. 9, 10, 11 show the analyzing results of each layer. The components’ fluctuation extents of two clusters are shown as Fig. 9. In this layer both clusters’ distributed file systems are considered as the maximum fluctuation component. Fig. 10 plots the fluctuation extents of four modules which belong to the distributed file system. The modules of CopyFile and Write are used to store the replicas and the original file respectively, which are the primary and secondary factors in both clusters. As Fig. 11 shows, in the function layer of the module of CopyFile, there lists three principal functions and we find the function of WriteBlocks plays a major role of the performance degradation to the operation of SaveFile. Because the left chunk servers suffer more pressures than before, excessive write requests can’t be handled in time. Small files problem. A small file is the one which is significantly smaller than the default block size [13]. Since our distributed file system is built with Hadoop-like
Table 3. Computing time of three approaches Data Volume(GB) 3 6 9 12 15
Magnifier(s) 35 110 351 507 957
FPC With PCA(s) 139 423 1390 ∞ ∞
FPC Without PCA(s) 623 1531 ∞ ∞ ∞
architecture, it is an important factor in Read/Write efficiency of the distributed file systems. In the file-sharing service, all users’ meta information is stored as small files (far less than 64MB). In case of excessive seeks for a user meta data, a mechanism is provided to merge these same files dynamically. In this section, we close this merging operation. Therefore, users’ meta data increase as time goes by, and the response latency of ListFile rises significantly. We use Magnifier to validate whether the function of reading users’ meta data is the primary cause. The experimental results are shown in Fig. 12, 13, 14. Fig. 12 shows the components’ fluctuation extent of two clusters. We observe that the user meta index component has the maximum fluctuation extent in both clusters. In the module layer of the index component, the module of ReadRange is the major cause which is invoked by index component to read data, as is shown in Fig. 13. In Fig. 14, we observe that the function of LookUpPatitions plays a key effect on this performance degradation. LookUpPatitions is the function called by the module of ReadRange to ask for user meta data. The experimental results bear out our supposition. On the whole, the two experiments have three common grounds: (1) in every layer, the prime cause that Magnifier digs out is in accord with each other, which verifies the accuracy of Magnifier; (2) the problems are exposed more sharply in the larger cluster, which indicates Magnifier will become more accurate in larger data sizes (as the above section shows, the data volume of the larger cluster is four times as much as the smaller one in an hour); (3) both functions of Queue and Response in two different modules are the secondary cause of the problems. They are both relevant to module’s Read/Write efficiency. Because of sharing one RPC sequence in a module, when the performance of Read/Write degrades, they suffer a chain influence due to the congestion of the sequence.
6. Related Work Recently, extensive research efforts have been put in detecting performance problems in the areas of high performance computing [16, 18] and large-scale distributed systems [1-3, 5, 10, 11, 14, 17, 19-22]. There are mainly two kinds of solutions, black boxes based schema [1, 4] and instrumentation based schema [2, 3, 11, 14, 15, 19, 20, 22]. This paper belongs to the later.
Figure 9. Deviation distance to normal in component level
Figure 12. Deviation distance to normal in component level
Figure 10. Deviation distance to normal in module level
Figure 13. Deviation distance to normal in module level
Figure 11. Deviation distance to normal in function level
Figure 14. Deviation distance to normal in function level
However, most of instrumentation based researches [1, 5, 15, 19, 20] more cared about trying to monitor system behavior through tracing request instead of diagnosing the problems based on the data collected. Pinpoint [3] traced request call relationship in multilayers of Web service components. The approach adopted a clustering algorithm to group failure and success logs and found out the abnormal components through dependency mining. Magpie [2] used event schema to correlate requests with the same identifier and clustered requests according to the similarity of structure and timing of requests’ paths. Pip [11] depended on users’ expectation to decide whether the request is abnormal or not. Spectroscope [15] used a depth-first traversal to search all possible paths of requests, group them by call structure and find the abnormal requests through comparing the same request behaviors in different time. The common ground of these researches is that they clustered requests with their full execution paths, which has much poor
efficiency especially in large data volume. These works are not suitable to online detection. There are other researches [1, 21] which delicate to online detect performance problems based on black boxes schema. The key disadvantage is that they need more data to train abnormal models offline and the accuracy will decrease significantly in small data sets. Wang et al. [21] proposed a multi-level entropy based approach to online detection. Instead of using individual metric thresholds, they used metric distributions. Similarly, they regarded the cloud computing system with the hierarchy structure; however, this approach still needed historical data to guarantee the accuracy.
7. Conclusion Online performance problems detection is becoming a more and more urgent concern for large-scale 7*24 hour non-stop cloud computing systems to achieve loss
reduction. End to end request tracing is an efficient way for operators to understand and identify the primary cause of performance degradation. In this paper, we propose an approach, namely Magnifier, for online localizing the primary cause of problems. Magnifier makes use of hierarchical structures of systems and effectively detects the performance problems layer by layer separately. We demonstrate by extensive experiments that comparing with existing approaches Magnifier can find the root cause of problems efficiently and accurately. Our work considers the request as abnormal if its response latency exceeds the required threshold. This is generally valid for current services in large-scale cloud systems. But there are still cases that requests finish too quickly because of some errors. We think it is also meaningful to find out why that happens in a finer granularity. Finally, this work is the first step of our research and the near future direction is to assess performance availability and dependability of a cluster in a given scale according to historical abnormal behavior.
[9]
[10]
[11]
[12] [13] [14]
[15]
[16]
Acknowledgment [17]
Many Thanks to ZhenBang Chen, Rui Chu, Bong Ding Xiang Rao for their suggestions on refining an early draft, and the anonymous SCC reviewers for their invaluable feedback. This research is supported by the National Natural Science Foundation of China under Grant No.90818028, No.60625203 and No.60903043, the National 863 Program of China under Grant No.2007AA010301, and the National 973 Program of China under Grant No.2011CB302603.
References [1]
[2]
[3]
[4] [5]
[6] [7] [8]
Agarwala, S. and Schwan, K. SysProf: Online Distributed Behavior Diagnosis through Fine-grain System Monitoring, 2006. Proceedings of the 26th IEEE International Conference on Distributed Computing Systems, 2006, 8-15. Barham, P.; Donnelly, A.; Isaacs, R. and Mortier, R. Using Magpie for request extraction and workload modeling. Proceedings of the 6th conference on Symposium on Opearting Systems Design & Implementation-Volume 6, 2004, 18. Chen, M.; Kiciman, E.; Fratkin, E.; Fox, A. and Brewer, E. Pinpoint: Problem determination in large, dynamic internet services. IEEE Computer Society, 2002. Dunia, R. and Qin, S. Multi-dimensional fault diagnosis using a subspace approach. American Control Conference, 1997. Fonseca, R.; Porter, G.; Katz, R.; Shenker, S. and Stoica, I. X-trace: A pervasive network tracing framework. Networked Systems Design and Implementation, 2007. Ghemawat, S.; Gobioff, H. and Leung, S. The Google file system ACM SIGOPS Operating Systems Review, ACM, 2003, 37, 29-43. Jolliffe, I. Principal component analysis. Wiley Online Library. Lakhina, A.; Crovella, M. and Diot, C. Diagnosing network-wide traffic anomalies. ACM SIGCOMM Computer Communication Review, ACM, 2004, 34, 219-230.
[18]
[19]
[20]
[21]
[22]
Monahan, A. Nonlinear principal component analysis by neural networks: Theory and application to the Lorenz system. Journal of Climate, 2000, 13, 821-835. Ren, G.; Tune, E.; Moseley, T.; Shi, Y.; Rus, S. and Hundt, R. Google-Wide Profiling: A Continuous Profiling Infrastructure for Data Centers. Micro, IEEE, 2010, 30, 65-79. Reynolds, P.; Killian, C.; Wiener, J.; Mogul, J.; Shah, M. and Vahdat, A. Pip: Detecting the unexpected in distributed systems. Symposium on Networked Systems Design and Implementation, 2006, 115-128. RAII.http://en.wikipedia.org/wiki/Resource_Acquisition_Is_Initial ization. Small file problem. http://www.cloudera.com/blog/2009/02/thesmall-files-problem/. Sigelman, B.; Barroso, L.; Burrows, M.; Stephenson, P.; Plakal, M.; Beaver, D.; Jaspan, S. and Shanbhag, C. Dapper, a large-scale distributed systems tracing infrastructure. Technical report dapper2010-1. Google, 2010. Sambasivan, R.; Zheng, A.; Krevat, E.; Whitman, S.; Stroucken, M.; Wang, W.; Xu, L.and Ganger, G. Diagnosing performance changes by comparing system behaviours. Technical Report CMUPDL-10-107. Parallel Data Laboratory, Carnegie Mellon University, July 2010. Shende, S.; Malony, A. and Morris, A. Optimization of instrumentation in parallel performance evaluation tools. Applied Parallel Computing. State of the Art in Scientific Computing, Springer, 2010, 440-449. Tan, J.; Kavulya, S.; Gandhi, R.; Narasimhan, P. Visual, LogBased Causal Tracing for Performance Debugging of MapReduce Systems 2010 International Conference on Distributed Computing Systems, 2010, 795-806. Tallent, N.; Mellor-Crummey, J.; Adhianto, L.; Fagan, M. and Krentel, M. Diagnosing performance bottlenecks in emerging petascale applications. Proceedings of the Conference on High Performance Computing Networking, Storage and Analysis, 2009, 1-11. Thereska, E.; Salmon, B.; Strunk, J.; Wachs, M.; Abd-El-Malek, M.; Lopez, J. and Ganger, G. Stardust: tracking activity in a distributed storage system. ACM SIGMETRICS Performance Evaluation Review, ACM, 2006, 34, 3-14. Thereska, E. and Ganger, G. Ironmodel: Robust performance models in the wild. ACM SIGMETRICS Performance Evaluation Review, ACM, 2008, 36, 253-264. Wang, C.; Talwar, V.; Schwan, K. and Ranganathan, P. Online detection of utility cloud anomalies using metric distributions. Network Operations and Management Symposium (NOMS), 2010 IEEE, 2010, 96-103. Xu, W.; Huang, L.; Fox, A.; Patterson, D. and Jordan, M. Detecting large-scale system problems by mining console logs. Proceedings of the ACM SIGOPS 22nd symposium on Operating systems principles, 2009, 117-132.