Nov 20, 2017 - computation [43]. Thus, Android malware detection is typ- ically performed in a centralized fashion, i.e.
M A M A D ROID: Detecting Android Malware by Building Markov Chains of Behavioral Models (Extended Version)∗ Lucky Onwuzurike1 , Enrico Mariconti1 , Panagiotis Andriotis2 , Emiliano De Cristofaro1 , Gordon Ross1 , and Gianluca Stringhini1
arXiv:1711.07477v1 [cs.CR] 20 Nov 2017
1
University College London
2
University of the West of England
Abstract
lenges compared to desktop/laptop computers: smartphones have limited battery life, making it impossible to use traditional approaches requiring constant scanning and complex computation [43]. Thus, Android malware detection is typically performed in a centralized fashion, i.e., by analyzing apps submitted to the Play Store using Bouncer [40]. However, many malicious apps manage to avoid detection [56, 38], and manufacturers as well as users can install apps that come from third parties, which might not perform any malware checks at all [67]. As a result, the research community has proposed a number of techniques to detect malware on Android. Previous work has often relied on the permissions requested by apps [18, 47], using models built from malware samples. This, however, is prone to false positives, since there are often legitimate reasons for benign apps to request permissions classified as dangerous [18]. Another approach, used by D ROIDAPIM INER [1], is to perform classification based on API calls frequently used by malware. However, relying on the most common calls observed during training prompts the need for constant retraining, due to the evolution of malware and the Android API alike. For instance, “old” calls are often deprecated with new API releases, so malware developers may switch to different calls to perform similar actions. In this paper, we present a novel malware detection system for Android that relies on the sequence of abstracted API calls performed by an app rather than their use or frequency, aiming to capture the behavioral model of the app. We design M A M A D ROID to abstract API calls to either the class name (e.g., java.lang.Throwable) of the call or its package name (e.g., java.lang) or its source (e.g., java, android, google), which we refer to as family. Abstraction provides resilience to API changes in the Android framework as families and packages are added and removed less frequently than single API calls. At the same time, this does not abstract away the behavior of an app: for instance, packages include classes and interfaces used to perform similar operations on similar objects, so we can model the types of operations from the package name alone. For example, the java.io package is used for system I/O and access to the file system, even though there are different classes and interfaces provided by the package for such operations. After abstracting the calls, M A M A D ROID analyzes the sequence of API calls performed by the app aiming to model
As Android becomes increasingly popular, so does malware targeting it, this motivating the research community to propose many different detection techniques. However, the constant evolution of the Android ecosystem, and of malware itself, makes it hard to design robust tools that can operate for long periods of time without the need for modifications or costly re-training. Aiming to address this issue, we set to detect malware from a behavioral point of view, modeled as the sequence of abstracted API calls. We introduce M A M A D ROID, a staticanalysis based system that abstracts app’s API calls to their class, package, or family, and builds a model from their sequences obtained from the call graph of an app as Markov chains. This ensures that the model is more resilient to API changes and the features set is of manageable size. We evaluate M A M A D ROID using a dataset of 8.5K benign and 35.5K malicious apps collected over a period of six years, showing that it effectively detects malware (with up to 0.99 F-measure) and keeps its detection capabilities for long periods of time (up to 0.87 F-measure two years after training). We also show that M A M A D ROID remarkably improves over D ROIDAPIM INER, a state-of-the-art detection system that relies on the frequency of (raw) API calls. Aiming to assess whether M A M A D ROID’s effectiveness mainly stems from the API abstraction or from the sequencing modeling, we also evaluate a variant of it that uses frequency (instead of sequences), of abstracted API calls. We find that it is not as accurate, failing to capture maliciousness when trained on malware samples including API calls that are equally or more frequently used by benign apps.
1
Introduction
Malware running on mobile devices can be particularly lucrative, as it may enable attackers to defeat two-factor authentication for financial and banking systems [52] and/or trigger the leakage of sensitive information [25]. As a consequence, the number of malware samples has skyrocketed in recent years, and, due to its increased popularity, cybercriminals have increasingly targeted the Android ecosystem [15]. Detecting malware on mobile devices presents additional chal∗ A preliminary version of this paper appears in the 24th Network and Distributed System Security Symposium (NDSS 2017) [36].
1
the app’s behavior using Markov chains. Our intuition is that malware may use calls for different operations, and in a different order, than benign apps. For example, android.media.MediaRecorder can be used by any app that has permission to record audio, but the call sequence may reveal that malware only uses calls from this class after calls to getRunningTasks(), which allows recording conversations [65], as opposed to benign apps where calls from the class may appear in any order. Relying on the sequence of abstracted calls allows us to model behavior in a more complex way than previous work, which only looked at the presence or absence of certain API calls or permissions [1, 4], while still keeping the problem tractable [30]. M A M A D ROID then builds a statistical model to represent the transitions between the API calls performed by an app as Markov chains, and use them to extract features. Finally, it classifies an app as either malicious or benign using the features it extracts from the app. We present a detailed evaluation of the classification accuracy (using F-measure, precision, and recall) and runtime performance of M A M A D ROID, using a dataset of almost 44K apps (8.5K benign and 35.5K malware samples). We include a mix of older and newer apps, from October 2010 to May 2016, verifying that our model is robust to changes in Android malware samples and APIs. To the best of our knowledge, this is the largest malware dataset used to evaluate an Android malware detection system in a research paper. Our experimental analysis shows that M A M A D ROID can effectively model both benign and malicious Android apps, and efficiently classify them. Compared to other systems such as D ROIDAPIM INER [1], our approach allows us to account for changes in the Android API, without the need to frequently retrain the classifier. Moreover, to assess the impact of abstraction and Markov chain modeling on M A M A D ROID, we not only compare to D ROIDAPIM INER, but also build a variant (called FAM) that still abstracts API calls but instead of building a model from the sequence of calls it does so on the frequency, similar to D ROIDAPIM INER. Overall, we find that M A M A D ROID can effectively detect unknown malware samples not only in the “present,” (with Fmeasure up to 0.99) but also consistently over the years (i.e., when the system is trained on older samples and evaluated over newer ones), as it keeps an average detection accuracy, evaluated in terms of F-measure, of 0.87 after one year and 0.75 after two years (as opposed to 0.46 and 0.42 achieved by D ROIDAPIM INER [1] and 0.81 and 0.76 by FAM). We also highlight that when the system is not efficient anymore (when the test set is newer than the training set by more than two years), it is as a result of M A M A D ROID having low recall, but maintaining high precision. We also do the opposite, i.e., training on newer samples and verifying that the system can still detect old malware. This is particularly important as it shows that M A M A D ROID can detect newer threats, while still identifying malware samples that have been in the wild for some time.
in a tool called M A M A D ROID, to detect Android malware by abstracting API calls to their class, package, and family, and model the behavior of the apps through the sequences of API calls as Markov chains. Second, we can detect unknown samples on the same year of training with an F-measure of 0.99, but also years after training the system, meaning that M A M A D ROID does not need continuous re-training. Compared to previous work [1], M A M A D ROID achieves higher accuracy with reasonably fast running times, while also being more robust to evolution in malware development and changes in the Android API. Third, by abstracting API calls and using frequency analysis we still perform better than a system that also uses frequency analysis but without abstraction (D ROIDAPIM INER). Finally, we explore the detection performance of a finer-grained abstraction and show that abstracting to classes does not perform better than abstracting to packages. Paper Organization. The rest of the paper is organized as fol-
lows. The next section presents M A M A D ROID, then, Section 3 introduces the datasets used throughout the paper. In Section 4, we evaluate M A M A D ROID in family and package modes, while, in Section 5, we explore the effectiveness of finer-grained abstraction (i.e., class mode). In Section 6, we present and evaluate the variant using a frequency analysis model (FAM), while we analyze runtime performances in Section 7. Section 8 further discusses our results as well as its limitations. After reviewing related work in Section 9, the paper concludes in Section 10.
2
The MaMaDroid System
In this section, we introduce M A M A D ROID, an Android malware detection system that relies on the transitions between different API calls performed by Android apps.
2.1
Overview
M A M A D ROID builds a model of the sequence of API calls as Markov chains, which are in turn used to extract features for machine learning algorithms to classify apps as benign or malicious. Abstraction. M A M A D ROID does not use the raw API calls,
but abstracts each call to its family, package, or class. For instance, the API call getMessage() in Figure 1 is parsed to, respectively, java, java.lang, and java.lang.Throwable. package
z }| { java.lang.Throwable: String getMessage() |{z}
family
|
{z
Class
}
Figure 1: Example of an API call and its family, package, and class.
Given the three different types of abstractions, M A M A D ROID operates in one of three modes, each using one of the types of abstraction. Naturally, we expect that the higher
Summary of Contributions. This paper makes several contri-
butions. First, we introduce a novel approach, implemented 2
?
Call Graph Extraction (1)
Sequence Extraction (2)
Markov Chain Modeling (3)
Classification (4)
Figure 2: Overview of M A M A D ROID operation. In (1), it extracts the call graph from an Android app, next, it builds the sequences of (abstracted) API calls from the call graph (2). In (3), the sequences of calls are used to build a Markov chain and a feature vector for that app. Finally, classification is performed in (4), labeling the app as benign or malicious. package com.fa.c; import import import import import import import
android.content.Context; android.os.Environment; android.util.Log; com.stericson.RootShell.execution.Command; com.stericson.RootShell.execution.Shell; com.stericson.RootTools.RootTools; java.io.File;
public class RootCommandExecutor { public static boolean Execute(Context paramContext) { paramContext = new Command(0, new String[] { "cat " + Environment.getExternalStorageDirectory().getAbsolutePath() + File.separator + Utilities.GetWatchDogName( paramContext) + " > /data/" + Utilities.GetWatchDogName(paramContext), "cat " + Environment.getExternalStorageDirectory().getAbsolutePath() + File.separator + Utilities.GetExecName(paramContext) + " > /data/" + Utilities.GetExecName(paramContext), "rm " + Environment.getExternalStorageDirectory().getAbsolutePath() + File.separator + Utilities.GetWatchDogName(paramContext), "rm " + Environment.getExternalStorageDirectory().getAbsolutePath() + File.separator + Utilities. GetExecName(paramContext), "chmod 777 /data/" + Utilities.GetWatchDogName(paramContext), "chmod 777 /data/" + Utilities.GetExecName(paramContext), "/data/" + Utilities.GetWatchDogName(paramContext) + " " + Utilities.GetDeviceInfoCommandLineArgs(paramContext) + " /data/" + Utilities.GetExecName(paramContext) + " " + Environment.getExternalStorageDirectory().getAbsolutePath() + File.separator + Utilities.GetExchangeFileName(paramContext) + " " + Environment. getExternalStorageDirectory().getAbsolutePath() + File.separator + " " + Utilities.GetPhoneNumber(paramContext) }); try { RootTools.getShell(true).add(paramContext); return true; } catch (Exception paramContext) { Log.d("CPS", paramContext.getMessage()); } return false; } }
Figure 3: Code from a malicious app (com.g.o.speed.memboost) executing commands as root.
the abstraction, the lighter the system is, although possibly less accurate. Building Blocks. M A M A D ROID’s operation goes through four phases, as depicted in Figure 2. First, we extract the call graph from each app by using static analysis (1), then, we obtain the sequences of API calls using all unique nodes after which we abstract each call to class, package, or family (2). Next, we model the behavior of each app by constructing Markov chains from the sequences of API calls for the app (3), with the transition probabilities used as the feature vector to classify the app as either benign or malware using a machine learning classifier (4). In the rest of this section, we discuss each of these steps in detail.
lists a class extracted from the decompiled apk of malware disguised as a memory booster app (with package name com.g.o.speed.memboost), which executes commands (rm, chmod, etc.) as root.1 To ease presentation, we focus on the portion of the code executed in the try/catch block. The resulting call graph of the try/catch block is shown in Figure 4. For simplicity, we omit calls for object initialization, return types and parameters, as well as implicit calls in a method. Additional calls that are invoked when getShell(true) is called are not shown, except for the add() method that is directly called by the program code, as shown in Figure 3.
2.2
In its second phase, M A M A D ROID extracts the sequences of API calls from the call graph and abstract the calls to one of three mode.
2.3
Call Graph Extraction
The first step in M A M A D ROID is to extract the app’s call graph. We do so by performing static analysis on the app’s apk, i.e., the standard Android archive file format containing all files, including the Java bytecode, making up the app. We use a Java optimization and analysis framework, Soot [51], to extract call graphs and FlowDroid [5] to ensure contexts and flows are preserved. To better clarify the different steps involved in our system, we employ, throughout this section, a “running example,” using a real-world malware sample. Figure 3
Sequence Extraction and Abstraction
Sequence Extraction. Since M A M A D ROID uses static analy-
sis, the graph obtained from Soot represents the sequence of functions that are potentially called by the app. However, each execution of the app could take a specific branch of the graph and only execute a subset of the calls. For instance, when running the code in Figure 3 multiple times, the Execute method could be followed by different calls, e.g., getShell() in the try 1 https://www.hackread.com/ghost-push-android-malware/
3
com.fa.c.RootCommandExecutor: Execute()
android.util.Log: d()
com.stericson.RootTools.RootTools: getShell()
java.lang.Throwable: getMessage() com.stericson.RootShell.execution.Shell: add()
com.fa.c.RootCommandExecutor: Execute() [self-defined, self-defined, self-defined]
com.stericson.RootTools.RootTools: getShell() [self-defined, self-defined, self-defined]
com.fa.c.RootCommandExecutor: Execute() [self-defined, self-defined, self-defined]
android.util.Log: d() [android.util.Log, android.util, android]
com.fa.c.RootCommandExecutor: Execute() [self-defined, self-defined, self-defined]
java.lang.Throwable: getMessage() [java.lang.Throwable, java.lang, java]
com.stericson.RootShell. execution.Shell: add() [self-defined, self-defined, self-defined]
Figure 5: Sequence of API calls extracted from the call graphs in Figure 4, with the corresponding class/package/family abstraction in square brackets.
Figure 4: Call graph of the API calls in the try/catch block of Figure 3. (Return types and parameters omitted to ease presentation).
identifier mangling. Overall, there are 11 (9+2) families, 340 (243+95+2) possible packages, and 5,973 (4,855+1,116+2) possible classes.
block only or getShell() and then getMessage() in the catch block. Thus, in this phase, M A M A D ROID operates as follows. First, it identifies a set of entry nodes in the call graph, i.e., nodes with no incoming edges (for example, the Execute method in the snippet from Figure 3 is the entry node if there is no incoming edge from any other call in the app). Then, it enumerates the paths reachable from each entry node. The sets of all paths identified during this phase constitutes the sequences of API calls which will be used to build a Markov chain behavioral model and to extract features. In Figure 5, we show the sequence of API calls obtained from the call graph in Figure 4. We also report in square brackets, the family, package, and class to which the call is abstracted.
2.4
Markov-chain Based Modeling
Next, M A M A D ROID builds feature vectors, used for classification, based on the Markov chains representing the sequences of abstracted API calls for an app. Before discussing this in detail, first review the basic concepts of Markov chains. Markov Chains. Markov Chains are memoryless models where
the probability of transitioning from a state to another only depends on the current state [39]. They are often represented as a set of nodes, each corresponding to a different state, and a set of edges connecting one node to another labeled with the probability of that transition. The sum of all probabilities associated to all edges from any node (including, if present, an edge going back to the node itself) is exactly 1. The set of possible states of the Markov chain is denoted as S. If Sj and Sk are two connected states, Pjk denotes the probability of transition from Sj to Sk . Pjk is given by the number of occurrences (Ojk ) of state Sk after state Sj , divided by Oji O for all states i in the chain, i.e., Pjk = P jkOji .
API Call Abstraction. Rather than analyzing raw API calls
from the sequence of calls, we build M A M A D ROID to work at a higher level, and operate in one of three modes by abstracting each call to its family, package, or class. The intuition is to make M A M A D ROID resilient to API changes and achieve scalability. In fact, our experiments, presented in Section 3, show that, from a dataset of 44K apps, we extract more than 10 million unique API calls, which, depending on the modeling approach used to model each app, may result in the feature vectors being very sparse. When operating in family mode, we abstract an API call to one of the nine Android families, i.e., android, google, java, javax, xml, apache, junit, json, dom, which correspond to the android.*, com.google.*, java.*, javax.*, org.xml.*, org.apache.*, junit.*, org.json, and org.w3c.dom.* packages. Whereas, in package mode, we abstract the call to its package name using the list of Android packages from the documentation2 consisting of 243 packages as of API level 24 (the version as of September 2016), as well as 95 from the Google API.3 In class mode, we abstract each call to its class name using a whitelist of all class names in the Android and Google APIs, which consists respectively, 4,855 and 1116 classes.4 In all modes, we abstract developer-defined (e.g., com.stericson.roottools) and obfuscated (e.g. com.fa.a.b.d) API calls respectively, as self-defined and obfuscated. Note that we label an API call as obfuscated if we cannot tell what its class implements, extends, or inherits, due to
i∈S
Building the model. For each app, M A M A D ROID takes as in-
put the sequence of abstracted API calls of that app (classes, packages or families, depending on the selected mode of operation), and builds a Markov chain where each class/package/family is a state and the transitions represent the probability of moving from one state to another. For each Markov chain, state S0 is the entry point from which other calls are made in a sequence. As an example, Figure 6 illustrates the Markov chains built using classes, packages, and families, respectively, from the sequences reported in Figure 5. We argue that considering single transitions is more robust against attempts to evade detection by inserting useless API calls in order to deceive signature-based systems [33]. In fact, M A M A D ROID considers all possible calls – i.e., all the branches originating from a node – in the Markov chain, so adding calls would not significantly change the probabilities of transitions between nodes (specifically, families, packages, or classes depending on the operational mode) for each app. Feature Extraction. Next, we use the probabilities of tran-
2 https://developer.android.com/reference/packages.html
sitioning from one state (abstracted call) to another in the Markov chain as the feature vector of each app. States that are
3 https://developers.google.com/android/reference/packages 4 https://developer.android.com/reference/classes.html
4
self-defined 0.5
0.25
self-defined
0.25
0.25
java.lang.Throwable android.util.Log
self-defined 0.5
0.5
java.lang
(a)
0.25
android.util
(b)
0.25
0.25
java
android
(c)
Figure 6: Markov chains originating from the call sequence in Figure 5 when using classes (a), packages (b) or families (c).
3
not present in a chain are represented as 0 in the feature vector. The vector derived from the Markov chain depends on the operational mode of M A M A D ROID. With families, there are 11 possible states, thus 121 possible transitions in each chain, while, when abstracting to packages, there are 340 states and 115,600 possible transitions and with classes, there are 5,973 states therefore, 35,676,729 possible transitions.
In this section, we introduce the datasets used in the evaluation of M A M A D ROID (presented later in Section 4), which include 43,940 apk files, specifically, 8,447 benign and 35,493 malware samples. We include a mix of older and newer apps, ranging from October 2010 to May 2016, as we aim to verify that M A M A D ROID is robust to changes in Android malware samples as well as APIs. To the best of our knowledge, we are leveraging the largest dataset of malware samples ever used in a research paper on Android malware detection.
We also apply Principal Component Analysis (PCA) [29], which performs feature selection by transforming the feature space into a new space made of components that are a linear combination of the original features. The first components contain as much variance (i.e., amount of information) as possible. The variance is given as percentage of the total amount of information of the original feature space. We apply PCA to the feature set in order to select the principal components, as PCA transforms the feature space into a smaller one where the variance is represented with as few components as possible, thus considerably reducing computation/memory complexity. Also, PCA could improve the accuracy of the classification by removing, from the feature space, features that make the classifier perform worse.
2.5
Dataset
Benign Samples. Our benign datasets consist of two sets of
samples: (1) one, which we denote as oldbenign, includes 5,879 apps collected by PlayDrone [54] between April and November 2013, and published on the Internet Archive5 on August 7, 2014; and (2) another, newbenign, obtained by downloading the top 100 apps in each of the 29 categories on the Google Play store as of March 7, 2016, using the googleplay-api tool.6 Due to errors encountered while downloading some apps, we have actually obtained 2,843 out of 2,900 apps. Note that 275 of these belong to more than one category, therefore, the newbenign dataset ultimately includes 2,568 unique apps. Android Malware Samples. The set of malware samples in-
Classification
cludes apps that were used to test D REBIN [4], dating back to October 2010 – August 2012 (5,560), which we denote as drebin, as well as more recent ones that have been uploaded on the VirusShare7 site over the years. Specifically, we gather from VirusShare, respectively, 6,228, 15,417, 5,314, and 2,974 samples from 2013, 2014, 2015, and 2016. We consider each of these datasets separately for our analysis.
The last step is to perform classification, i.e., labeling apps as either benign or malware. To this end, we test M A M A D ROID using different classification algorithms: Random Forests, 1Nearest Neighbor (1-NN), 3-Nearest Neighbor (3-NN), and Support Vector Machines (SVM). Note that since both accuracy and speed are worse with SVM, we omit results obtained with it.
API Calls. For each app, we extract all API calls, using An-
droguard8 , since, as explained in Section 4.5, these constitute the features used by D ROIDAPIM INER [1] (against which we compare our system) as well as a variant of M A M A D ROID that is based on frequency analysis (see Section 6). Due to Androguard failing to decompress some of the apks, bad CRC-32 redundancy checks, and errors during unpacking, we are not able to extract the API calls for all the samples, but only for
Each model is trained using the feature vector obtained from the apps in a training sample. Results are presented and discussed in Section 4, and have been validated by using 10-fold cross validation. Also note that, due to the different number of features used in different modes, we use two distinct configurations for the Random Forests algorithm. Specifically, when abstracting to families, we use 51 trees with maximum depth 8, while, with classes and packages, we use 101 trees of maximum depth 64. To tune Random Forests we follow the methodology applied in [6].
5 https://archive.org/details/playdrone-apk-e8 6 https://github.com/egirault/googleplay-api 7 https://virusshare.com/ 8 https://github.com/androguard/androguard
5
Category
Name
Date Range
#Samples
Benign
oldbenign newbenign
Apr 2013 – Nov 2013 Mar 2016 – Mar 2016 Total Benign:
Malware
drebin 2013 2014 2015 2016
Oct 2010 – Aug 2012 Jan 2013 – Jun 2013 Jun 2013 – Mar 2014 Jan 2015 – Jun 2015 Jan 2016 – May 2016 Total Malware:
5,879 2,568 8,447
#Samples (API Calls) 5,837 2,565 8,402
#Samples (Call Graph) 5,572 2,465 8,037
5,560 6,228 15,417 5,314 2,974 35,493
5,546 6,146 14,866 5,161 2,802 34,521
5,512 6,091 13,804 4,451 2,555 32,413
1.0
0.8
0.8
0.6
0.6
0.4 0.2 0.00
10000
20000
#API Calls (a) API calls
2015 newbenign oldbenign drebin 2013 2014 2016
30000
40000
1.0
2016 2015 2014 2013 drebin newbenign oldbenign
0.8 0.6 CDF
1.0
CDF
CDF
Table 1: Overview of the datasets used in our experiments.
0.4
0.4
0.2
0.2
0.0 0.0
0.2
0.4 0.6 Fraction of Calls
(b) android
0.8
1.0
0.0 0.0
0.2
0.4 0.6 Fraction of Calls
2016 2015 2014 2013 drebin newbenign oldbenign 0.8 1.0
(c) google
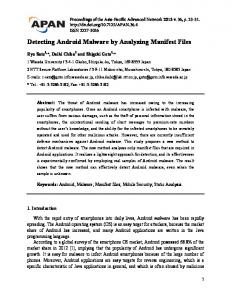
Figure 7: CDFs of the number of API calls per app in each dataset (a), and of the percentage of android (b) and google (c) family calls.
ure 7(b)), both in benign and malicious datasets, while google calls become more common in newer apps (Figure 7(c)). In general, we conclude that benign and malicious apps show the same evolutionary trends over the years. Malware, however, appears to reach the same characteristics (in terms of level of complexity and fraction of API calls from certain families) as legitimate apps with a few years of delay.
40,923 (8,402 benign, 34,521 malware) out of the 43,940 apps in our datasets. Call Graphs. To extract the call graph of each apk, we use Soot. Note that for some of the larger apks, Soot requires a non-negligible amount of memory to extract the call graph, so we allocate 16GB of RAM to the Java VM heap space. We find that for 2,472 (364 benign + 2,108 malware) samples, Soot is not able to complete the extraction due to it failing to apply the jb phase as well as reporting an error in opening some zip files (i.e., the apk). The jb phase is used by Soot to transform Java bytecode into jimple intermediate representation (the primary IR of Soot) for optimization purposes. Therefore, we exclude these apps in our evaluation and discuss this limitation further in Section 8.3. In Table 1, we provide a summary of our seven datasets, reporting the total number of samples per dataset, as well as those for which we are able to extract the API calls (second-to-last column) and the call graphs (last column). Dataset Characterization. Aiming to shed light on the evolution of API calls in Android apps, we also performed some measurements over our datasets. In Figure 7(a), we plot the Cumulative Distribution Function (CDF) of the number of unique API calls in the apps in different datasets, highlighting that newer apps, both benign and malicious, use more API calls overall than older apps. This indicates that as time goes by, Android apps become more complex. When looking at the fraction of API calls belonging to specific families, we discover some interesting aspects of Android apps developed in different years. In particular, we notice that API calls to the android family become less prominent as time passes (Fig-
Principal Component Analysis. Finally, we apply PCA to se-
lect the two most important PCA components. We plot and compare the positions of the two components for benign (Figure 8(a)) and malicious samples (Fig. 8(b)). As PCA combines the features into components, it maximizes the variance of the distribution of samples in these components, thus, plotting the positions of the samples in the components shows that benign apps tend to be located in different areas of the components space, depending on the dataset, while malware samples occupy similar areas but with different densities. These differences highlight a different behavior between benign and malicious samples, and these differences should also be found by the machine learning algorithms used for classification.
4
M A M A D ROID Evaluation
We now present an experimental evaluation of M A M A D ROID run in family and package mode. Later in Section 5, we evaluate it in class mode. We use the datasets summarized in Table 1, and evaluate M A M A D ROID, as per (1) its accuracy on benign and malicious samples developed around the same 6
1.0
0.8
0.8
0.6
0.6
0.4
0.4
0.2
0.2
PCA2
PCA2
1.0
0.0
0.0
0.2
0.2
0.4
0.4
0.6 0.8 1.0
0.5
0.0
PCA1
0.5
1.0
0.6
oldbenign newbenign
0.8 1.0
1.5
(a) benign
0.5
0.0
PCA1
0.5
1.0
drebin 2013 2014 2015 2016
1.5
(b) malware
Figure 8: Positions of benign vs malware samples in the feature space of the first two components of the PCA (family mode).
time; and (2) its robustness to the evolution of malware as well as of the Android framework by using older datasets for training and newer ones for testing and vice-versa.
4.1
smaller one. When operating in package mode, PCA could be particularly beneficial to reduce computation and memory complexity, since M A M A D ROID originally has to operate over 116,281 features. Hence, in Table 2 we report the precision, recall, and F-measure achieved by M A M A D ROID in both modes with and without the application of PCA using Random Forest classifier. We report the results for Random Forest only because it outperforms both 1-NN and 3-NN (Figure 9) while also being very fast. In package mode, we find that only 67% of the variance is taken into account by the 10 most important PCA components, and, in family mode, at least 91% of the variance is included by the 10 PCA Components. As shown in Table 2, the F-measure using PCA is only slightly lower (up to 3%) than using the full feature set. In general, M A M A D ROID performs better in package mode in all datasets with F-measure ranging from 0.92 – 0.99 compared to 0.88 – 0.98 in family mode. This is as a result of the increased granularity which enables M A M A D ROID identify more differences between benign and malicious apps. On the other hand, however, this likely reduces the efficiency of the system, as many of the states derived from the abstraction are used only a few times. The differences in time performance between the two modes are analyzed in details in Section 7.
Experimental Settings
To assess the accuracy of the classification, we use the standard F-measure metric, calculated as F = 2 · (precision · recall)/(precision + recall), where precision = TP/(TP+FP) and recall = TP/(TP+FN). TP denotes the number of samples correctly classified as malicious, while FP an FN indicate, respectively, the number of samples mistakenly identified as malicious and benign. Note that all our experiments perform 10-fold cross validation using at least one malicious and one benign dataset from Table 1. In other words, after merging the datasets, the resulting set is shuffled and divided into ten equal-size random subsets. Classification is then performed ten times using nine subsets for training and one for testing, and results are averaged out over the ten experiments. When implementing M A M A D ROID in family mode, we exclude json and dom families because they are almost never used across all our datasets, and junit, which is primarily used for testing. In package mode, in order to avoid mislabeling when self-defined APIs have “android” in the name, we split the android package into its two classes, i.e., android.R and android.Manifest. Therefore, in family mode, there are 8 possible states, thus 64 features, whereas, in package mode, we have 341 states and 116,281 features (cf. Section 2.4).
4.2
4.3
Detection Over Time
As Android evolves over the years, so do the characteristics of both benign and malicious apps. Such evolution must be taken into account when evaluating Android malware detection systems, since their accuracy might significantly be affected as newer APIs are released and/or as malicious developers modify their strategies in order to avoid detection. Evaluating this aspect constitutes one of our research questions, and one of the reasons why our datasets span across multiple years (2010– 2016). Recall that M A M A D ROID relies on the sequence of API calls extracted from the call graphs and abstracted to either the package or the family level. Therefore, it is less susceptible to changes in the Android API than other classification systems such as D ROIDAPIM INER [1] and D REBIN [4]. Since these rely on the use, or the frequency, of certain API calls to
M A M A D ROID’s Performance (Family and Package Mode)
We start by evaluating the performance of M A M A D ROID when it is trained on dataset from the same year. In Figure 9, we plot the F-measure achieved by M A M A D ROID in family and package modes using datasets from the same year for training and testing and the three different classifiers. As already discussed in Section 2.4, we apply PCA as it allows us transform a large feature space into a 7
1.0
RF 1-NN 3-NN
0.8
0.8
0.6
0.6
F-measure
F-measure
1.0
0.4 0.2 0.0
RF 1-NN 3-NN
0.4 0.2
Drebin & OldBenign
2013 & OldBenign
2014 & OldBenign
2014 & Newbenign
2015 & Newbenign
0.0
2016 & Newbenign
Drebin & OldBenign
(a) family mode
2013 & OldBenign
2014 & OldBenign
2014 & Newbenign
2015 & Newbenign
2016 & Newbenign
(b) package mode
Figure 9: F-measure of M A M A D ROID classification with datasets from the same year using three different classifiers.
XXX X Mode Dataset XXX X drebin, oldbenign 2013, oldbenign 2014, oldbenign 2014, newbenign 2015, newbenign 2016, newbenign
0.82 0.91 0.88 0.97 0.89 0.87
Family 0.95 0.93 0.96 0.99 0.93 0.91
0.88 0.92 0.92 0.98 0.91 0.89
0.95 0.98 0.93 0.98 0.93 0.92
[Precision, Recall, F-measure] Package Family (PCA) 0.97 0.96 0.84 0.92 0.88 0.95 0.97 0.93 0.90 0.92 0.97 0.95 0.87 0.94 0.90 1.00 0.99 0.96 0.99 0.97 0.98 0.95 0.87 0.93 0.90 0.92 0.92 0.86 0.88 0.87
Package (PCA) 0.94 0.95 0.94 0.97 0.95 0.96 0.92 0.96 0.94 0.97 1.00 0.99 0.91 0.97 0.94 0.88 0.89 0.89
Table 2: Precision, Recall, and F-measure obtained by M A M A D ROID when trained and tested with dataset from the same year in package and family mode, using Random Forests, and with and without PCA.
classify malware vs benign samples, they need to be retrained following new API releases. On the contrary, retraining is not needed as often with M A M A D ROID, since families and packages represent more abstract functionalities that change less over time. Consider, for instance, the android.os.health package: released with API level 24, it contains a set of classes helping developers track and monitor system resources.9 Classification systems built before this release – as in the case of D ROIDAPIM INER [1] (released in 2013, when Android API was up to level 20) – need to be retrained if this package is more frequently used by malicious apps than benign apps, while M A M A D ROID only needs to add a new state to its Markov chain when operating in package mode, while no additional state is required when operating in family mode.
when classifying future samples and using drebin (with samples from 2010 to 2012) or 2013 as the malicious training set and oldbenign (late 2013/early 2014) as the benign training set. More specifically, we observe that M A M A D ROID correctly detects benign apps, while it starts missing true positives and increasing false negatives – i.e., achieving lower recall. Newer training, older testing. We also set to verify whether
older malware samples can still be detected by the system— if not, this would obviously become vulnerable to older (and possibly popular) attacks. Therefore, we also perform the “opposite” experiment, i.e., training M A M A D ROID with newer benign (March 2016) and malware (early 2014 to mid 2016) datasets, and checking whether it is able to detect malware developed years before. Specifically, Figure 11(a) and 11(b) report results when training M A M A D ROID with samples from a given year, and testing it with others that are up to 4 years older: M A M A D ROID retains similar F-measure scores over the years. Specifically, in family mode, it varies from 0.93 to 0.96, whereas, in package mode, from 0.95 to 0.97 with the oldest samples.
Older training, newer testing. To verify this hypothesis, we test
M A M A D ROID using older samples as training sets and newer ones as test sets. Figure 10(a) reports the average F-measure of the classification in this setting, with M A M A D ROID operating in family mode. The x-axis reports the difference in years between training and test malware data. We obtain 0.86 F-measure when we classify apps one year older than the samples on which we train. Classification is still relatively accurate, at 0.75, even after two years. Then, from Figure 10(b), we observe that the average F-measure does not significantly change when operating in package mode. Both modes of operations are affected by one particular condition, already discussed in Section 3: in our models, benign datasets seem to “anticipate” malicious ones by 1–2 years in the way they use certain API calls. As a result, we notice a drop in accuracy
4.4
Case Studies of False Positives and Negatives
The experiment analysis presented above show that M A M A D ROID detects Android malware with high accuracy. As in any detection system, however, the system makes a small number of incorrect classifications, incurring some false positives and false negatives. Next, we discuss a few case studies aiming to better understand these misclassifications. We focus on the experiments with newer datasets, i.e., 2016 and
9 https://developer.android.com/reference/android/os/health/
package-summary.html
8
1.0 0.8 0.6 0.4 0.2 0.0
RF 1-NN 3-NN
0.8
F-measure
F-measure
1.0
RF 1-NN 3-NN
0.6 0.4 0.2
0
1
2 Years
3
0.0
4
0
1
(a) family mode
2 Years
3
4
(b) package mode
1.0
1.0
0.8
0.8
0.6
0.6
F-measure
F-measure
Figure 10: F-measure achieved by M A M A D ROID using older samples for training and newer samples for testing. The x-axis shows the difference in years between the training and test data.
0.4 0.2 0.0
0.2
RF 1-NN 3-NN 0
1
2 Years
3
0.4
0.0
4
RF 1-NN 3-NN 0
(a) family mode
1
2 Years
3
4
(b) package mode
Figure 11: F-measure achieved by M A M A D ROID using newer samples for training and older samples for testing. The x-axis shows the difference in years between the training and test data.
45% of M A M A D ROID’s false negatives are adware, typically, repackaged apps in which the advertisement library has been substituted with a third-party one, which creates a monetary profit for the developers. Since they are not performing any clearly malicious activity, M A M A D ROID is unable to identify them as malware. Finally, we find that 16% of the false negatives reported by M A M A D ROID are samples sending text messages or starting calls to premium services. We also do a similar analysis of false negatives when abstracting to packages (74 samples), with similar results: there a few more adware samples (53%), but similar percentages for potentially benign apps (15%) and samples sending SMSs or placing calls (11%).
newbenign. False Positives. We analyze the manifest of 164 apps mistak-
enly detected as malware by M A M A D ROID, finding that most of them use “dangerous” permissions [3]. In particular, 67% write to external storage, 32% read the phone state, and 21% access the device’s fine location. We further analyzed apps (5%) that use the READ SMS and SEND SMS permissions, i.e., even though they are not SMS-related apps, they can read and send SMSs as part of the services they provide to users. In particular, a “in case of emergency” app is able to send messages to several contacts from its database (possibly added by the user), which is a typical behavior of Android malware in our dataset, ultimately leading M A M A D ROID to flag it as malicious.
4.5
False Negatives. We also check 114 malware samples missed
M A M A D ROID vs D ROIDAPIM INER
We also compare the performance of M A M A D ROID to previous work using API features for Android malware classification, specifically, to D ROIDAPIM INER [1], because: (i) it uses API calls and its parameters to perform classification; (ii) it reports high true positive rate (up to 97.8%) on almost 4K malware samples obtained from McAfee and G ENOME [66], and 16K benign samples; and (iii) its source code has been
by M A M A D ROID when operating in family mode, using VirusTotal.10 We find that 18% of the false negatives are actually not classified as malware by any of the antivirus engines used by VirusTotal, suggesting that these are actually legitimate apps mistakenly included in the VirusShare dataset. 10 https://www.virustotal.com
9
made available to us by the authors.
the future and past respectively. Likewise, we use the same datasets for M A M A D ROID, with the best results achieved on the same dataset as D ROIDAPIM INER. In package mode, M A M A D ROID achieves an F-measure of 0.99 which is maintained more than two years into the past, but drops to respectively, 0.85 and 0.81 one and two years into the future As summarized in Table 3, M A M A D ROID achieves significantly higher performance than D ROIDAPIM INER in all but one experiment. This case occurs when the malicious training set is much older than the malicious test set.
In D ROIDAPIM INER, permissions that are requested more frequently by malware samples than by benign apps are used to perform a baseline classification. Then, the system also applies frequency analysis on the list of API calls after removing API calls from ad libraries, using the 169 most frequent API calls in the malware samples (occurring at least 6% more in malware than benign samples). Finally, data flow analysis is applied on the API calls that are frequent in both benign and malicious samples, but do not occur by at least 6% more in the malware set. Using the top 60 parameters, the 169 most frequent calls change, and authors report a precision of 97.8%.
5
After obtaining D ROIDAPIM INER’s source code, as well as a list of packages (i.e., ad libraries) used for feature refinement, we re-implement the system by modifying the code in order to reflect recent changes in Androguard (used by D ROIDAPIM INER for API call extraction), extract the API calls for all apps in the datasets listed in Table 1, and perform a frequency analysis on the calls. Recall that Androguard fails to extract calls for about 2% (1,017) of apps, thus D ROIDAPIM INER is evaluated over the samples in the second-to-last column of Table 1. We also implement classification, which is missing from the code provided by the authors, using k-NN (with k=3) since it achieves the best results according to the paper. We use 2/3 of the dataset for training and 1/3 for testing as implemented by the authors.
Finer-grained Abstraction
In Section 4, we have showed that building models from abstracted API calls allows M A M A D ROID to obtain high accuracy, as well as to retain it over the years, which is crucial due to the continuous evolution of the Android ecosystem. Our experiments have focused on operating M A M A D ROID in family and package mode (i.e., abstracting calls to family or package). In this section, we investigate whether a finer-grained abstraction – namely, to classes – performs better in terms of detection accuracy. Recall that our system performs better in package mode than in family mode due to the system using in the former, finer and more features to distinguish between malware and benign samples, so we set to verify whether one can trade-off higher computational and memory complexities for better accuracy. To this end, as discussed in Section 2.3, we abstract each API call to its corresponding class name using a whitelist of all classes in the Android API, which consists of 4,855 classes (as of API level 24), and in the Google API, with 1,116 classes, plus self-defined and obfuscated.
In Table 3, we report the results of D ROIDAPIM INER compared to M A M A D ROID on different combination of datasets. Specifically, we report results for experiments similar to those carried out in Section 4.3 as we evaluate its performance on dataset from the same year and over time. First, we train it using older dataset composed of oldbenign combined with one of the three oldest malware datasets each (drebin, 2013, and 2014), and test on all malware datasets. Testing on all datasets ensures the model is evaluated on dataset from the same year and newer. With this configuration, the best result (with 2014 and oldbenign as training sets) is 0.62 F-measure when tested on the same dataset. The F-measure drops to 0.33 and 0.39, respectively, when tested on samples one year into the future and past. If we use the same configurations in M A M A D ROID, in package mode, we obtain up to 0.97 Fmeasure (using 2013 and oldbenign as training sets), dropping to 0.73 and 0.94 respectively, one year into the future and into the past. For the datasets where D ROIDAPIM INER achieves its best result (i.e., 2014 and oldbenign), M A M A D ROID achieves an F-measure of 0.95, which drops to respectively, 0.78 and 0.93 one year into the future and the past. The F-measure is stable even two years into the future and the past at 0.75 and 0.92 respectively. As a second set of experiments, we train D ROIDAPIM INER using a dataset composed of newbenign (March 2016) combined with one of the three most recent malware datasets each (2014, 2015, and 2016). Again, we test D ROIDAPIM INER on all malware datasets. The best result is obtained with the dataset (2014 and newbenign) used for both testing and training, yielding a F-measure of 0.92, which drops to 0.67 and 0.75 one year into
5.1
Reducing the size of the problem
Since there are 5,973 classes, processing the Markov chain transitions that results in this mode increases the memory requirements. Therefore, to reduce the complexity, we cluster classes based on their similarity. To this end, we build a cooccurrence matrix that counts the number of times a class is used with other classes in the same sequence in all datasets. More specifically, we build a co-occurrence matrix C, of size (5,973·5,973)/2, where Ci,j denotes the number of times the ith and the j-th class appear in the same sequence, for all apps in all datasets. From the co-occurrence matrix, we compute the y ·y x, y ) = ||xxx||·||y cosine similarity (i.e., cos(x y || ), and use k-means to cluster the classes based on their similarity into 400 clusters and use each cluster as the label for all the classes it contains. Since we do not cluster classes abstracted to self-defined and obfuscated, we have a total of 402 labels.
5.2
Class Mode Accuracy
In Table 4, we report the resulting F-measure in class mode using the above clustering approach. Once again, we also report the corresponding results from package mode for comparison 10
drebin, oldbenign Training Sets Droid MaMa drebin & oldbenign 0.32 0.96 2013 & oldbenign 0.33 0.94 2014 & oldbenign 0.36 0.92 drebin, newbenign Training Sets Droid MaMa 2014 & newbenign 0.76 0.98 2015 & newbenign 0.68 0.97 2016 & newbenign 0.33 0.96
2013, oldbenign Droid MaMa 0.35 0.95 0.36 0.97 0.39 0.93 2013, newbenign Droid MaMa 0.75 0.98 0.68 0.97 0.35 0.98
Testing Sets 2014, oldbenign Droid MaMa 0.34 0.72 0.35 0.73 0.62 0.95 2014, newbenign Droid MaMa 0.92 0.99 0.69 0.99 0.36 0.98
2015, oldbenign Droid MaMa 0.30 0.39 0.31 0.37 0.33 0.78 2015, newbenign Droid MaMa 0.67 0.85 0.77 0.95 0.34 0.92
2016, oldbenign Droid MaMa 0.33 0.42 0.33 0.28 0.37 0.75 2016, newbenign Droid MaMa 0.65 0.81 0.65 0.88 0.36 0.92
Table 3: Classification performance of D ROIDAPIM INER (Droid) [1] vs M A M A D ROID (MaMa) in package mode using Random Forest.
PP Mode P Dataset PP P
drebin, oldbenign 2013, oldbenign 2014, oldbenign 2014, newbenign 2015, newbenign 2016, newbenign
0.95 0.98 0.93 0.98 0.93 0.91
[Precision, Recall, F-measure] Class Package 0.97 0.96 0.95 0.97 0.95 0.97 0.98 0.95 0.97 0.95 0.93 0.97 1.00 0.99 0.98 1.00 0.98 0.95 0.93 0.98 0.92 0.92 0.92 0.92
when the training samples are two years newer, M A M A D ROID achieves an F-measure of 0.99, 0.97, and 0.95 respectively, in class, package, and family modes. Whereas, when they are three years newer, the F-measure is respectively, 0.97, 0.97, and 0.96 in class, package, and family modes.
0.96 0.97 0.95 0.99 0.95 0.92
Table 4: M A M A D ROID’s Precision, Recall, and F-measure when trained and tested on dataset from the same year using Random Forests and API calls abstracted to classes and packages.
6
M A M A D ROID mainly relies on (1) API call abstraction, and (2) behavioral modeling via sequence of calls. As shown, it outperforms state-of-the-art Android detection techniques, such as D ROIDAPIM INER [1], that are based on the frequency of non-abstracted API calls. In this section, we aim to assess whether M A M A D ROID’s effectiveness mainly stems from the API abstraction, or from the sequence modeling. To this end, we implement and evaluate a variant that uses frequency, rather than sequences, of abstracted API calls. More precisely, we perform frequency analysis on the API calls extracted using Androguard after removing ad libraries, as also done in D ROIDAPIM INER. In the rest of the section, we denote this variant as FAM (Frequency Analysis Model). We again use the datasets in Table 1 to evaluate FAM’s accuracy when training and testing on datasets from the same year and from different years. We also evaluate how it compares to standard M A M A D ROID. Although we have also implemented FAM in class mode, we do not discuss/report results here due to space limitation.
(cf Section 4.2). Overall, we find that class abstraction does not provide significantly higher accuracy. In fact, compared to package mode, abstraction to classes only yields an average increase in F-measure of 0.0012.
5.3
Frequency Analysis Model (FAM)
Detection over time
We also compare accuracy when M A M A D ROID is trained and tested on dataset from different years (Figure 12). We find that, when M A M A D ROID operates in class mode, it achieves an F-measure of 0.95 and 0.99, respectively, when trained with datasets one and two years newer than the test sets, as reported in Figure 12(a)). Likewise, when trained on datasets one and two years older than the test set, F-measure reaches 0.84 and 0.59, respectively (see Figure 12(b)). Overall, comparing results from Figure 10 to Figure 12(b), we find that finer-grained abstraction actually performs worse with time when older samples are used for training and newer for testing. We note that this is due to a possible number of reasons: 1) newer classes or packages in recent API releases cannot be captured in the behavioral model of older tools whereas, families are; and 2) evolution of malware either as a result of changes in the API or patching of vulnerabilities or presence of newer vulnerabilities that allows for stealthier malicious activities. On the contrary, Figure 11 and 12(a) show that finer-grained abstraction performs better when the training samples are more recent than the test samples. This is because from recent samples, we are able to capture the full behavioral model of older samples. However, our results indicate there is a threshold for the level of abstraction which when exceeded, finer-grained abstraction will not yield any significant improvement in detection accuracy. This is because API calls in older releases are subsets of subsequent releases. For instance,
6.1
FAM Accuracy
We start our evaluation by measuring how well FAM detects malware by training and testing using samples that are developed around the same time. Figure 13 reports the F-measure achieved in family and package modes using three different classifiers. Also, Table 5 reports precision, recall, and Fmeasure achieved by FAM on each dataset combination, when operating in family and package mode, using Random Forests. We only report the results from the Random Forest classifier because it outperforms both the 1-NN and 3-NN classifiers. Family mode. Due to the number of possible families (i.e.,
11), FAM builds a model from all families that occur more in our malware dataset than the benign dataset. Note that in this modeling approach, we also remove the junit family as it is mainly used for testing. When the drebin and 2013 mal11
1.0
0.8
0.8
0.6
0.6
F-measure
F-measure
1.0
0.4 0.2 0.0
0
Class Package
0.4 0.2
Class Package
1
2
3
Years
0.0
4
0
1
(a) Newer/Older
2
Years
3
4
(b) Older/Newer
Figure 12: F-measure achieved by M A M A D ROID in class mode when using newer (older) samples for training and older (newer) samples for testing. The x-axis shows the difference in years between the training and test data.
0.6 0.4 0.2
0.6 0.4 0.2
Drebin & 2013 & 2014 & 2014 & 2015 & 2016 & OldBenign OldBenign OldBenign Newbenign Newbenign Newbenign
(a) family mode
0.0
1.0
RF 1-NN 3-NN
0.8
F-measure
F-measure
0.8
0.0
1.0
RF 1-NN 3-NN
RF 1-NN 3-NN
0.8
F-measure
1.0
0.6 0.4 0.2
Drebin & 2013 & 2014 & 2014 & 2015 & 2016 & OldBenign OldBenign OldBenign Newbenign Newbenign Newbenign
(b) package mode
0.0
Drebin & 2013 & 2014 & 2014 & 2015 & 2016 & OldBenign OldBenign OldBenign Newbenign Newbenign Newbenign
(c) class mode
Figure 13: F-measure for the FAM variant, over same-year datasets, with different classifiers.
ware datasets are used in combination with the oldbenign dataset, there are no families that are more frequently used in these datasets than the benign dataset. As a result, FAM does not yield any result with these datasets as it builds a model only from API calls that are more frequently used in malware than benign samples. With the other datasets, there are two (2016), four (2014), and five families (2015) that occur more frequently in the malware dataset than the benign one.
Classification performance improves in package mode, with F-measure ranging from 0.53 with 2016 and newbenign to 0.89 with 2014 and newbenign, using Random Forests. Figure 13(b) shows that Random Forests generally provides better results also in this case. Similar to family mode, the drebin and 2013 datasets respectively, have only five and two packages that occur more than in the oldbenign dataset. Hence, the results when these datasets are evaluated is poor due to the limited amount of features.
From Figure 13(a), we observe that F-measure is always at least 0.5 with Random Forests, and, when tested on the 2014 (malware) dataset, it reaches 0.87. In general, lower Fmeasures are due to increased false positives. This follows a similar trend observed in Section 4.3.
Class mode. When FAM operates in class mode, we build a
model using the minimum of, all API calls that occur more frequently in malware than benign samples or the top 336 API calls that occur more in malware than benign apps. We use the top 336 classes so as to build a model with classes from at least two different packages as the highest number of classes in a single package (java.util) is 335. In our datasets, there is at least three classes that occur more in malware (2013) than benign samples and at most, 862 classes that occur more frequently in malware (2015) than the benign dataset.
When FAM operates in package mode, it builds a model using the minimum of, all API calls that occur more frequently in malware or the top 172 API calls used more frequently in malware than benign apps. We use the top 172 API calls as we attempt to build the model where possible, with packages from at least two families (the android family has 171 packages). In our dataset, there are at least two (2013) and at most 39 (2016) packages that are used more frequently in malware than in benign samples. Hence, all packages that occur more in malware than benign apps are always used to build the model. Package mode.
In Figure 13(c), we report precision, recall, and F-measure achieved by FAM. It achieves its best result (0.89 F-measure) when trained and tested with the 2014 and newbenign datatsets. Also, we show in Table 5 how the three modes compare when trained and tested on dataset from the same year. Over12
PP Mode P Dataset PP P
drebin, oldbenign 2013, oldbenign 2014, oldbenign 2014, newbenign 2015, newbenign 2016, newbenign
0.71 0.85 0.64 0.51
Family 0.76 0.90 0.70 0.49
[Precision, Recall, F-measure] Package - 0.51 0.57 0.54 0.50 - 0.53 0.57 0.55 0.58 0.73 0.73 0.73 0.73 0.73 0.87 0.88 0.89 0.89 0.88 0.67 0.68 0.66 0.67 0.68 0.50 0.53 0.52 0.53 0.54
Class 0.47 0.57 0.76 0.89 0.67 0.54
0.49 0.58 0.75 0.89 0.68 0.54
Table 5: Precision, Recall, and F-measure (with Random Forests) of FAM when trained and tested on dataset from the same year in family, package, and class modes.
all, we find that abstraction to classes only slightly improves over package mode. Take-Away. Although we discuss in more detail the performance of the FAM variant vs the standard M A M A D ROID in Section 6.3, we can already observe that the former does not yield as robust of a model, mostly due to the fact that in some cases no abstracted API calls occur more in malware than benign samples.
6.2
Newer training, older testing. We also evaluate the opposite
setting, i.e., training FAM with newer datasets, and checking whether it is able to detect malware developed years before. Specifically, Figure 15 report results when training FAM with samples from a given year, and testing it with others that are up to 4 years older showing that F-measure range from 0.69 to 0.92 in family mode, 0.65 to 0.94 in package mode, and 0.66 to 0.97 in class mode. Recall that in family mode, FAM is unable to build a model when drebin and 2013 are used for training, thus, effecting the overall result. This effect is minimal in this setting since the training sets are newer than the test sets, thus, the drebin dataset is not used to evaluate any dataset while the 2013 dataset is used in only one setting i.e., when the training set is one year newer than the test set.
Detection Over Time
Once again, we evaluate the detection accuracy over time, i.e., we train FAM using older samples and test it with newer samples and vice versa. We report the F-measure as the average of the F-measure over multiple dataset combinations; e.g., when training with newer samples and testing on older samples, the F-measure after three years is the average of the Fmeasure when training with (2015, newbenign) and (2016, newbenign) respectively, and testing on drebin and 2013. Older training, newer testing. In Figure 14(a), we show the Fmeasure when FAM operates in family mode and is trained with datasets that are older than the classified datasets. The x-axis reports the difference in years between training and test data. We obtain an F-measure of 0.97 when training with samples that are one year older than the samples in the testing set. As mentioned in Section 6.1, there is no result when the drebin and 2013 datasets are used for training, hence, after 3 years the F-measure is 0. In package mode, the F-measure is 0.81 after one year, and 0.76 after two (Figure 14(b)). Whereas in class mode, the F-measure after one and two years are 0.85 and 0.70 respectively (Figure 14(c)). While FAM appears to perform better in family mode than in package and class modes, note that the detection accuracy after one and two years in family mode does not include results when the training set is (drebin, oldbenign) or (2013, oldbenign) (cf Section 6.1). We believe this is as a result of FAM performing best when trained on the 2014 dataset in all modes and performing poorly in package mode when trained with (drebin, oldbenign) and (2013, oldbenign) due to limited features. For example, accuracy after two years is the average of the F-measure when training with (2014, oldbenign/newbenign) datasets and testing on the 2016 dataset. Whereas, in package mode, accuracy is the average Fmeasure obtained from training with (drebin, oldbenign), (2013, oldbenign), and (2014, oldbenign/newbenign) datasets and testing with respectively, 2014, 2015, and 2016.
6.3
Comparing Frequency Markov Chain Model
Analysis
vs.
We now compare the detection accuracy of FAM– a variant of M A M A D ROID that is based on a frequency analysis model – to the standard M A M A D ROID, which is based on a Markov chain model using the sequence of abstracted API calls. Detection Accuracy of malware from same year. In Table 6, we
report accuracy of FAM and M A M A D ROID when they are trained and tested on samples from the same year using Random Forests in all modes. For completeness, we also report results from D ROIDAPIM INER, showing that M A M A D ROID outperforms FAM and D ROIDAPIM INER in all tests. Both FAM and D ROIDAPIM INER performs best when trained and tested with (2014 and newbenign) with F-measures of 0.89 (package mode) and 0.92, respectively. Overall, M A M A D ROID achieves higher F-measure compared to FAM and D ROIDAPIM INER due to both API call abstraction and Markov chain modeling of the sequence of calls, which successfully captures the behavior of the app. In addition, M A M A D ROID is more robust as with some datasets, frequency analysis fails to build a model with abstracted calls when the abstracted calls occur equally or more frequently in benign samples. Detection Accuracy of malware from different years. We also
compare FAM with M A M A D ROID when they are trained and tested with datasets across several years. In Table 7, we report the F-measures, achieved by M A M A D ROID and FAM in package mode using Random Forests, and show how they compare with D ROIDAPIM INER using two different sets of 13
1.0
0.8
0.8
0.8
0.6
0.6
0.6
0.4 0.2 0.0
0
2
Years
3
0.4 0.2
RF 1-NN 3-NN
1
F-measure
1.0
F-measure
F-measure
1.0
0.0
4
0
(a) family mode
0.2
RF 1-NN 3-NN
1
2
Years
3
0.4
0.0
4
0
RF 1-NN 3-NN
1
(b) package mode
2
Years
3
4
(c) class mode
1.0
1.0
0.8
0.8
0.8
0.6
0.6
0.6
0.4 0.2 0.0
0
2
Years (a) family mode
3
0.4 0.2
RF 1-NN 3-NN
1
F-measure
1.0
F-measure
F-measure
Figure 14: F-measure achieved by FAM using older samples for training and newer samples for testing. The x-axis shows the difference in years between the training and test data.
4
0.0
0
0.2
RF 1-NN 3-NN
1
2
Years
(b) package mode
3
0.4
4
0.0
0
RF 1-NN 3-NN
1
2
Years
3
4
(c) class mode
Figure 15: F-measure achieved by FAM using newer samples for training and older samples for testing. The x-axis shows the difference in years between the training and test data.
experiments. We report the results for package mode only because with both systems, when the training sets are older than the test sets, package mode performs better than class mode (although, less than family mode, there are no results for FAM with two of our training datasets in family mode) and only slightly lower when the training sets are newer than the test sets.
using samples comprising the newbenign and one of the three recent malware datasets (2014, 2015, 2016) each, and testing on all malware datasets. In this setting, M A M A D ROID outperforms both FAM and D ROIDAPIM INER in all but one experiment where FAM is only slightly better. Comparing D ROIDAPIM INER and FAM shows that D ROIDAPIM INER only performs better than FAM in two out of 15 experiments. In these two experiments, FAM was trained and tested on samples from the same year and resulted in a slightly lower precision, thus, increasing false positives. Overall, we find that the Markov chain based model achieves higher detection accuracy in both family and package modes when M A M A D ROID is trained and tested on dataset from the same year (Table 6) and across several years (Table 7).
In the first set of experiments, we train M A M A D ROID, FAM, and D ROIDAPIM INER using samples comprising the oldbenign and one of the three oldest malware datasets (drebin, 2013, 2014) each, and testing on all malware datasets. M A M A D ROID and FAM both outperform D ROIDAPIM INER in all experiments in this set, showing that abstracting the API calls improves the detection accuracy of our systems. FAM outperforms M A M A D ROID in nine out of the 15 experiments, largely, when the training set comprises the drebin/2013 and oldbenign datasets. Recall that when drebin and 2013 malware datasets are used for training FAM in package mode, only five and two packages respectively, are used to build the model. It is possible that these packages are the principal components (as in PCA) that distinguishes malware from benign samples. In the second set of experiments, we train M A M A D ROID, FAM, and D ROIDAPIM INER
7
Runtime Performance
We now analyze the runtime performance of M A M A D ROID and and the FAM variant, when operating in family, package, or class mode, as well as D ROIDAPIM INER. We run our experiments on a desktop with an 40-core 2.30GHz CPU and 14
F-measure
XX Mode Family Package Class Dataset XXX X FAM M A M A D ROID FAM M A M A D ROID FAM M A M A D ROID D ROIDAPIM INER
XX
drebin, oldbenign 2013, oldbenign 2014, oldbenign 2014, newbenign 2015, newbenign 2016, newbenign
0.73 0.87 0.67 0.50
0.88 0.92 0.92 0.98 0.91 0.89
0.96 0.97 0.95 0.99 0.95 0.92
0.54 0.55 0.73 0.89 0.67 0.53
0.49 0.58 0.75 0.89 0.68 0.54
0.96 0.97 0.95 0.99 0.95 0.92
0.32 0.36 0.62 0.92 0.77 0.36
Table 6: F-measure of FAM and M A M A D ROID in all modes using Random Forests as well as, D ROIDAPIM INER [1] when trained and tested on dataset from the same year. Testing Sets drebin, oldbenign 2013, oldbenign 2014, oldbenign 2015, oldbenign 2016, oldbenign Training Sets Droid FAM MaMa Droid FAM MaMa Droid FAM MaMa Droid FAM MaMa Droid FAM MaMa drebin,oldbenign 0.32 0.54 0.96 0.35 0.50 0.96 0.34 0.50 0.79 0.30 0.50 0.42 0.33 0.51 0.43 2013,oldbenign 0.33 0.90 0.93 0.36 0.55 0.97 0.35 0.95 0.74 0.31 0.87 0.36 0.33 0.82 0.29 2014,oldbenign 0.36 0.95 0.92 0.39 0.99 0.93 0.62 0.73 0.95 0.33 0.81 0.79 0.37 0.82 0.78 drebin, newbenign 2013, newbenign 2014, newbenign 2015, newbenign 2016, newbenign Training Sets Droid FAM MaMa Droid FAM MaMa Droid FAM MaMa Droid FAM MaMa Droid FAM MaMa 2014,newbenign 0.76 0.99 0.99 0.75 0.99 0.99 0.92 0.89 0.99 0.67 0.86 0.89 0.65 0.82 0.83 2015,newbenign 0.68 0.92 0.98 0.68 0.84 0.98 0.69 0.95 0.99 0.77 0.67 0.95 0.65 0.91 0.90 2016,newbenign 0.33 0.83 0.97 0.35 0.69 0.97 0.36 0.91 0.99 0.34 0.86 0.93 0.36 0.53 0.92
Table 7: F-Measure of M A M A D ROID (MaMa) vs our variant using frequency analysis (FAM) vs D ROIDAPIM INER (Droid) [1].
M A M A D ROID’s third step includes Markov chain modeling and feature vector extraction. With malicious samples, it takes on average 0.2s±0.3, 2.5s±3.2, and 1.49s±2.39 (and at most 2.4s, 22.1s, and 46.10s), respectively, with families, packages, and classes, whereas, with benign samples, it takes 0.6s±0.3, 6.7s±3.8, and 2.23s±2.74 (at most 1.7s, 18.4s, and 43.98s). Finally, the last step is classification, and performance depends on both the machine learning algorithm employed and the mode of operation. More specifically, running times are affected by the number of features for the app to be classified, and not by the initial dimension of the call graph, or by whether the app is benign or malicious. Regardless, in family mode, Random Forests, 1-NN, and 3-NN all take less than 0.01s. With packages, it takes, respectively, 0.65s, 1.05s, and 0.007s per app with 1-NN, 3-NN, Random Forests. Whereas, it takes, respectively, 1.02s, 1.65s, and 0.05s per app with 1NN, 3-NN, and Random Forests in class mode. Overall, when operating in family mode, malware and benign samples take on average, 10.7s and 27.3s respectively to complete the entire process, from call graph extraction to classification. In package mode, the average completion times for malware and benign samples are 13.37s and 33.83s respectively. Whereas, in class mode, the average completion times are respectively, 21.7s and 41.12s for malware and benign apps. In both modes of operation, time is mostly (>80%) spent on call graph extraction.
128GB of RAM, but only use 1 core and allocate 16GB of RAM for evaluation.
7.1
M A M A D ROID
We envision M A M A D ROID to be integrated in offline detection systems, e.g., run by the app store. Recall that M A M A D ROID consists of different phases, so in the following, we review the computational overhead incurred by each of them, aiming to assess the feasibility of real-world deployment. M A M A D ROID’s first step involves extracting the call graph from an apk and the complexity of this task varies significantly across apps. On average, it takes 9.2s±14 (min 0.02s, max 13m) to complete for samples in our malware sets. Benign apps usually yield larger call graphs, and the average time to extract them is 25.4s±63 (min 0.06s, max 18m) per app. Next, we measure the time needed to extract call sequences while abstracting to families, packages or classes depending on M A M A D ROID’s mode of operation. In family mode, this phase completes in about 1.3s on average (and at most 11.0s) with both benign and malicious samples. Abstracting to packages takes slightly longer, due to the use of 341 packages in M A M A D ROID. On average, this extraction takes 1.67s±3.1 for malicious apps and 1.73s±3.2 for benign samples. Recall that in class mode, after abstracting to classes, we cluster the classes to a smaller set of labels due to its size. Therefore, in this mode it takes on average, 5.84s±2.1 and 7.3s±4.2 respectively, to first abstract the calls from malware and benign apps to classes and 2.74s per app to build the co-occurrence matrix from which we compute the similarity between classes. Finally, clustering and abstracting each call to its corresponding class label takes 2.38s and 3.4s respectively, for malware and benign apps. In total, it takes 10.96s to abstract calls from malware apps to their corresponding class labels and 13.44s for benign apps.
7.2
FAM
Recall that FAM is a variant of M A M A D ROID including three phases. The first one, API calls extraction, takes 0.7s±1.5 (min 0.01s, max 28.4s) per app in our malware datasets and 13.2s±22.2 (min 0.01s, max 222s) per benign app. The second phase includes API call abstraction, frequency analysis, and feature extraction. While API call abstraction is depen15
dent on the dataset and the mode of operation, frequency analysis and feature extraction are only dependent on the mode of operation and are very fast in all modes. In particular, it takes on average, 1.32s, 1.69s±3.2, and 5.86s±2.1 respectively, to complete a malware app in family, package, and class modes. Whereas, it takes on average, 1.32s±3.1, 1.75s±3.2, and 7.32s±2.1 respectively, for a benign app in family, package, and class modes. The last phase which is classification is very fast regardless of dataset, mode of operation, and classifier used. Specifically, it takes less than 0.01s to classify each app in all modes using the three different classifiers. Overall, it takes in total 2.02s, 2.39s, and 6.56s respectively, to classify a malware app in family, package, and class modes. While with benign apps, the total is 14.52s, 14.95s, and 20.52s respectively, in family, package, and class modes.
7.3
and Markov chains, discuss possible evasion techniques, and highlight some limitations of our approach.
8.1
Our work yields important insights around the use of API calls in malicious apps, showing that, by abstracting the API calls to higher levels and modeling these abstracted calls, we can obtain high detection accuracy and retain it over several years which is crucial due to the continuous evolution of the Android ecosystem. As discussed in Section 3, the use of API calls changes over time, and in different ways across malicious and benign samples. From our newer datasets, which include samples up to Spring 2016 (API level 23), we observe that newer APIs introduce more packages, classes, and methods, while also deprecating some. Figure 7(a) shows that benign apps use more calls than malicious ones developed around the same time. We also notice an interesting trend in the use of Android (Figure 7(b)) and Google (Figure 7(c)) APIs: malicious apps follow the same trend as benign apps in the way they adopt certain APIs, but with a delay of some years. This might be a side effect of Android malware authors repackaging benign apps, adding their malicious functionalities onto them. Given the frequent changes in the Android framework and the continuous evolution of malware, systems like D ROIDAPIM INER [1] – being dependent on the presence or the use of certain API calls – become increasingly less effective with time. As shown in Table 3, malware that uses API calls released after those used by samples in the training set cannot be identified by these systems. On the contrary, as shown in Figure 10, M A M A D ROID detects malware samples that are 1 year newer than the training set obtaining an Fmeasure of 0.86 (as opposed to 0.46 with D ROIDAPIM INER) when the apps are modeled as Markov chains. After 2 years, the value is still at 0.75 (0.42 with D ROIDAPIM INER), dropping to 0.51 after 4 years. We argue that the effectiveness of M A M A D ROID’s classification remains relatively high “over the years” owing to the Markov models capturing app’s behavior. These models tend to be more robust to malware evolution because abstracting to e.g., packages makes the system less susceptible to the introduction of new API calls. To verify this, we developed a variant of M A M A D ROID named FAM that abstracts API calls and is based on frequency analysis similar to D ROIDAPIM INER. Although, the addition of API call abstraction results in an improvement of the detection accuracy of the system (an Fmeasure of 0.81 and 0.76 after one and two years respectively), it also resulted in scenarios where there are no API calls that are more frequently used in malware than benign apps. In general, abstraction allows M A M A D ROID to capture newer classes/methods added to the API, since these are abstracted to already-known families or packages. In case newer packages are added to the API, and these packages start being used by malware, M A M A D ROID only requires adding a new state to the Markov chains, and probabilities of a transition from a state to this new state in old apps would be 0. In
D ROIDAPIM INER
Finally, we evaluate the runtime performance of D ROIDAPIM INER [1]. Its first step, i.e., extracting API calls, takes 0.7s±1.5 (min 0.01s, max 28.4s) per app in our malware datasets. Whereas, it takes on average 13.2s±22.2 (min 0.01s, max 222s) per benign app. In the second phase, i.e., frequency and data flow analysis, it takes, on average, 4.2s per app. Finally, classification using 3-NN is very fast: 0.002s on average. Therefore, in total, D ROIDAPIM INER takes respectively, 17.4s and 4.9s for a complete execution on one app from our benign and malware datasets, which while faster than M A M A D ROID, achieves significantly lower accuracy. In comparison to M A M A D ROID, D ROIDAPIM INER takes 5.8s and 9.9s less on average to analyze and classify a malicious and benign app when M A M A D ROID operates in family mode and 8.47s and 16.43s less on average in package mode.
7.4
Take Away
In conclusion, our experiments show that our prototype implementation of M A M A D ROID is scalable enough to be deployed. Assuming that, everyday, a number of apps in the order of 10,000 are submitted to Google Play, and using the average execution time of benign samples in family (27.3s), package (33.83s), and class (41.12s) modes, we estimate that it would take less than an hour and a half to complete execution of all apps submitted daily in both modes, with just 64 cores. Note that we could not find accurate statistics reporting the number of apps submitted everyday, but only the total number of apps on Google Play.11 On average, this number increases of a couple of thousands per day, and although we do not know how many apps are removed, we believe 10,000 apps submitted every day is likely an upper bound.
8
Lessons Learned
Discussion
We now discuss the implications of our results with respect to the feasibility of modeling app behavior using static analysis 11 http://www.appbrain.com/stats/number-of-android-apps
16
reality though, methods and classes are more frequently added than packages with new API releases. Hence, we also evaluate whether M A M A D ROID still performs as well as in package mode when we abstract an API call to class and measure the overall overhead increase. Results from Figure 14, 15, and 12 indicate that finer-grained abstraction is less effective as time passes when older samples are used for training and newer samples for testing, while they are more effective when samples from the same year or newer than the test sets are used for training. However, while all three modes of abstraction performs relatively well, we believe abstraction to packages is the most effective as it generally performs better than family – though less lightweight – and as well as class but more efficient.
8.2
modeled, as it is not Java and is not processed by Soot. These limitations are not specific of M A M A D ROID, but are a problem of static analysis in general, which can be mitigated by using M A M A D ROID alongside dynamic analysis techniques. Another approach could be using dynamic dispatch so that a class X in package A is created to extend class Y in package B with static analysis reporting a call to root() defined in Y as X.root(), whereas, at runtime Y.root() is executed. This can be addressed, however, with a small increase in M A M A D ROID’s computational cost, by keeping track of self-defined classes that extend or implement classes in the recognized APIs, and abstract polymorphic functions of this self-defined class to the corresponding recognized package, while, at the same time, abstracting as self-defined overridden functions in the class. Finally, identifier mangling and other forms of obfuscation could be used aiming to obfuscate code and hide malicious actions. However, since classes in the Android framework cannot be obfuscated by obfuscation tools, malware developers can only do so for self-defined classes. M A M A D ROID labels obfuscated calls as obfuscated so, ultimately, these would be captured in the behavioral model (and the Markov chain) for the app. In our sample, we observe that benign apps use significantly less obfuscation than malicious apps, indicating that obfuscating a significant number of classes is not a good evasion strategy since this would likely make the sample more easily identifiable as malicious. Malware developers might also attempt to evade M A M A D ROID by naming their selfdefined packages in such a way that they look similar to that of the android or google APIs, e.g., java.lang.reflect.malware is easily prevented by first abstracting to classes before abstracting to any further modes as we already do in Section 5.
Evasion
Next, we discuss possible evasion techniques and how they can be addressed. One straightforward evasion approach could be to repackage a benign app with small snippets of malicious code added to a few classes. However, it is difficult to embed malicious code in such a way that, at the same time, the resulting Markov chain looks similar to a benign one. For instance, our running example from Section 2 (malware posing as a memory booster app and executing unwanted commands as root) is correctly classified by M A M A D ROID; although most functionalities in this malware are the same as the original app, injected API calls generate some transitions in the Markov chain that are not typical of benign samples. The opposite procedure, i.e., embedding portions of benign code into a malicious app, is also likely ineffective against M A M A D ROID, since, for each app, we derive the feature vector from the transition probability between calls over the entire app. A malware developer would have to embed benign code inside the malware in such a way that the overall sequence of calls yields similar transition probabilities as those in a benign app, but this is difficult to achieve because if the sequences of calls have to be different (otherwise there would be no attack), then the models will also be different. An attacker could also try to create an app with a similar Markov chain to that of a benign app. Because this is derived from the sequence of abstracted API calls in the app, it is actually very difficult to create sequences resulting in Markov chains similar to benign apps while, at the same time, actually engaging in malicious behavior. Moreover, attackers could try using reflection, dynamic code loading, or native code [42]. Because M A M A D ROID uses static analysis, it fails to detect malicious code when it is loaded or determined at runtime. However, M A M A D ROID can detect reflection when a method from the reflection package (java.lang.reflect) is executed. Therefore, we obtain the correct sequence of calls up to the invocation of the reflection call, which may be sufficient to distinguish between malware and benign apps. Similarly, M A M A D ROID can detect the usage of class loaders and package contexts that can be used to load arbitrary code, but it is not able to model the code loaded; likewise, native code that is part of the app cannot be
8.3
Limitations
M A M A D ROID requires a sizable amount of memory in order to perform classification, when operating in package mode, working on more than 100,000 features per sample. The quantity of features, however, can be further reduced using feature selection algorithms such as PCA. As explained in Section 6 when we use 10 components from the PCA the system performs almost as well as the one using all the features; however, using PCA comes with a much lower memory complexity in order to run the machine learning algorithms, because the number of dimensions of the features space where the classifier operates is remarkably reduced. Soot [51], which we use to extract call graphs, fails to analyze some apks. In fact, we were not able to extract call graphs for a fraction (4.6%) of the apps in the original datasets due to scripts either failing to apply the jb phase, which is used to transform Java bytecode to the primary intermediate representation (i.e., jimple) of Soot or not able to open the apk. Even though this does not really affect the results of our evaluation, one could avoid it by using a different/custom intermediate representation for the analysis or use different tools to extract the call graphs. In general, static analysis methodologies for malware detection on Android could fail to capture the runtime environment 17
context, code that is executed more frequently, or other effects stemming from user input [4]. These limitations can be addressed using dynamic analysis, or by recording function calls on a device. Dynamic analysis observes the live performance of the samples, recording what activity is actually performed at runtime. Through dynamic analysis, it is also possible to provide inputs to the app and then analyze the reaction of the app to these inputs, going beyond static analysis limits. To this end, we plan to integrate dynamic analysis to build the models used by M A M A D ROID as part of future work.
9
this still takes a non-negligible toll on battery life. Recently, hybrid systems like IntelliDroid [55] have also been proposed that use input generators, producing inputs specific to dynamic analysis tools. Other work combining static and dynamic analysis include [23, 28, 58, 7].
9.2
A number of techniques have used signatures for Android malware detection. NetworkProfiler [16] generates network profiles for Android apps and extracts fingerprints based on such traces, ASTROID [20] used common subgraphs among samples as signatures for identifying unknown malware samples, while work in [10] obtains resource-based metrics (CPU, memory, storage, network) to distinguish malware activity from benign one. [13] extract statistical features, such as permissions and API calls, and extend their vectors to add dynamic behavior-based features. While their experiments show that their solution outperforms, in terms of accuracy, other antivirus systems, [13] indicate that the quality of their detection model critically depends on the availability of representative benign and malicious apps for training. MADAM [46] also extract features at four layers which are used to build a behavioral model for apps and uses two parallel classifier to detect malware. Similarly, ScanMe Mobile [64] uses the Google Cloud Messaging Service (GCM) to perform static and dynamic analysis on apks found on the device’s SD card. While, TriFlow [37] rank apps based on potential risks by using the observed and possible information flows in the apps. The sequences of system calls have also been used to detect malware in both desktop and Android environments. Hofmeyr et al. [27] demonstrate that short sequences of system calls can be used as a signature to discriminate between normal and abnormal behavior of common UNIX programs. Signaturebased methods, however, can be evaded using polymorphism and obfuscation, as well as by call re-ordering attacks [33], even though quantitative measures, such as similarity analysis, can be used to address some of these attacks [48]. M A M A D ROID inherits the spirit of these approaches, proposing a statistical method to model app behavior that is more robust against evasion attempts. In the Android context, [9] use the sequences of three system calls (extracted from the execution traces of apps under analysis) to detect malware. This approach models specific malware families, aiming to identify additional samples belonging to such families. In contrast, M A M A D ROID’s goal is to detect previously-unseen malware, and we also show that our system can detect new malware families that even appear years after the system has been trained. In addition, using strict sequences of system or API calls can be easily evaded by malware authors who could add unnecessary calls to effectively evade detection. Conversely, M A M A D ROID builds a behavioral model of an Android app, which makes it robust to this type of evasion. Dynamic analysis has also been applied to detect Android malware by using predefined scripts of common inputs that will be performed when the device is running. However, this
Related Work
Over the past few years, Android security has attracted a wealth of work by the research community. In this section, we review (i) program analysis techniques focusing on general security properties of Android apps, and then (ii) systems that specifically target malware on Android.
9.1
Android Malware Detection
Program Analysis
Previous work on program analysis applied to Android security has used both static and dynamic analysis. With the former, the program’s code is decompiled in order to extract features without actually running the program, usually employing tools such as Dare [41] to obtain Java bytecode. The latter involves real-time execution of the program, typically in an emulated or protected environment. Static analysis techniques include work by Felt et al. [19], who analyze API calls to identify over-privileged apps, while Kirin [18] is a system that examines permissions requested by apps to perform a lightweight certification, using a set of security rules that indicate whether or not the security configuration bundled with the app is safe. RiskRanker [26] aims to identify zero-day Android malware by assessing potential security risks caused by untrusted apps. It sifts through a large number of apps from Android markets and examines them to detect certain behaviors, such as encryption and dynamic code loading, which form malicious patterns and can be used to detect stealthy malware. Other methods, such as CHEX [34], use data flow analysis to automatically vet Android apps for vulnerabilities. Static analysis has also been applied to the detection of data leaks and malicious data flows from Android apps [5, 32, 62, 31]. DroidScope [59] and TaintDroid [17] monitor run-time app behavior in a protected environment to perform dynamic taint analysis. DroidScope performs dynamic taint analysis at the machine code level, while TaintDroid monitors how thirdparty apps access or manipulate users’ personal data, aiming to detect sensitive data leaving the system. However, as it is unrealistic to deploy dynamic analysis techniques directly on users’ devices, due to the overhead they introduce, these are typically used offline [45, 67, 49]. ParanoidAndroid [44] employs a virtual clone of the smartphone, running in parallel in the cloud and replaying activities of the device – however, even if minimal execution traces are actually sent to the cloud, 18
might be inadequate due to the low probability of triggering malicious behavior, and can be side-stepped by knowledgeable adversaries, as suggested by Wong and Lie [55]. Other approaches include random fuzzing [35, 63] and concolic testing [2, 24]. Dynamic analysis can only detect malicious activities if the code exhibiting malicious behavior is actually running during the analysis. Moreover, according to [53], mobile malware authors often employ emulation or virtualization detection strategies to change malware behavior and eventually evade detection. Machine learning techniques have also been applied to assist Android malware detection. Droidmat [57] uses API call tracing and manifest files to learn features for malware detection, Teufl et al. [50] apply knowledge discovery processes and lean statistical methods on app metadata extracted from the app market, while [22] rely on embedded call graphs. DroidMiner [60] studies the program logic of sensitive Android/Java framework API functions and resources, and detects malicious behavior patterns. MAST [12] statically analyzes apps using features such as permissions, presence of native code, and intent filters and measures the correlation between multiple qualitative data. Crowdroid [8] relies on crowdsourcing to distinguish between malicious and benign apps by monitoring system calls. AppContext [61] models security-sensitive behavior, such as activation events or environmental attributes, and uses SVM to classify these behaviors, while RevealDroid [21] employs supervised learning and obfuscation-resilient methods targeting API usage and intent actions to identify their families. D REBIN [4] deduces detection patterns and identifies malicious software directly on the device, performing a broad static analysis. This is achieved by gathering numerous features from the manifest file as well as the app’s source code (API calls, network addresses, permissions). Malevolent behavior is reflected in patterns and combinations of extracted features from the static analysis: for instance, the existence of both SEND SMS permission and the android.hardware.telephony component in an app might indicate an attempt to send premium SMS messages, and this combination can eventually constitute a detection pattern. In Section 4.5, we have compared against D ROIDAPIM INER [1]. This system relies on the top169 API calls that are used more frequently in the malware than in the benign set, along with data flow analysis on calls that are frequent in both benign and malicious apps, but occur up to 6% more in the latter. As shown in our evaluation, using the most common calls observed during training requires constant retraining, due to the evolution of both malware and the Android API. On the contrary, M A M A D ROID can effectively model both benign and malicious Android apps, and perform an efficient classification on them. Compared to D ROIDAPIM INER, our approach is more resilient to changes in the Android framework than D ROIDAPIM INER, resulting in a less frequent need to re-train the classifier. Overall, compared to state-of-the-art systems like D REBIN [4] and D ROIDAPIM INER [1], M A M A D ROID
is more generic and robust as its statistical modeling does not depend on specific app characteristics, but can actually be run on any app created for any Android API level. Finally, also related to M A M A D ROID are Markov-chain based models for Android malware detection. [14] dynamically analyze system- and developer-defined actions from intent messages (used by app components to communicate with each other at runtime), and probabilistically estimate whether an app is performing benign or malicious actions at run time, but obtain low accuracy overall. Canfora et al. [11] use a Hidden Markov model (HMM) to identify malware samples belonging to previously observed malware families, whereas, M A M A D ROID can detect previously unseen malware, not relying on specific malware families.
10
Conclusion
This paper presented M A M A D ROID, an Android malware detection system that is based on modeling the sequences of API calls as Markov chains. Our system is designed to operate in one of three modes, with different granularities, by abstracting API calls to either families, packages or classes. We ran an extensive experimental evaluation using, to the best of our knowledge, the largest malware dataset in an Android malware detection research paper, and aiming at assessing both the accuracy of the classification (using F-measure, precision, and recall) and runtime performances. We showed that M A M A D ROID effectively detects unknown malware samples developed around the same time as the samples on which it is trained (F-measure up to 0.99). It also maintains good detection performance: one year after the model has been trained with a F-measure of 0.86, and 0.75 after two years. We compared M A M A D ROID to D ROIDAPIM INER [1], a state-of-the-art system based on API calls frequently used by malware, showing that, not only does M A M A D ROID outperforms D ROIDAPIM INER when trained and tested on datasets from the same year, but that it is also much more resilient over the years to changes in the Android API. We also developed a variant of M A M A D ROID, called FAM, that performs API call abstraction but is based on frequency analysis to evaluate whether M A M A D ROID’s high detection accuracy is based solely on the abstraction. We found that FAM improves on D ROIDAPIM INER but, while abstraction is important for high detection rate and resilience to API changes, abstraction and a modeling approach based on frequency analysis is not as robust as M A M A D ROID, especially in scenarios where API calls are not more frequent in malware than in benign apps. Overall, our results demonstrate that statistical behavioral models introduced by M A M A D ROID—in particular, abstraction and Markov chain modeling of API call sequence—are more robust than traditional techniques, highlighting how our work can form the basis of more advanced detection systems in the future. As part of future work, we plan to further investigate the resilience to possible evasion techniques, focusing on repackaged malicious apps as well as injection of API calls to maliciously alter Markov models. We also plan to explore 19
the possibility of seeding the behavioral modeling performed by M A M A D ROID with dynamic instead of static analysis. Acknowledgments. We wish to thank Yousra Aafer for sharing the D ROIDAPIM INER source code and Yanick Fratantonio for his comments on an early draft of the paper. This research was supported by the EPSRC under grant EP/N008448/1, by an EPSRC-funded “Future Leaders in Engineering and Physical Sciences” award, a Xerox University Affairs Committee grant, and by a small grant from GCHQ. Enrico Mariconti was supported by the EPSRC under grant 1490017, while Lucky Onwuzurike was funded by the Petroleum Technology Development Fund (PTDF).
[12] S. Chakradeo, B. Reaves, P. Traynor, and W. Enck. MAST: Triage for Market-scale Mobile Malware Analysis. In ACM Conference on Security and Privacy in Wireless and Mobile Networks (WiSec), 2013. [13] S. Chen, M. Xue, Z. Tang, L. Xu, and H. Zhu. StormDroid: A Streaminglized Machine Learning-Based System for Detecting Android Malware. In ACM Asia Conference on Computer and Communications Security (AsiaCCS), 2016. [14] Y. Chen, M. Ghorbanzadeh, K. Ma, C. Clancy, and R. McGwier. A hidden Markov model detection of malicious Android applications at runtime. In Wireless and Optical Communication Conference (WOCC), 2014. [15] J. Clay. Continued Rise in Mobile Threats for 2016. http://blog. trendmicro.com/continued-rise-in-mobile-threats-for-2016/, 2016.
References
[16] S. Dai, A. Tongaonkar, X. Wang, A. Nucci, and D. Song. NetworkProfiler: Towards automatic fingerprinting of Android apps. In IEEE International Conference on Computer Communications (INFOCOM), 2013.
[1] Y. Aafer, W. Du, and H. Yin. DroidAPIMiner: Mining APILevel Features for Robust Malware Detection in Android. In International Conference on Security and Privacy in Communication Networks (SecureComm), 2013.
[17] W. Enck, P. Gilbert, S. Han, V. Tendulkar, B.-G. Chun, L. P. Cox, J. Jung, P. McDaniel, and A. N. Sheth. TaintDroid: An Information-Flow Tracking System for Realtime Privacy Monitoring on Smartphones. ACM Transactions on Computer Systems, 32(2), 2014.
[2] S. Anand, M. Naik, M. J. Harrold, and H. Yang. Automated Concolic Testing of Smartphone Apps. In ACM Symposium on the Foundations of Software Engineering (FSE), 2012. [3] P. Andriotis, M. A. Sasse, and G. Stringhini. Permissions snapshots: Assessing users’ adaptation to the android runtime permission model. In IEEE Workshop on Information Forensics and Security (WIFS), 2016.
[18] W. Enck, M. Ongtang, and P. McDaniel. On Lightweight Mobile Phone Application Certification. In ACM Conference on Computer and Communications Security (CCS), 2009.
[4] D. Arp, M. Spreitzenbarth, M. Hubner, H. Gascon, and K. Rieck. DREBIN: Effective and Explainable Detection of Android Malware in Your Pocket. In Annual Symposium on Network and Distributed System Security (NDSS), 2014.
[19] A. P. Felt, E. Chin, S. Hanna, D. Song, and D. Wagner. Android Permissions Demystified. In ACM Conference on Computer and Communications Security (CCS), 2011. [20] Y. Feng, O. Bastani, R. Martins, I. Dillig, and S. Anand. Automated synthesis of semantic malware signatures using maximum satisfiability. In Annual Symposium on Network and Distributed System Security (NDSS), 2017.
[5] S. Arzt, S. Rasthofer, C. Fritz, E. Bodden, A. Bartel, J. Klein, Y. Le Traon, D. Octeau, and P. McDaniel. FlowDroid: Precise Context, Flow, Field, Object-sensitive and Lifecycle-aware Taint Analysis for Android Apps. In ACM SIGPLAN Conference on Programming Language Design and Implementation (PLDI), 2014. [6] S. Bernard, S. Adam, and L. Heutte. Using random forests for handwritten digit recognition. In Ninth International Conference on Document Analysis and Recognition, 2007.
[21] J. Garcia, M. Hammad, B. Pedrood, A. Bagheri-Khaligh, and S. Malek. Obfuscation-resilient, efficient, and accurate detection and family identification of android malware. Department of Computer Science, George Mason University, Tech. Rep, 2015.
[7] R. Bhoraskar, S. Han, J. Jeon, T. Azim, S. Chen, J. Jung, S. Nath, R. Wang, and D. Wetherall. Brahmastra: Driving Apps to Test the Security of Third-Party Components. In USENIX Security Symposium, 2014.
[22] H. Gascon, F. Yamaguchi, D. Arp, and K. Rieck. Structural Detection of Android Malware Using Embedded Call Graphs. In ACM Workshop on Artificial Intelligence and Security (AISec), 2013.
[8] I. Burguera, U. Zurutuza, and S. Nadjm-Tehrani. Crowdroid: Behavior-based Malware Detection System for Android. In ACM Workshop on Security and Privacy in Smartphones and Mobile Devices (SPSM), 2011.
[23] X. Ge, K. Taneja, T. Xie, and N. Tillmann. DyTa: Dynamic Symbolic Execution Guided with Static Verification Results. In International Conference on Software Engineering (ICSE), 2011.
[9] G. Canfora, E. Medvet, F. Mercaldo, and C. A. Visaggio. Detecting Android Malware Using Sequences of System Calls. In Workshop on Software Development Lifecycle for Mobile, 2015.
[24] P. Godefroid, N. Klarlund, and K. Sen. DART: Directed Automated Random Testing. ACM SIGPLAN Notices, 40(6), 2005. [25] M. I. Gordon, D. Kim, J. H. Perkins, L. Gilham, N. Nguyen, and M. C. Rinard. Information Flow Analysis of Android Applications in DroidSafe. In Annual Symposium on Network and Distributed System Security (NDSS), 2015.
[10] G. Canfora, E. Medvet, F. Mercaldo, and C. A. Visaggio. Acquiring and Analyzing App Metrics for Effective Mobile Malware Detection. In International Workshop on Security and Privacy Analytics (IWSPA), 2016.
[26] M. Grace, Y. Zhou, Q. Zhang, S. Zou, and X. Jiang. RiskRanker: Scalable and Accurate Zero-day Android Malware Detection. In International Conference on Mobile Systems, Applications, and Services (MobiSys), 2012.
[11] G. Canfora, F. Mercaldo, and C. A. Visaggio. An HMM and Structural Entropy based Detector for Android malware: An Empirical Study. Computers & Security, 61, 2016.
20
[45] V. Rastogi, Y. Chen, and X. Jiang. DroidChameleon: Evaluating Android Anti-malware Against Transformation Attacks. In ACM Asia Conference on Computer and Communications Security (AsiaCCS), 2013.
[27] S. A. Hofmeyr, S. Forrest, and A. Somayaji. Intrusion detection using sequences of system calls. Journal of Computer Security, 6(3), 1998. [28] Y. Z. X. Jiang. Detecting passive content leaks and pollution in android applications. In Annual Symposium on Network and Distributed System Security (NDSS), 2013.
[46] A. Saracino, D. Sgandurra, G. Dini, and F. Martinelli. Madam: Effective and efficient behavior-based android malware detection and prevention. IEEE Transactions on Dependable and Secure Computing, 2016.
[29] I. Jolliffe. Principal Component Analysis. John Wiley & Sons, 2002.
[47] B. P. Sarma, N. Li, C. Gates, R. Potharaju, C. Nita-Rotaru, and I. Molloy. Android Permissions: A Perspective Combining Risks and Benefits. In ACM Symposium on Access Control Models and Technologies (SACMAT), 2012.
[30] M. J. Kearns. The Computational Complexity of Machine Learning. MIT press, 1990. [31] J. Kim, Y. Yoon, K. Yi, J. Shin, and S. Center. ScanDal: Static analyzer for detecting privacy leaks in android applications. In MoST, 2012.
[48] M. K. Shankarapani, S. Ramamoorthy, R. S. Movva, and S. Mukkamala. Malware detection using assembly and API call sequences. Journal in Computer Virology, 7(2), 2011.
[32] W. Klieber, L. Flynn, A. Bhosale, L. Jia, and L. Bauer. Android Taint Flow Analysis for App Sets. In SOAP, 2014.
[49] K. Tam, S. J. Khan, A. Fattori, and L. Cavallaro. CopperDroid: Automatic Reconstruction of Android Malware Behaviors. In Annual Symposium on Network and Distributed System Security (NDSS), 2015.
[33] C. Kolbitsch, P. M. Comparetti, C. Kruegel, E. Kirda, X.-y. Zhou, and X. Wang. Effective and Efficient Malware Detection at the End Host. In USENIX security symposium, 2009.
[50] P. Teufl, M. Ferk, A. Fitzek, D. Hein, S. Kraxberger, and C. Orthacker. Malware detection by applying knowledge discovery processes to application metadata on the Android Market (Google Play). Security and Communication Networks, 9(5), 2016.
[34] L. Lu, Z. Li, Z. Wu, W. Lee, and G. Jiang. CHEX: Statically Vetting Android Apps for Component Hijacking Vulnerabilities. In ACM Conference on Computer and Communications Security (CCS), 2012. [35] A. Machiry, R. Tahiliani, and M. Naik. Dynodroid: An Input Generation System for Android Apps. In Joint Meeting on Foundations of Software Engineering (ESEC/FSE), 2013.
[51] R. Vall´ee-Rai, P. Co, E. Gagnon, L. Hendren, P. Lam, and V. Sundaresan. Soot - a Java Bytecode Optimization Framework. In Conference of the Centre for Advanced Studies on Collaborative Research, 1999.
[36] E. Mariconti, L. Onwuzurike, P. Andriotis, E. De Cristofaro, G. Ross, and G. Stringhini. MaMaDroid: Detecting Android Malware by Building Markov Chains of Behavioral Models. In Annual Symposium on Network and Distributed System Security (NDSS), 2017.
[52] D. Venkatesan. Android.Bankosy: All ears on voice call-based 2FA. http://www.symantec.com/connect/blogs/ androidbankosy-all-ears-voice-call-based-2fa, 2016. [53] T. Vidas and N. Christin. Evading android runtime analysis via sandbox detection. In ACM Asia Conference on Computer and Communications Security (AsiaCCS), 2014.
[37] O. Mirzaei, G. Suarez-Tangil, J. Tapiador, and J. M. de Fuentes. Triflow: Triaging android applications using speculative information flows. In ACM Asia Conference on Computer and Communications Security (AsiaCCS), 2017.
[54] N. Viennot, E. Garcia, and J. Nieh. A measurement study of google play. ACM SIGMETRICS Performance Evaluation Review, 42(1), 2014.
[38] D. Morris. An Extremely Convincing WhatsApp Fake Was Downloaded More Than 1 Million Times From Google Play. http://fortune.com/2017/11/04/whatsapp-fake-google-play/, 2017.
[55] M. Y. Wong and D. Lie. IntelliDroid: A Targeted Input Generator for the Dynamic Analysis of Android Malware. In Annual Symposium on Network and Distributed System Security (NDSS), 2016.
[39] J. R. Norris. Markov chains. Cambridge University Press, 1998. [40] J. Oberheide and C. Miller. Dissecting the Android Bouncer. In SummerCon, 2012.
[56] B. Woods. Google Play has hundreds of Android apps that contain malware. http://www.trustedreviews.com/news/ malware-apps-downloaded-google-play, 2016.
[41] D. Octeau, S. Jha, and P. McDaniel. Retargeting Android Applications to Java Bytecode. In ACM Symposium on the Foundations of Software Engineering (FSE), 2012.
[57] D.-J. Wu, C.-H. Mao, T.-E. Wei, H.-M. Lee, and K.-P. Wu. DroidMat: Android Malware Detection through Manifest and API Calls Tracing. In Asia JCIS, 2012.
[42] S. Poeplau, Y. Fratantonio, A. Bianchi, C. Kruegel, and G. Vigna. Execute This! Analyzing Unsafe and Malicious Dynamic Code Loading in Android Applications. In Annual Symposium on Network and Distributed System Security (NDSS), 2014.
[58] M. Xia, L. Gong, Y. Lyu, Z. Qi, and X. Liu. Effective RealTime Android Application Auditing. In IEEE Symposium on Security and Privacy (S&P), 2015.
[43] I. Polakis, M. Diamantaris, T. Petsas, F. Maggi, and S. Ioannidis. Powerslave: Analyzing the Energy Consumption of Mobile Antivirus Software. In DIMVA, 2015.
[59] L. K. Yan and H. Yin. DroidScope: Seamlessly Reconstructing the OS and Dalvik Semantic Views for Dynamic Android Malware Analysis. In USENIX Security Symposium, 2012.
[44] G. Portokalidis, P. Homburg, K. Anagnostakis, and H. Bos. Paranoid Android: Versatile Protection for Smartphones. In Annual Computer Security Applications Conference (ACSAC), 2010.
[60] C. Yang, Z. Xu, G. Gu, V. Yegneswaran, and P. Porras. Droidminer: Automated mining and characterization of fine-grained malicious behaviors in Android applications. In European Symposium on Research in Computer Security (ESORICS), 2014.
21
Cloud-based Android Malware Analysis Service. SIGAPP Applied Computing Review, 16(1), 2016.
[61] W. Yang, X. Xiao, B. Andow, S. Li, T. Xie, and W. Enck. AppContext: Differentiating Malicious and Benign Mobile App Behaviors Using Context. In International Conference on Software Engineering (ICSE), 2015.
[65] N. Zhang, K. Yuan, M. Naveed, X. Zhou, and X. Wang. Leave me alone: App-level protection against runtime information gathering on Android. In IEEE Symposium on Security and Privacy (S&P), 2015.
[62] Z. Yang, M. Yang, Y. Zhang, G. Gu, P. Ning, and X. S. Wang. AppIntent: Analyzing Sensitive Data Transmission in Android for Privacy Leakage Detection. In ACM Conference on Computer and Communications Security (CCS), 2013.
[66] Y. Zhou and X. Jiang. Dissecting Android Malware: Characterization and Evolution. In IEEE Symposium on Security and Privacy (S&P), 2012.
[63] H. Ye, S. Cheng, L. Zhang, and F. Jiang. DroidFuzzer: Fuzzing the Android Apps with Intent-Filter Tag. In International Conference on Advances in Mobile Computing and Multimedia (MoMM), 2013.
[67] Y. Zhou, Z. Wang, W. Zhou, and X. Jiang. Hey, You, Get Off of My Market: Detecting Malicious Apps in Official and Alternative Android Markets. In Annual Symposium on Network and Distributed System Security (NDSS), 2012.
[64] H. Zhang, Y. Cole, L. Ge, S. Wei, W. Yu, C. Lu, G. Chen, D. Shen, E. Blasch, and K. D. Pham. ScanMe Mobile: A
22