Exp Brain Res (1997) 116:406–420
© Springer-Verlag 1997
R E S E A R C H A RT I C L E
&roles:Nicholas Lindman Port · Daeyeol Lee Paul Dassonville · Apostolos P. Georgopoulos
Manual interception of moving targets I. Performance and movement initiation
&misc:Received: 5 July 1996 / Accepted: 4 March 1997
&p.1:Abstract We investigated the capacities of human subjects to intercept moving targets in a two-dimensional (2D) space. Subjects were instructed to intercept moving targets on a computer screen using a cursor controlled by an articulated 2D manipulandum. A target was presented in 1 of 18 combinations of three acceleration types (constant acceleration, constant deceleration, and constant velocity) and six target motion times, from 0.5 to 2.0 s. First, subjects held the cursor in a start zone located at the bottom of the screen along the vertical meridian. After a pseudorandom hold period, the target appeared in the lower left or right corner of the screen and traveled at 45º toward an interception zone located on the vertical meridian 12.5 cm above the start zone. For a trial to be considered successful, the subject’s cursor had to enter the interception zone within 100 ms of the target’s arrival at the center of the interception zone and stay inside a slightly larger hold zone. Trials in which the cursor arrived more than 100 ms before the target were classified as “early errors,” whereas trials in which the cursor arrived more than 100 ms after the target were classified as “late errors.” N.L. Port · D. Lee · P. Dassonville · A.P. Georgopoulos ( ✉) Brain Sciences Center (11B), Veterans Affairs Medical Center, One Veterans Drive, Minneapolis, MN 55417, USA Tel.: +1-612-725-2282, Fax: +1-612-725-2291, e-mail:
[email protected] N.L. Port · A.P. Georgopoulos Graduate Program in Neuroscience, University of Minnesota, Minneapolis, MN 55455, USA D. Lee · P. Dassonville · A.P. Georgopoulos Department of Physiology, University of Minnesota Medical School, Minneapolis, MN 55455, USA P. Dassonville · A.P. Georgopoulos Department of Neurology, University of Minnesota Medical School, Minneapolis, MN 55455, USA A.P. Georgopoulos Department of Psychiatry, University of Minnesota Medical School, Minneapolis, MN 55455, USA&/fn-block:
Given the criteria above, the task proved to be difficult for the subjects. Only 41.3% (1080 out of 2614) of the movements were successful, whereas the remaining 58.7% were temporal (i.e., early or late) errors. A large majority of the early errors occurred in trials with decelerating targets, and their percentage tended to increase with longer target motion times. In contrast, late errors occurred in relation to all three target acceleration types, and their percentage tended to decrease with longer target motion times. Three models of movement initiation were investigated. First, the threshold-distance model, originally proposed for optokinetic eye movements to constant-velocity visual stimuli, maintains that response time is composed of two parts, a constant processing time and the time required for the stimulus to travel a threshold distance. This model only partially fit our data. Second, the threshold-τ model, originally proposed as a strategy for movement initiation, assumes that the subject uses the first-order estimate of time-to-contact (τ) to determine when to initiate the interception movement. Similar to the threshold distance model, the threshold-τ model only partially fit the data. Finally, a dual-strategy model was developed which allowed for the adoption of either of the two strategies for movement initiation; namely, a strategy based on the threshold-distance model (“reactive” strategy) and another based on the threshold-τ model (“predictive” strategy). This model provided a good fit to the data. In fact, individual subjects preferred to use one or the other strategy. This preference was allowed to be manifested at long target motion times, whereas shorter target motion times (i.e., 0.5 s and 0.8 s) forced the subjects to use only the reactive strategy. &kwd:Key words Target interception · Reaching · Acceleration · Coincidence timing · Human&bdy:
Introduction The ability to reach toward moving targets develops at a very young age (von Hofsten 1982). This ability devel-
407
ops rapidly from birth, and by age 36 weeks infants can accurately intercept a moving object (von Hofsten 1979). Furthermore, infants seem to use a predictive strategy in which the initial movement is directed toward the interception point rather than tracking the moving object (von Hofsten 1980, 1983). Finally, infants are more likely to intercept faster, rather than more slowly moving targets (von Hofsten 1983). However, the quantitative aspects of the strategies used by infants or adults are little understood. Two models have been offered to explain the initiation of the movement in intercepting moving targets; namely the threshold-distance and the threshold-τ model. The first of these was put forth by Collewijn (1972) to explain the optokinetic response time in the rabbit and might be applicable to the interception of moving targets by human subjects. This “threshold-distance model” is so named because it postulates that the stimulus must travel a certain visual angle before a motor response can be elicited. The model expresses the latency or response time as a function of two parameters, as follows:
prior knowledge concerning target motion on the initiation of movement, but did not address the question of how the movement is controlled on-line to produce an accurate interception. The second model of target interception incorporates the concept of the time-to-contact and τ (the tau margin) as proposed by Lee (1976). Under conditions of constant velocity, τ is a variable that could be computed by the brain to determine the time to contact with the object. The variable τ was originally defined under conditions of self motion in an optic flow field (Lee 1976), in which it was proven that τ is equal to the inverse of the rate of dilation of the retinal image. The general form of τ is as follows: τ = d. d
(3)
where d is the distance remaining from the organism to the object, and d. is the time derivative of d (see also Lee and Young 1986). Although τ accurately specifies timeto-contact under constant velocity conditions, experiments indicate that it may also be used as an approximation of time-to-contact in interceptive actions under conditions of deceleration and acceleration (Lee 1976; Lee Response time = processing time + distance threshold time (1) and Reddish 1981; Lee and Young 1986). For example, Lee and Reddish (1981) looked for a variable that ganwhere processing time is a constant to account for delays nets might use to decide when to initiate wing folding in the nervous system, and distance threshold time is the when diving into water. In addition to τ they examined time the stimulus takes to travel a certain distance. Since several other variables, including the actual time to conthreshold time is a function of stimulus velocity, Eq. 1 tact with the water, a height above the water, an approach can be rewritten as follows: velocity, or a time from the initiation of the dive. They found that the movement was initiated after a certain deResponse time = processing time lay from the time τ reached a threshold. This study pro1 + threshold distance (2) vided evidence that τ is a control variable used by the target velocity gannets to determine when to initiate a movement. In adThis general model has also been shown to predict the dition to τ being used as a variable in models for the ini. response times of human smooth pursuit (Carl and Gell- tiation of movement, τ and the time derivative of τ, τ, man 1987) and saccadic eye movements (Gellman and have also been utilized in models of the on-line control Carl 1991) to moving targets. of the decelerating phase of movements (Lee 1976; Zaal Van Donkelaar and colleagues (1992) applied the and Bootsma 1995). threshold distance model to analyze the initiation of In summary, two models have been proposed conmanual interceptive movements toward targets moving cerning the initiation of a movement toward a moving with constant velocity. Two conditions were employed. target. The threshold-distance model has been shown to In the first, the velocity of the target was predictable in a model accurately the initiation of both oculomotor and block of trials, whereas in the second condition the target reaching movements under conditions of constant velocivelocity was randomized from trial to trial. They found ty. The threshold-τ model has been applied successfully that, as target velocity increased, response time de- in modeling the initiation of a movement under condicreased until it reached a plateau under both conditions. tions of constant acceleration.The present experiments The model provided a good fit to the data and yielded a examined performance and initiation of reaching movemean processing time of 195 ms and a mean threshold ments of human subjects to intercept moving targets. The distance of target travel of 5.3 mm (see Eq. 2; values re- companion paper (Lee et al. 1997) presents an analysis fer to the random condition). In the predictable condi- of the on-line control of reaching to intercept moving tion, the first 60 ms of hand movement revealed that sub- targets. This work expands upon previous work (van jects were able to utilize target velocity information Donkelaar et al. 1992) by examining the performance gained from previous exposure to a given target velocity and initiation of reaching to targets moving under condito make systematic changes in initial hand velocity. tions of constant acceleration, constant deceleration, and However, in the random condition, subjects made move- constant velocity. The main objective is to apply the two ments with similar initial velocities across target veloci- above-mentioned models of movement initiation to our ties, which required on-line corrections to produce accu- experimental paradigm. Preliminary results have been rerate interceptions. This study documented an effect of ported (Port et al. 1992).
FH
IK
408
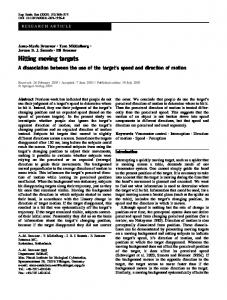
Materials and methods Subjects Six healthy human volunteers (two women and four men, aged 22–36 years) from the University of Minnesota academic environment participated in these experiments. Two of the subjects (1 and 3) were among the authors of the present study (N.L.P., P.D.); the other subjects were naive to the task and the purpose of the experiment. All subjects were right-handed and used their right hand in the experiment. The experimental protocol was approved by the Institutional Review Board. Apparatus Subjects sat unrestrained in front of a two-dimensional (2D) articulated manipulandum (described previously by Georgopoulos et al. 1981), with the eyes approximately 57 cm from a 14-inch color monitor (Gateway 1024NI). The manipulandum was on a table which was approximately 10 cm above the subject’s waist, and the position of the manipulandum where subjects started a trial (hold zone) was approximately 20 cm away from the subject’s abdomen. By moving the manipulandum, subjects controlled the location of a position feedback cursor on the computer screen. The position of the manipulandum in xy coordinates was digitally sampled at a rate of 100 Hz and a spatial resolution of 0.125 mm. The gain was set to 1, so that movement of the feedback cursor had a one-to-one correspondence with that of the manipulandum. The monitor was adjusted for a screen resolution of 640 horizontal and 480 vertical pixels, with a refresh rate of 60 Hz. A personal computer was used for experimental control, visual presentation, and data collection. Behavioral task To begin a trial, the subject moved the feedback cursor (0.6-cm-radius ring) until it was superimposed on a “start zone” (0.3-cm radius) that was centered at the lower vertical meridian of the screen (Fig. 1). After the subject maintained this position for a random period of 1–3 s, a target (0.6-cm radius) appeared in the lower right or left corner of the screen. The target then traveled along a 45º path until it reached the vertical meridian of the screen, where it stopped at a location 12.5 cm directly above the center of the start zone. The subject was required to move the feedback cursor so as to intercept the target just as it reached its final position at the center of the interception zone. A trial was considered successful when the following conditions were met: 1. The subject was required to maintain the cursor around the start zone until 100 ms after target onset. This condition was imposed to prevent anticipatory movements to the target. 2. The subject had to move the manipulandum so that the feedback cursor would enter an invisible positional window (interception zone, 0.6-cm radius) centered on the final target location within 100 ms of the target’s arrival at the meridian. Trials in which the cursor arrived more than 100 ms before the target were considered early errors, whereas those in which the cursor arrived more than 100 ms after the target were considered late errors. 3. After the cursor entered the interception zone, the subject was required to maintain the cursor within an invisible positional window (hold zone, 1.2-cm radius) for 0.5 s. Trials were aborted when any of the above-listed conditions were not met. Subjects were notified of unsuccessful trials with a tone and of successful trials with a click. There were no constraints on the subject’s direction of movement and no instructions or comments on when to initiate the movement. Stimulus characteristics For each trial, the characteristics of target motion were chosen randomly from 36 possible combinations of three types of target acceleration types × six target motion times × two starting posi-
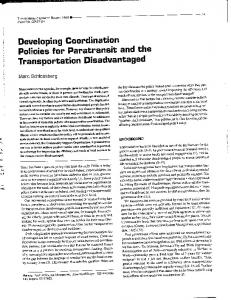
Fig. 1 Schematic diagram of the target-interception task [d(t) distance of target from starting point at time t]&ig.c:/f tions (Fig. 2). Each target moved in a 45º path from the lower corner of the screen to the vertical meridian with one of six possible target motion times ranging from 0.5 to 2.0 s in 0.3-s increments (Table 1). Furthermore, the target moved with one of three possible acceleration types; namely constant acceleration, constant deceleration, or constant velocity. For any trial, then, the distance of the target from its initial position could be described by the standard equation of motion: 2 d (t ) = v0 t + at 2
(4)
where d(t) is the distance of the target from the starting point at time t, v0 is the initial velocity, and a is the acceleration (Fig. 2). Equation 4 is the primary equation of motion that was used to calculate the target motion. Accelerating targets had a starting velocity of 3.0 cm/s and underwent an appropriate constant acceleration to achieve the desired motion time. Decelerating targets had velocity profiles that were mirror images of those of the accelerating targets and underwent constant deceleration to end with a velocity of 3.0 cm/s. Constant velocity targets traveled at the appropriate constant velocity to achieve the required motion time. Table 1 summarizes the 18 possible combinations of target acceleration types and motion times; the additional variable of target starting position (left or right lower corner) brought the total possible combinations to 36. The values in Table 1 were calculated with the following equations, which describe the relationship between the values in Eq. 4: distance A. Constant velocity: v0 = ,a=0 target motion time
(5)
B. Accelerating targets: v0 = 3. 0, a=
2 (distance − v0 × target motion time) target motion time 2
2 × distance C. Decelerating targets: v0 = − 3. 0, a target motion time 2 ( distance − v0 × target motion time) a= target motion time 2
(6)
(7)
where a is acceleration, v0 is initial velocity and the distance the target traveled was fixed at 17.68 cm. Since the target is traveling at a 45° angle and the origin (0,0) of our coordinates is the center of the hold zone, the vertical and horizontal positions of the target at time t are as follows:
409 Fig. 2 Top: target displacement plotted against time for all target motion times (0.5–2.0 s in 0.3-s increments) and target acceleration types (constant acceleration, constant deceleration, and constant velocity). Bottom: target velocity plotted against time; for clarity, only two target motion times (0.5 s and 2.0 s) and all three target acceleration types (constant acceleration, constant deceleration, and constant velocity) are shown&ig.c:/f
Table 1 Stimulus characteristics&/tbl.c:&
Target acceleration type
Target motion time (s)
v0 cm s
a cm s2
Initial τ of the target (s)
Constant acceleration
0.5 0.8 1.1 1.4 1.7 2.0 0.5 0.8 1.1 1.4 1.7 2.0 0.5 0.8 1.1 1.4 1.7 2.0
3.00 3.00 3.00 3.00 3.00 3.00 67.70 41.19 29.14 22.25 17.80 14.68 35.35 22.09 16.07 12.63 10.40 8.84
129.41 47.74 23.76 13.75 8.70 5.84 −129.41 −47.74 −23.76 −13.75 −8.70 −5.84 0.00 0.00 0.00 0.00 0.00 0.00
5.89 5.89 5.89 5.89 5.89 5.89 0.26 0.43 0.61 0.79 0.99 1.20 0.5 0.8 1.1 1.4 1.7 2.0
Constant deceleration
&/tbl.:
Constant velocity
FH IK
FH IK
410
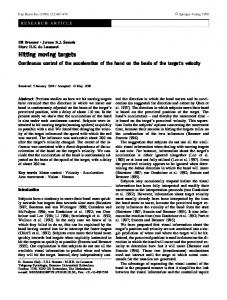
Fig. 3 Theoretical predictions in phase space of the three models examined. In each model the predicted response time is calculated from the equations described in Materials and methods (Eqs. 12 and 14 for the threshold-distance model and Eqs. 16 and 17 for the threshold-τ model). The predicted displacement of the target at the moment of hand movement initiation is plotted against the predicted target velocity. In both the threshold-distance model (left) and threshold-τ model (center), line A is the prediction of the model with zero processing time, and line B is the prediction of the model with a constant processing time. Dotted, dashed, and solid lines are for accelerating, decelerating, and constant velocity targets, respectively&ig.c:/f
y( t ) =
d (t ) 2
x ( t ) left = −12. 5 +
(8) d (t ) 2
or x ( t ) right = 12. 5 −
d (t ) 2
(9)
for targets from the left or right, respectively (Fig. 2). Experimental design Each experimental session comprised five repetitions of the set of 36 conditions, presented in a randomized block design. No nesting was employed. This randomization assured that there was no prior knowledge about the upcoming trial’s target direction, acceleration type, and target motion time. Unsuccessful trials were randomized and repeated until correct performance was achieved. This was done to obtain an equal number of successful trials for all target conditions. Naive subjects were given one practice block immediately before the experimental session. The nonnaive subjects had approximately 20 blocks of practice. Data analysis
Constant temporal error The constant temporal error is the signed difference from the time at which the target arrived in the center of the interception zone until the cursor entered the interception zone. Negative and positive values mean that the cursor arrived before, or after, the target reached the center of the interception zone, respectively. Threshold-distance model In the threshold-distance model (Collewijn 1972), response time is the sum of a constant processing time and the time it takes for the target to travel a certain threshold distance (see Eq. 1). Under conditions of constant target velocity, both the constant processing time and the threshold distance can be determined by a linear regression of response time on the inverse of target velocity. In the present study, targets traveled not only at a constant velocity, but also under conditions of constant acceleration or constant deceleration. To visualize the details of the threshold-distance model, we used phase plots in which the displacement of the target at the moment of hand movement initiation is plotted against the velocity of the target (Fig. 3, left). If the subject was using a threshold-distance strategy with zero processing time, a straight vertical line would be observed in the phase plot (line A in Fig. 3, left). However, if the subject is using the threshold-distance strategy with a constant processing time, a sloped line for constant velocity targets and two curves for the constant accelerating and decelerating targets would be observed (line B in Fig. 3, left). In order to solve for threshold time, Eq. 4 is rewritten in quadratic form: time I F a × threshold 2 H K + (v 2
0
− threshold distance = 0
(10)
where a is target acceleration and v0 is the initial target velocity of the target. Therefore, for a=0 (constant velocity targets):
General Threshold time =
Standard statistical analyses (Snedecor and Cochran 1989) were used, including analysis of variance (ANOVA). The 5% probability level was taken as the level of statistical significance for rejecting the null hypothesis. For the ANOVA of the percentage of early and late errors, when the sample size (n) was less than 50, 0% was counted as 1/(4n) and 100% was counted as (n−¼)/n, then the percentages were arcsine transformed. Nonlinear curve fitting was performed using the Nelder-Meade simplex search method (MATLAB version 4.2, 1994; The MathWorks, Natick, Mass.). The hand position was smoothed and differentiated using the finite impulse response (FIR) method (pass band 0–0.5 Hz; stop-band 13–50 Hz). For a given movement, response time was defined as the first time hand velocity reached 10% of its peak velocity.
× threshold time)
threshold distance v0
(11)
and thus we obtain the same equation as the threshold-distance model (Eq. 2): Response time = processing time 1 + threshold distance target velocity
F H
I K
(12)
For a≠0 (constant acceleration and deceleration targets), by the quadratic equation: Threshold time =
− v0 +
v0 2 + 2 a × threshold distance a
(13)
411
and in the threshold-distance model:
motion time), the initial τ might already be less than the threshold τ. Under these circumstances, we assumed that the subjects would begin moving immediately after the constant processing time. It is this assumption that produces the sudden change in the prediction lines in the phase space (line B, Fig. 3, center). Otherwise, we assumed that the subjects waited until τ decreased below the threshold τ and then began moving after the constant processing delay. In this latter condition, response time is the sum of the processing time and the solution for threshold time in the following equation:
Response time
τ=
Fig. 4 Top: For each subject, mean (±SEM) constant temporal errors are plotted against target motion time for all trials. Bottom: Mean constant temporal errors computed for successful trials only. Positive temporal errors indicate that the hand arrived later than the target. Triangles and dotted lines, accelerating targets; squares and dashed lines, decelerating targets; circles and solid lines, constant-velocity targets&ig.c:/f
−v + v02 + 2 a × threshold distance = processing time + 0 a
(14)
The constant processing time and threshold distance are then determined using a nonlinear curve-fitting procedure and Eqs. 12 and 14.
Threshold-τ model The τ of the target, which is a continuous variable changing with time, is defined as the distance of the target to the interception zone at time t divided by the velocity of the target at time t (see Eq. 3). In the threshold-τ model, a movement is initiated after a certain processing time from the moment at which the τ of the target decreases below a certain threshold. The initial τ of the target (i.e., τ at the time of target onset) is summarized in Table 1. Since the τ of target is the ratio of target position to target velocity, the threshold-τ model without a constant processing time would produce in the phase plots a straight line with a negative slope (line A, Fig. 3, center). The threshold-τ model with a constant processing time yields a straight line with a different slope for constant velocity targets, and curved lines for accelerating and decelerating targets (line B, Fig. 3, center). For targets that moved with a high initial velocity (e.g., decelerating target with 0.5 s
=
target distance = target velocity
F H
a × threshold time 2 2 v0 + a × threshold time
17. 68 − v0 × threshold time +
I K
(15)
where 17.68 (cm) is the distance between the starting position of the target and the interception zone. Therefore, for a=0 (constant velocity targets), 17. 68 − τ v0 , Response time = processing time + (16) v0 and for a≠0 (accelerating and decelerating targets), Response time
= processing time +
b
g baτ + v g − 2a(v τ −17. 68)
− aτ + v0 +
2
0
a
0
(17)
Dual-strategy model The dual-strategy model is based on the assumption that on each trial the subject uses one of two alternative strategies, reactive or predictive, to decide when to initiate the movement. The threshold-distance model as described above is used to model the response time according to the reactive strategy. Similarly, the
412 Table 2 Effects of the target on the percentage of early and late errors. The degrees of freedom are (1,2) for target acceleration type and (1,5) for target movement time&/tbl.c:& Subject
Early arrival
Late arrival
1 2 3 4 5 6 1 2 3 4 5 6
Tail probability Target acceleration type
Target motion time
0.000 0.002 0.000 0.000 0.000 0.000 0.002 0.006 0.000 0.029 0.002 0.000
0.283 0.127 0.109 0.096 0.207 0.009 0.018 0.003 0.000 0.062 0.000 0.000
&/tbl.:
Fig. 5 The percentage of early and late arrival movements is plotted against target motion time for all three target acceleration types. Conventions are as in Fig. 4&ig.c:/f threshold-τ model is used to model the response time according to the predictive strategy. It is further assumed that the predictive strategy is more time consuming to implement than the reactive strategy. Therefore, when the predictive strategy results in a smaller (faster) response time than the reactive strategy, the subject should respond according to the reactive strategy only. A single, constant processing-time term was determined for both models. During the curve-fitting procedure, a given trial was assigned to either the reactive or predictive strategy, depending on which strategy yielded a response time closer to the observed value. Therefore as a result of the curve fitting, in addition to getting estimates for the parameters of the model (i.e., a single processing time, a threshold distance, and a threshold τ) it was also determined which strategy was used in individual trials. The phase plot of Fig. 3 (right) demonstrates the position and velocity of the target at hand movement onset, as predicted by the dual-strategy model.
Results Constant temporal errors A total of 2614 movements were made by six subjects, of which 1080 of 2614 (41.3%) were considered suc-
cessful (see Materials and methods). Analysis of the temporal errors revealed several systematic influences of the target motion parameters that were consistent across subjects. For all trials (Fig. 4, top) and for successful trials considered separately (Fig. 4, bottom), movements to decelerating targets tended to arrive at the target zone early with respect to the arrival of the target (negative temporal errors). In contrast, movements to accelerating and constant-velocity targets tended to arrive late (positive temporal errors). Regardless of acceleration type, movements arrived earlier for longer target motion times. An ANOVA revealed that for all subjects there were significant effects of target acceleration type (P