ANNALS OF GEOPHYSICS, VOL. 45, N. 1, February 2002
Mapping plasma structures in the high-latitude ionosphere using beacon satellite, incoherent scatter radar and ground-based magnetometer observations Jürgen Watermann (1), Gary S. Bust (2), Jeffrey P. Thayer (3), Torsten Neubert (4) and Clayton Coker (2) 1 ( ) Danish Meteorological Institute, Copenhagen, Denmark (2) Applied Research Laboratories, The University of Texas at Austin, TX, U.S.A. (3) SRI International, Menlo Park, CA, U.S.A. 4 ( ) Danish Space Research Institute, Copenhagen, Denmark
Abstract In the autumn of the year 2000, four radio receivers capable of tracking various beacon satellites were set up along the southwestern coast of Greenland. They are used to reconstruct images of the ionospheric plasma density distribution via the tomographic method. In order to test and validate tomographic imaging under the highly variable conditions often prevailing in the high-latitude ionosphere, a time interval was selected when the Sondrestrom incoherent scatter radar conducted measurements of the ionospheric plasma density while the radio receivers tracked a number of beacon satellites. A comparison between two-dimensional images of the plasma density distribution obtained from the radar and the satellite receivers revealed generally good agreement between radar measurements and tomographic images. Observed discrepancies can be attributed to F region plasma patches moving through the field of view with a speed of several hundred meters per second, thereby smearing out the tomographic image. A notable mismatch occurred around local magnetic midnight when a magnetospheric substorm breakup occurred in the vicinity of southwest Greenland (identified from ground-based magnetometer observations). The breakup was associated with a sudden intensification of the westward auroral electrojet which was centered at about 69° and extended up to some 73° corrected geomagnetic latitude. Ground-based magnetometer data may thus have the potential of indicating when the tomographic method is at risk and may fail. We finally outline the application of tomographic imaging, when combined with magnetic field data, to estimate ionospheric Joule heating rates.
1. Introduction
Key words high-latitude ionosphere – ionospheric tomography – magnetospheric substorm – auroral electrojet – Joule heating
The high-latitude ionosphere is strongly coupled to the magnetosphere and influenced by its dynamic variations. The magnetosphere responds to variations of the solar wind (a stream of ionized particles, predominantly protons and electrons) and the embedded interplanetary magnetic field and thus ultimately to solar activity. The most important solar wind parameters which have significant bearing on the state of the
Mailing address: Dr. Jürgen Watermann, Danish Meteorological Institute, Solar-Terrestrial Physics Division, Lyngbyvej 100, DK-2100 Copenhagen Ø, Denmark; e-mail:
[email protected]
177
Jürgen Watermann, Gary S. Bust, Jeffrey P. Thayer, Torsten Neubert and Clayton Coker
magnetosphere are plasma density, temperature, bulk speed, and the magnitude and orientation of the interplanetary magnetic field. Variations in these parameters lead to variations of the state of the magnetosphere through electrodynamic interaction. They are eventually propagated to the high-latitude ionosphere via electric fields, fieldaligned currents and energetic particle precipitation. The coupled solar wind-magnetosphereionosphere system is generally very dynamic during and just after solar maximum (the most recent of which occurred in the years 2000-2001). Since solar wind-magnetosphere-ionosphere interaction is most direct in the auroral zone and polar cap in a broad sense (i.e. at geomagnetic latitudes exceeding some ± 60°) the high-latitude ionosphere can be highly variable on time scales of solar wind changes, which may be less than a few minutes. Ionospheric effects at high latitudes are particularly dramatic when the interplanetary magnetic field is oriented southward (i.e. opposite to the main geomagnetic field), in which case field line merging can occur, or when its orientation fluctuates a great deal. In recent years, with the advent of satellites equipped with stable multi-frequency radio transmitters (beacon satellites) the method of ionospheric tomography has become an important tool for imaging the ionospheric plasma density distribution. Various measurement techniques, based on satellite-to-ground or satellite-to-satellite observations of the Total Electron Content (TEC), and different inversion schemes have been developed. Initially, a differential Doppler technique was applied simultaneously to a meridian chain of receivers in order to determine the latitudinal variation of TEC profiles (Leitinger et al., 1984). Subsequently, computer tomography was developed to produce 2D images of the ionospheric plasma density (Austen et al., 1988). The image reconstruction algorithm was further developed in various ways (e.g., Vasicek and Kronschnabl, 1995) to improve its accuracy. The tomographic method has successfully been applied to the mid-latitude ionosphere (e.g., Bust et al., 1997) where the ionosphere tends to be stationary over the time interval needed for tomographic inversion (typically up to 20 min, depending on the satellites tracked). Application of the method to high geomagnetic latitudes (auroral zone and
polar cap) has also been reported (e.g., Mitchell et al., 1995; Pryse et al., 1997) though little experience has yet been gained. Bernhardt et al. (1998) present tomographic images of the ionospheric trough and of narrow auroral arcs obtained at high latitudes under stable ionospheric conditions. Since the ionosphere tends to be very variable at high geomagnetic latitudes, where its state may change on time scales shorter than those needed to collect reasonably complete satellite observations for reconstructing tomographic images, satisfactory performance of the tomographic method is not yet confirmed. In order to address some of the problems of tomographic imaging at high latitudes, a chain consisting of four satellite receivers was set up along the southwestern coast of Greenland, colocated with several ground-based magne-tometer stations and the Sondrestrom Incoherent Scatter Radar (ISR) facility. The ionospheric plasma density distribution, among other parameters, can be derived from ISR measurements on relatively short time scales and be compared with tomographic images obtained from beacon satellite observations. We thus have a procedure at hand to test the tomographic method at high latitudes, validate it if possible, and try to determine under which conditions it fails. Similar verification concepts were employed by Foster et al. (1994) and Mitchell et al. (1995). The former examined storm-time observations of the mid-latitude ionosphere and showed that largescale discrete F region ionization enhancements and a deep ionospheric trough were recognized in both, incoherent scatter radar data and tomographic images. The latter demonstrated, by comparing tomographic images with EISCAT observations of the ionospheric plasma density, that the tomographic method can render accurate results in the auroral zone if the ionosphere remains stable. Next we give a description of the experiment, specifically of the instruments used. This is followed by an evaluation of the performance of the tomographic method. We then outline the estimation of Joule heating as a science application well suited for the particular situation in Greenland. We finally summarize the results and elaborate on future work. 178
Imaging high-latitude ionospheric plasma structures
2. Experiment description
Radar facility operated by SRI International. Those instruments were used for this study and are described below. The southern part of Greenland is most often located in the auroral zone and the central and northern parts in the polar cap. The boundary between auroral zone and polar cap is often found in the vicinity of Sondrestrom but can also shift considerably in latitude, depending on the local time and interplanetary medium. We are thus in a situation where we apply tomographic imaging to the latitudes which cover both, auroral zone and polar cap.
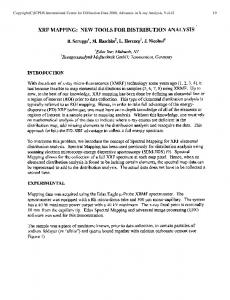
A map of Greenland is reproduced in fig. 1. It shows the magnetometer sites of the Danish Meteorological Institute (DMI), the satellite receiver stations of the Applied Research Laboratories at the University of Texas, Austin (ARL:UT), and the Sondrestrom Incoherent Scatter
2.1. Satellite radio receivers The Coherent Ionospheric Doppler Receiver (CIDR) was developed at ARL:UT. It is capable of tracking the coherent beacon from the Navy Ionospheric Measurements Satellites (NIMS) as well as other satellites including RADCAL, ARGOS and GFO, and can receive three different satellites simultaneously at data rates up to 1 kHz. The measurements from an array of receivers are converted into relative TEC profiles and ingested into an inversion algorithm which renders a threedimensional image of the ionospheric plasma density distribution. For an outline of the algorithm consult a recent paper by Bust et al. (2001) and references therein. For our paper, twodimensional maps in a specific vertical plane were extracted from the 3D inversion results in order to facilitate comparison with radar and magnetometer measurements. The tomography algorithm requires, in its present form, an ionospheric plasma density pattern which is stationary over the time of the radio reception, typically between 10 and 20 min. Fig. 1. Greenland with the magnetometer sites of the Danish Meteorological Institute, DMI (full black circles with three-letter station codes), the satellite receiver stations of the Applied Research Laboratories at the University of Texas, Austin, ARL:UT (full gray diamonds with numbers), and the Sondrestrom (STF) Incoherent Scatter Radar facility operated by SRI International (open black diamond). Geomagnetic latitude contours (dashed) are plotted in addition to geographic coordinates (dotted), and the ISR antenna scan trace at 350 km altitude is marked by a heavy line.
2.2. Incoherent scatter radar The Sondrestrom Incoherent Scatter Radar (Kelly, 1983) utilizes techniques which allow the direct measurement of basic ionospheric plasma parameters along the radar beam, including electron number density, electron and ion temperatures, and ion line-of-sight velocity. The 32-m parabolic antenna is fully steerable which 179
Jürgen Watermann, Gary S. Bust, Jeffrey P. Thayer, Torsten Neubert and Clayton Coker
inverted to infer the temporal and spatial distribution of the equivalent ionospheric current (thinsheet ionospheric Hall current assumed to flow at a mean E region height of between 110 and 115 km) crossing the magnetometer chain (Popov et al., 2001). The current density depends linearly on the product of electric field and Hall conductance (height-integrated conductivity) the latter of which depends primarily on the electron density profile, c.f. Section 4. Significant variations in the current strength indicate significant variations of the electric field or the electron density or both. The magnetometer chain can thus serve as an indicator of a changing ionosphere which potentially poses problems to the tomographic method by rendering its assumption of stationary plasma density distribution invalid. On the other hand, can the magnetometers serve to complement tomographic images by providing a means to estimate the ionospheric electric field and Joule heating rate.
allows, for instance, to determine the plasma density distribution in a vertical plane oriented along the magnetic meridian through Sondrestrom. We operated the radar in a mode in which the antenna performs a sequence of elevation scans between geomagnetic north (at a declination of