Article
Mass Spectrometry-Based Method of Detecting and Distinguishing Type 1 and Type 2 Shiga-Like Toxins in Human Serum Christopher J. Silva *, Melissa L. Erickson-Beltran, Craig B. Skinner, Stephanie A. Patfield and Xiaohua He Received: 29 September 2015; Accepted: 9 November 2015; Published: 2 December 2015 Academic Editor: Florian Lang Western Regional Research Center, United States Department of Agriculture, Albany, CA 94710, USA;
[email protected] (C.J.S.);
[email protected] (M.L.E.-B.);
[email protected] (C.B.S.);
[email protected] (S.A.P.);
[email protected] (X.H.) * Correspondence:
[email protected]; Tel.: +1-510-559-6135; Fax: +1-510-559-5758
Abstract: Shiga-like toxins (verotoxins) are responsible for the virulence associated with a variety of foodborne bacterial pathogens. Direct detection of toxins requires a specific and sensitive technique. In this study, we describe a mass spectrometry-based method of analyzing the tryptic decapeptides derived from the non-toxic B subunits. A gene encoding a single protein that yields a set of relevant peptides upon digestion with trypsin was designed. The 15 N-labeled protein was prepared by growing the expressing bacteria in minimal medium supplemented with 15 NH4 Cl. Trypsin digestion of the 15 N-labeled protein yields a set of 15 N-labeled peptides for use as internal standards to identify and quantify Shiga or Shiga-like toxins. We determined that this approach can be used to detect, quantify and distinguish among the known Shiga toxins (Stx) and Shiga-like toxins (Stx1 and Stx2) in the low attomole range (per injection) in complex media, including human serum. Furthermore, Stx1a could be detected and distinguished from the newly identified Stx1e in complex media. As new Shiga-like toxins are identified, this approach can be readily modified to detect them. Since intact toxins are digested with trypsin prior to analysis, the handling of intact Shiga toxins is minimized. The analysis can be accomplished within 5 h. Keywords: Keywords: mass spectrometry; Shiga toxins; verotoxins; multiple reaction monitoring method (MRM); STEC; serum; shigatoxigenic and enterohemorrhagic strains of Escherichia coli; EHEC; Enterobacter
1. Introduction Although the Shiga-like toxins are associated with various bacterial strains, they are actually produced by genes under the control of lambdoid phages that infect the bacterium [1]. This means that when the phage is reproducing lysogenically (reproducing with each of the host’s divisions), toxins are not normally produced or released. If, however, the host’s DNA is damaged or if it is stressed, then the phages reproduce lytically. During lytic replication, the metabolism of the host is diverted to assemble intact phages, express stx genes, and produce toxin molecules which all are released when the host cell is ruptured [2]. Bacterial food poisoning by Shiga-like toxin-producing Escherichia coli (E. coli) (STEC) is a considerable worldwide health concern [3–5]. The phages can produce two types of Shiga-like toxins: Stx1 and Stx2 [6]. Stx1 has a nearly identical amino acid sequence as Shiga toxin (Stx) from Shigella dysenteriae [6]. Stx2 differs significantly from Stx1, but is a much more potent toxin in vivo [7–9]. There are several subtypes of Stx within each type (Stx1: four subtypes; Stx2: seven subtypes), which vary in sequence and toxicity. The multiplicity of Stx types complicates the analysis of toxins. Toxins 2015, 7, 5236–5253; doi:10.3390/toxins7124875
www.mdpi.com/journal/toxins
Toxins 2015, 7, 5236–5253
The interactions of bacterial defense mechanisms coupled with the vagaries of phage replication also complicate the analysis of Shiga-like toxins. The host bacteria may be infected by more than one lambdoid phage (φ24B ) and not all those infecting phages are capable of lytic replication and release of toxins [10]. Thus, the presence of a toxin gene does not necessarily mean that it will be expressed. Furthermore, the phages can infect different strains of E. coli and other species of bacteria [11]. As a result, Shiga-like toxins may be produced by E. coli strains other than O157:H7 and by other species of bacteria such as Enterobacter cloacae and Citrobacter freundii [11–13]. A recent case of possible foodborne illness was traced back to a Stx-expressing (Stx1e) Enterobacter cloacae strain [14]. The production of Shiga-like toxins and retention of the stx genes can be transient [15]. All of these constraints complicate the analysis of Shiga-like toxins. Human serum amyloid P component (HuSAP) provides protection from Stx2 toxins in animal models [16,17]. Mice injected with HuSAP remained healthy after being injected with lethal levels of Stx2 [18]. Transgenic mice expressing HuSAP were similarly protected [18]. This ability to neutralize Stx2 is not found in the serum from other mammals [16,19]. In vivo rodent and cell based assays have shown that Stx2 is more a potent toxin that Stx1 [7–9]. Detecting Stx1 and Stx2 in human serum may require different approaches, since HuSAP binds Stx2, but not Stx1 [16]. Shiga-like toxins have been detected using a number of different methods. The most common means of detection is to perform PCR on an isolate to determine whether it contains the toxin gene. This approach is limited, since the production of the toxin is regulated by the phage, so the presence of the toxin gene does not guarantee the expression of that toxin. Several antibody-based methods of detecting toxins have been developed, but they are only available for some subtypes [20–23]. Mass spectrometry has been used to study the structure of the holotoxins [24–34], but has not been used as a method of detection and quantification. Since the toxin is ultimately responsible for the observed symptoms, development of an assay that detects and quantifies all of the Shiga and Shiga-like toxins would be extremely valuable. Previously, we developed a mass spectrometry based method of detecting Shiga-like toxins in complex matrices [35]. It is based on the well-established multiple reaction monitoring (MRM) method. In the MRM method, samples are digested with proteases to yield sets of characteristic peptides, which are analyzed by a mass spectrometer. Those peptides determined to be suitable are optimized for a MRM method. We use 15 N-labeled analogs of these peptides as internal standards, since they have identical physico-chemical properties, such as chromatographic retention time and MS fragmentation. In addition, these 15 N-labeled internal standards can be used to quantitate the amount of analyte peptide in a sample. Since the MRM method does not require the intact protein for analysis [36–38], it can be used as a safe and effective means of detecting toxins. The method is extremely sensitive and can detect analyte decapeptides in the attomole (10´18 mole) range per injection (~5 femtomole/mL). In this work we describe how the method can be used to detect Stx2 and Stx1 variants including Stx1a and the recently described Stx1e. We describe how to shorten the time necessary to perform the analysis. We also wish to report the production of a single protein that can be used to easily and cheaply generate the needed 15 N-lableled tryptic peptide analogs of the unlabeled MRM peptides. In addition, we will show how this method can be used, in conjunction with chaotropes, to detect the presence of Stx1 and Stx2 toxins in complex media, including human serum. 2. Results 2.1. Generation of the Stx 15 N-Labeled Internal Standard Protein (15 N-Stx-ISP) The 15 N-labeled analog of a peptide will have the same physico-chemical properties (e.g., chromatographic properties and MS fragmentation) as that of the unlabeled analog. The use of 15 N-labeled internal standards allows us to identify and quantify only those peaks that have a retention time and MS fragmentation corresponding to that of the internal standards. To simplify
5237
Toxins 2015, 7, 5236–5253
the process of generating the multiple internal standards needed to identify all types and subtypes of Shiga toxins detailed in this manuscript, we generated a single gene expressing a protein (Stx internal standard protein (Stx-ISP)) that would yield a useful set of peptides upon tryptic digestion, thus greatly simplifying the process of internal standard generation. These peptides include the analyte decapeptides for Stx2 (YNEDDTFTVK (Stx2a or f), YNENDTFTVK (Stx2b, c, or d), YNEDNTFTVK (Stx2e), and YNGDNTFTVK (Stx2g)); analogous analyte decapeptides for Stx1 (YNDDDTFTVK, YNDDDSFTVK, and YNDDDTFTAK); peptides that can be used to distinguish among the Stx1a and Stx1e subtypes (ELFTNR and ELYTTR); and other peptides that can be used to distinguish among the other Stx1 and Stx2 subtypes. The protein included an N-terminal His tag to facilitate purification by immobilized metal affinity chromatography (IMAC). The gene sequence included unique XhoI and NdeI cloning sites to facilitate subsequent subcloning. The sequence was designed [39] to generate a protein that would quantitatively yield the desired peptides. These internal standards are the key to detecting and distinguishing among the known/common Stx2 and Stx1 subtypes. The BL21 cells were used to express the protein encoded by the Stx-ISP gene. They were grown in minimal medium supplemented with 15 NH4 Cl to generate, after IMAC, the 15 N-labeled protein [35,40]. Mass spectrometry-based analysis showed that all of the relevant peptides were observed in the 15 N samples (vide infra). The 15 N-labeled internal standard was subjected to reduction/alkylation/trypsin digestion and analyzed by mass spectrometry. No signals from unlabeled peptide analogs were observed in samples of 15 N-labeled material nor were any signals corresponding to the 15 N-labeled material observed in the unlabeled material. The area ratios indicated that the peptides were at least 99.4% isotopically pure. 2.2. MRM Optimization of Stx1 Related Tryptic Peptides The multiple reaction monitoring method (MRM) is a highly specific and selective method that is routinely used to identify and quantify multiple specific peptides from a complex mixture [35–38]. This method employs a triple quadrupole mass spectrometer. The first quadrupole is used as a filter to select only those peptides with a mass to charge ratio of interest (m/z). The second quadrupole is used to fragment those selected peptides using a specified collision energy. The resulting fragment ions pass into the third quadrupole, where they are filtered again according to predetermined m/z, to select only those daughter ions of interest for detection. The mass spectrometer cycles through each set of m/z filters (transitions) in as little as 50 milliseconds, so several transitions can be measured in a short time; hence, the “multiple” in multiple reaction monitoring. In order for this method to be effective, peptides of interest must be produced and optimized for collision energy and various other parameters. To this end, five tryptic peptides (YNDDDTFTVK, YNDDDSFTVK, YNDDDTFTAK, ELFTNR and ELYTTR) were commercially synthesized and obtained in at least 95% purity. The source parameters and the Q2 offset voltage (“collision energy”) were adjusted separately for each peptide to yield optimal fragmentation. The optimized parameters for analyte decapeptides for Stx2 have been previously reported [35]. The analyte decapeptides for Stx1, YNDDDTFTVK, YNDDDSFTVK, and YNDDDTFTAK, were observed to fragment in very similar fashions to those of Stx2 and in all cases the y8 fragment ion [41] (containing amino acids DDDTFTVK (m/z = 940.1; z = 1), DDDSFTVK (m/z = 926.4; z = 1), or DDDTFTAK (m/z = 891.4; z = 1), respectively) produced the most intense signals, so it was used for quantitation. The b2 ion (YN (m/z = 281.1; z = 1)) was very intense, but was not used for quantitation due to the small size of the fragment and less specific nature of the YN daughter ion. Similar conditions were optimal for the production of the y7 and y6 ions (Table S1) from these three decapeptides. Two other tryptic peptides, ELFTNR and ELYTTR, are produced by the digestion of Stx1a and Stx1e, respectively. The optimal fragments of the ELFTNR peptide were the y4 (m/z = 537.3; z = 1), a2 (m/z = 215.1; z = 1), and y2 (m/z = 289.2; z = 1) ions (containing the amino acids FTNR, EL and TNR, respectively) [41]. For the ELYTTR peptide, the optimal fragments were the y4 (m/z = 540.3; z = 1), y3
5238
Toxins 2015, 7, 5236–5253
(m/z = 377.2; z = 1), and y2 (m/z = 276.2; z = 1) ions (corresponding to amino acids YTTR, TTR, and TR, respectively). The y4 ions from these peptides were used to detect and quantitate these peptides in subsequent experiments. These data are summarized in Table S1. 2.3. Using Characteristic Stx1 Tryptic Peptides to Distinguish between the Stx1 Subtypes The analyte decapeptides YNDDDTFTVK, YNDDDSFTVK, and YNDDDTFTAK associated with Stx1 have different precursor ion masses (609.3 (m/z; z = 2), 602.3 (m/z; z = 2), and 595.3 (m/z; z = 2), respectively), which make them readily distinguishable from one another. All three differ from the four analyte decapeptides from Stx2 (616.3, 615.8, 615.8, and 579.8 (m/z; z = 2)), which permits the ready distinction between Stx1 and Stx2. The signals from the y8 ions (Table S1) from the tryptic digest of the 15 N-labeled Stx internal standard protein (15 N-Stx-ISP) show only a single signal even though all of the other analyte decapeptides are present in those samples (Figure S1). This indicates that the analyte decapeptides can be used to detect the known Stx1 and Stx2 variants. Distinguishing between Stx1a and Stx1e is complicated by the fact that they possess the same analyte decapeptide (YNDDDTFTVK). Trypsin digestion of Stx1a or Stx1e yields the peptides ELFTNR or ELYTTR, respectively. Stx1a produces the peptide ELFTNR with a precursor ion of 390.2 (m/z; z = 2) and a product ion of 537.3 (m/z; z = 1; y4 ), while Stx1e produces ELYTTR (precursor ion 391.7 (m/z; z = 2); product ion 540.3 (m/z; z = 1; y4 )), which can be used to distinguish the two. Analysis of the trypsin digest of the 15 N-Stx-ISP showed that each peptide had a single signal and that they had different chromatographic retention times (Figure S2). Again, these signals were derived from a sample containing all of the other tryptic peptides. In this way, Stx1 and Stx2 subtypes can be distinguished and Stx1a and Stx1e can be distinguished from one another. 2.4. Quantitating Stx1 Toxins and Their Subtypes The MRM method can be used both to detect the presence of Stx1 toxins and to quantitate the amount of toxin in the sample, by adding a fixed amount of the appropriate 15 N-labeled internal standard decapeptide to each sample. The UV/Vis absorptions of the three commercially synthesized Stx1 analyte decapeptides were used to calculate the concentration of solutions containing those peptides. Those solutions were mixed with a fixed amount of the tryptic digest of the 15 N-Stx-ISP to yield samples with 20, 50, 100, 1000, or 10,000 attomoles of the Stx1 analyte decapeptides per injection. The samples were analyzed by mass spectrometry. The area ratios of the y8 ions from the three synthetic analyte decapeptides to their corresponding 15 N-labeled decapeptides were determined. These values were used to prepare calibration curves that permit us to quantitate the amount of Stx1 in a sample (Figure S3). The peptides ELFTNR and ELYTTR can be used to distinguish between Stx1a and Stx1e, respectively. An analogous procedure was used to prepare calibration curves based on the signal of the y4 ions of ELFTNR and ELYTTR peptides to a fixed amount of their corresponding 15 N-labeled analogs. These values were used to prepare the calibration curves (Figure S4). These results indicated that we could both quantitate the Stx1 present in a sample and distinguish between Stx1a and Stx1e. Both sets of calibration curves were linear with excellent correlation coefficients (R2 > 0.990). 2.5. Shortening the Reduction/Alkylation/Trypsin Time Our previously described method had an overnight digestion with trypsin. We tested whether our standard reduction/alkylation and subsequent trypsin digestion procedure could be shortened. Samples of bacterial broth supernatants from E. coli producing Stx2a, Stx2c, Stx2e, Stx2g, or Stx1a were reduced/alkylated and trypsin digested, in solution, for either the standard period of time (overnight) or a shortened period (2 h). The resulting samples were analyzed and quantitated by mass spectrometry. These results are summarized in Table 1. We determined that shortening the reduction/alkylation period and the trypsin digestion period did not result in a statistically significant reduction in signal (p > 0.25). We concluded that shortening the total time 5239
Toxins 2015, 7, 5236–5253
to reduce/alkylate and trypsin digest a sample to 3 h resulted in a digestion that was equivalent to and in some cases better than 2 h of reduction/alkylation followed by an overnight digestion. Table 1. Table of the amount of Shiga-like toxins detected after a 2 h or overnight (ON) digestion with trypsin. Values are reported as fmol/injection. Toxin
2h
ON
Stx1a Stx1e Stx2g Stx2e Stx2a Stx2c
1.3 + 0.2 0.2 + 0.1 0.9 + 0.5 0.11 + 0.02 4.2 + 0.9 1.2 + 0.2
0.5 + 0.1 0.2 + 0.1 0.5 + 0.1 0.05 + 0.02 5.0 + 1.7 1.1 + 0.1
2.6. Detection of Stx1a, Stx1e, Stx2a, Stx2c, Stx2g, and Stx2e in Bacterial Broths Bacterial cultures known to produce Stx1a, Stx1e, Stx2a, Stx2c, Stx2e, and Stx2g were grown in a manner to facilitate the production of these toxins. The filter sterilized samples were processed (reduction/alkylation/trypsin digestion) and then analyzed by mass spectrometry. The chromatograms of the y8 ions (Table S1) of the analyte decapeptides from the Stx2 containing samples are shown in Figure 1. The chromatograms of the y8 ion (Table S1) from the analyte decapeptide from Stx1a and Stx1e are shown in Figure 2. In addition, the signals from y4 ions (Table S1) of the ELFTNR and ELYTTR peptides (Stx1a and Stx1e, respectively) are included in Figure 2. All of the Stx2 subtypes were readily detected in the TSB medium. The Stx1a and Stx1e samples were readily detectable in the LB medium. In addition, the signals from the ELFTNR and ELYTTR peptides were used to distinguish between Stx1a and Stx1e, respectively. The amount of toxin in the samples varied from approximately 2.5 fmol/mL (Stx1e) to 530 fmol/mL (Stx1a). This indicates that this method can Toxinsbe2015, 7 detect Shiga-like toxins in complex bacterial media. used to
MRM Intensity
4200
1400
640
3500 i
2100
700
320
1750
i i
i ii
0 10
15
ii
0 10
Stx2a (y8)
ii
0
15
Stx2c (y8)
10
ii
0
15
Stx2e (y8)
10
15
Stx2g (y8)
Retention time (min.) Figure 1. Chromatograms of the MRM signal intensities derived from the y ions from the analyte
Figure 1. Chromatograms of the MRM signal intensities derived 8from the y8 ions from decapeptides of Stx2a (YNEDDTFTVK), Stx2c (YNENDTFTVK), Stx2e (YNEDNTFTVK), and Stx2g the (YNGDNTFTVK). analyte decapeptides of are Stx2a (YNEDDTFTVK), Stx2c (YNENDTFTVK), Stx2e The samples derived from sterile filtered TSB broths from Stx2a, Stx2c, Stx2e, or Stx2g producing Escherichia coli strains and analyzed by mass spectrometry. The signal from the (YNEDNTFTVK), and Stx2g (YNGDNTFTVK). The samples are derived from sterile natural abundance decapeptide (i) is from the toxin and is not normalized. The corresponding signal filtered TSB broths from Stx2a, Stx2c, Stx2e, or Stx2g producing Escherichia coli strains from the 15 N-labeled decapeptide is from the added internal standard (ii) and is included to show the and retention analyzedtime byofmass spectrometry. from tothe decapeptide the analyte decapeptideThe and signal is normalized 500natural to allowabundance the signal from the analyte (i) decapeptide to beand viewed same plot. is from the toxin is on notthenormalized. The corresponding signal from the 15N-labeled decapeptide is from the added internal standard (ii) and is included to show the retention time of the analyte decapeptide and is normalized to 500 to allow the signal from the analyte decapeptide to be viewed on the same plot.
ensity
5000
7200
5240 700
2100 i
7
filtered TSB broths from Stx2a, Stx2c, Stx2e, or Stx2g producing Escherichia coli strains and analyzed by mass spectrometry. The signal from the natural abundance decapeptide (i) is from the toxin and is not normalized. The corresponding signal from the 15N-labeled decapeptide is from the added internal standard (ii) and is included to show the retention of the analyte decapeptide and is normalized to 500 to allow the signal from the analyte Toxins 2015, 7,time 5236–5253 decapeptide to be viewed on the same plot.
Toxins 2015, 7
MRM Intensity
5000
700
7200
2100 i
2500
350
3600
i
i
8
i
ii
0
1050
ii
0
ii
0
ii
0
15 were digested with trypsin and then spiked with the trypsin These spiked samples 10 digested 15 N-Stx-ISP. 10 15 10 Stx1a 15 10 Stx1e 15 Stx1a (y8) ELFTNR(y4) ELYTTR(y4) Stx1e (y8) were then analyzed by mass spectrometry. The resulting chromatograms were examined to determine if Retention timeserum (min.) there was a molecule present in the trypsin digested human that would interfere with this analysis. None of these chromatograms showed a signal with the same precursor/product ion and the same FigureFigure 2. Chromatograms of theof MRM signal signal intensities derived from the y8the ions analyte ions the from 2. Chromatograms the MRM intensities derived from y8from chromatographic retention time as the corresponding 15N-labeled internal standard. These decapeptide (YNDDDTFTVK; Stx1a and Stx1e) or the y ions from ELFTNR (Stx1a) or ELYTTR the analyte decapeptide (YNDDDTFTVK; Stx1a and 4Stx1e) or the y4 ions from are ELFTNR chromatograms of the y8 ions (Table S1) from the Stx1 and Stx2 analyte decapeptides shown in (Stx1e). The samples are derived from the TSB broth of a Stx1a producing Escherichia coli or the LB (Stx1a) or ELYTTR (Stx1e). The samples are derived from the TSB broth of Stx1a Figure 3. The chromatograms from either the y3 or y4 ions (Table S1) from the IEFSK,a VEYTK, broth producing from a Stx1e producing cloacaefrom strainStx1e and analyzed by mass spectrometry. The Escherichia coliEnterobacter ororthe LB broth producing ELFTNR, EYWTSR, EYWTNR, ELYTTR peptides aare shown in FigureEnterobacter S5. When we cloacae previously signal strain from the natural abundance peptide (i) is from the toxin and is not normalized. The signal from analyzed byand mass spectrometry. from the natural abundance peptide examinedand hamster, sheep mouse plasma, weThe sawsignal no interference from molecules present in (i) these the corresponding 15 N-labeled peptide is from the added internal standard (ii) and15is normalized to is from the toxin and is not normalized. The signal from the corresponding N-labeled matrices [35]. It was determined that there were no molecules present in the serum sample that would an intensity of 500 to allow the signal from the peptide to be viewed on the same plot. peptide is the from the added internal standard (ii) and is normalized to an intensity of 500 to interfere with analysis.
allow the signal from the peptide on the same plot. 600 to be viewed 600 600 i
i
i
2.7. Assessing the Background in Human Serum 300
300
300
MRM Intensity
The trypsin digestion of human serum will produce a large number of diverse tryptic peptides, so it is possible that some of those molecules may interfere with our analysis. Samples of human serum ii
0
10 15 YNDDDTFTVK 600
ii
0
10 15 YNDDDSFTVK
600
920
i
i
300
460
ii
0
10 15 YNDDDTFTAK 860
i
i
300
ii
0 10 15 YNEDDTFTVK
ii
0 10 15 YNENDTFTVK
430
ii
0
10 15 YNGDNTFTVK
ii
0
10 15 YNEDNTFTVK
Retention time (min.)
Figure 3.Figure Chromatograms of theofMRM signal intensities derived from the analyte 3. Chromatograms the MRM signal intensities derived fromthe theyy88 ions ions of the analyte decapeptides from tryptic digestsserum of human serumno showing matrix interference decapeptides from tryptic digests of human showing matrixno interference with the y8 ion with the y8 ion of the analyte fromsubtypes. Stx1 and Stx2 signals corresponding of the analyte decapeptides from decapeptides Stx1 and Stx2 Thesubtypes. signalsThe corresponding to the y8 ion of to the y8 ion of thefrom analyte decapeptides from Stx1YNDDDSFTVK, (YNDDDTFTVK, or or Stx2a the analyte decapeptides Stx1 (YNDDDTFTVK, orYNDDDSFTVK, YNDDDTFTAK); Stx2a and orStx2f Stx2c, or Stx2d, or Stx2e and Stx2fYNDDDTFTAK); (YNEDDTFTVK);orStx2b, Stx2c, Stx2d,(YNEDDTFTVK); (YNENDTFTVK);Stx2b, Stx2g (YNGDDTFTVK) (YNENDTFTVK); Stx2g or Stx2e (YNEDNTFTVK) shown each (YNEDNTFTVK) are shown in (YNGDDTFTVK) each graph (i). Each sample was spiked are with the incorresponding 15 15 N-labeled 15 N-labeled graph (i). Eachstandard sample was the for corresponding standard (ii). internal (ii).spiked The with signals the y8 ions N-labeled from the internal corresponding 15 The signals(ii) forare thenormalized y8 ions fromtothe corresponding N-labeled internal standards (ii) are internal standards 500 to allow the signal from the analyte decapeptide to be normalized 500 to allow thesignals signal from the normalized. analyte decapeptide to be viewed on the same viewed on the sametoplot. The other are not plot. The other signals are not normalized.
2.7. Assessing the Background in Human Serum
2.8. Determining a LOD for Relevant Stx1 Peptides in Buffer and Serum
The trypsin digestion of human serum will produce a large number of diverse tryptic peptides, After we established the peptides present in interfere trypsin digested serum do Samples not interfere so it is possible that some ofthat those molecules may with human our analysis. of human with our analysis, we determined the limit of detection (LOD) of the Stx1 peptides in buffer and serum were digested with trypsin and then spiked with the trypsin digested 15 N-Stx-ISP. These spiked samples were then analyzed by mass spectrometry. The resulting chromatograms were examined to determine if there was a molecule present in the trypsin digested human serum that would interfere with this analysis. None of these chromatograms showed a signal with the same precursor/product ion and the same chromatographic retention time as the corresponding 15 N-labeled internal standard.
5241
Toxins 2015, 7, 5236–5253
These chromatograms of the y8 ions (Table S1) from the Stx1 and Stx2 analyte decapeptides are shown in Figure 3. The chromatograms from either the y3 or y4 ions (Table S1) from the IEFSK, VEYTK, ELFTNR, EYWTSR, EYWTNR, or ELYTTR peptides are shown in Figure S5. When we previously examined hamster, sheep and mouse plasma, we saw no interference from molecules present in these matrices [35]. It was determined that there were no molecules present in the serum sample that would interfere with the analysis. 2.8. Determining a LOD for Relevant Stx1 Peptides in Buffer and Serum After we established that the peptides present in trypsin digested human serum do not interfere with our analysis, we determined the limit of detection (LOD) of the Stx1 peptides in buffer and2015, human serum. The LOD values represent signals that were at least 3ˆ Toxins 7 9 greater than the noise. Known concentrations of the relevant commercially synthesized Stx1 peptides (YNDDDTFTVK, YNDDDSFTVK, YNDDDTFTAK, and diluted into buffer human serum. The LOD values represent signals thatELFTNR, were at least 3× ELYTTR) greater thanwere the noise. Known the relevant commercially Stx1 peptides (YNDDDTFTVK, YNDDDSFTVK, (25 mMconcentrations ammoniumof bicarbonate, pH 8.0; synthesized 0.01% β-octylglucopyranoside; and 8% acetonitrile) or 15 N-labeled ELFTNR, ELYTTR) diluted into buffer (25 mM ammonium pH samples trypsin YNDDDTFTAK, digested human serumand along withwere the analogous peptides.bicarbonate, After these 8.0; 0.01%by β-octylglucopyranoside; andwe 8%determined acetonitrile) orthat trypsin serum along were analyzed mass spectrometry thedigested limit human of detection for with the analyte 15 the analogous N-labeled peptides. After these samples were analyzed by mass spectrometry we serum decapeptides was less than 50 attomoles/injection in buffer and in trypsinized human determined that the limit of detection for the analyte decapeptides was less than 50 attomoles/injection (Figures 4 and 5). The LOD for the ELFTNR and ELYTTR peptides was noticeably lower than in buffer and in trypsinized humanbuffer serum (Figures 4 and 5).The The LOD for the ELFTNR the analyte decapeptides in both and serum. chromatograms of and theELYTTR y8 ions of the peptides was noticeably lower than the analyte decapeptides in both buffer and serum. The chromatograms analyte decapeptides and the y4 ions of the ELFTNR and ELYTTR peptides (Table S1) are shown of the y8 ions of the analyte decapeptides and the y4 ions of the ELFTNR and ELYTTR peptides (Table S1) in Figures 4 and 5. Shiga-like toxins have five B subunits per toxin molecule, so a LOD of less are shown in Figures 4 and 5. Shiga-like toxins have five B subunits per toxin molecule, so a LOD of than 50 attomoles/injection for a peptide corresponds to a LOD for the toxin of less than 10 less than 50 attomoles/injection for a peptide corresponds to a LOD for the toxin of less than attomoles/injection. A three-fold loss occurs when a toxin is digested with trypsin (vide infra). Since 10 attomoles/injection. A three-fold loss occurs when a toxin is digested with trypsin (vide infra). Since each injection consists of six microliters and the molecular weight of Shiga toxins is about 70,000, the each injection consists of six microliters and the molecular weight of Shiga toxins is about 70,000, the LOD ofLOD the toxin corresponds to to approximately 40pg/mL, pg/mL, when thedue loss to digestion of the toxin corresponds approximately 40 when the loss to due digestion in serum isin serum is takentaken into into account. account. 2700
1320
1350
660
MRMIntensity
i i ii
0 9
ELFTNR
ii
0
14
9
580
ELYTTR
14
640
660
i i
290
0
320
ii
9 14 YNDDDTFTVK
i
330
ii
0
9 14 YNDDDSFTVK
ii
0
9 14 YNDDDTFTAK
Retention time (min.) 4. Signal intensity a 50-attomole injection eachofofthe thethree three synthetic synthetic Stx1 Figure 4.Figure Signal intensity of a of 50-attomole injection of of each Stx1 analyte analyte(YNDDDTFTVK, decapeptides (YNDDDTFTVK, YNDDDSFTVK, and YNDDDTFTAK), the ELFTNR, decapeptides YNDDDSFTVK, and YNDDDTFTAK), the ELFTNR, or the ELYTTR ELYTTR in buffer (8%BOG, acetonitrile, 0.01% 25 mM ABCshow pH 8).the Graphs peptidesorinthe buffer (8% peptides acetonitrile, 0.01% 25 mM ABCBOG, pH 8). Graphs MRM signal the MRM derived fromdecapeptides the y8 ion of the or the y4 peptides intensityshow derived from signal the y8intensity ion of the analyte oranalyte the y4 decapeptides ions from the other ions from the other peptidesThe fromcorresponding a (i) 50-attomole15injection. The corresponding from a (i) 50-attomole injection. N-labeled analog peptides15N-labeled are normalized to peptides are(ii) normalized a signal of 500 (ii) todecapeptide allow the signal from the on the a signal analog intensity of 500 to allowtothe signalintensity from the analyte to be viewed analyte decapeptide to be viewed on the same plot. same plot.
5242
2015, 7, 5236–5253 ToxinsToxins 2015, 7
10 4500
2800
2250
1400
MRM Intensity
i
i ii
ii iii
0 9 780
ELFTNR
iii
0
14
9
ELYTTR
14
1040
840
i i
i ii
520
iii
iii
390
0
ii ii 420
9 14 YNDDDTFTVK
0
9 14 YNDDDSFTVK
iii
0
9 14 YNDDDTFTAK
Retention time (min.) Figure 5. Signal intensity of a 50- or 100-attomole injection of each of the three synthetic Stx1 analyte
Figure 5. Signal intensity of a 50- or 100-attomole injection of each of the three synthetic decapeptides (YNDDDTFTVK, YNDDDSFTVK, and YNDDDTFTAK), the ELFTNR or the ELYTTR Stx1peptides analytein human decapeptides (YNDDDTFTVK, YNDDDSFTVK, serum. Graphs show the MRM signal intensity derivedand from YNDDDTFTAK), the y8 ion of the analyte decapeptides or the y ions for the other peptides from a (i) 50or (ii) 100-attomole injection. 4 the ELFTNR or the ELYTTR peptides in human serum. Graphs show the MRM signal The corresponding 15 N-labeled analog peptides are normalized to a signal intensity of 500 (ii) to allow intensity derived from the y8 ion of the analyte decapeptides or the y4 ions for the other the signal from the analyte decapeptide to be viewed on the same plot. peptides from a (i) 50- or (ii) 100-attomole injection. The corresponding 15N-labeled analog peptides aresamples normalized to a signal intensity 500toxins (ii) totoallow the signal from the analyte Serum were filtered and then spikedofwith determine if the interfering protein or proteins could be removed by filtration. Serum samples were either filtered through a 300,000 Da decapeptide to be viewed on the same plot. (300 K) or 100,000 Da (100 K) molecular weight cutoff (MWCO) filter or unfiltered before being spiked with samples Stx1a or Stx2a. Subsequent showedifthat was readily Serum were filtered and mass then spectrometry-based spiked with toxinsanalysis to determine the Stx1a interfering protein or detectable in all of the samples, whether filtered or unfiltered. There was a notable loss when the proteins could be removed by filtration. Serum samples were either filtered through a 300,000 Da Stx1a was spiked into serum and then filtered. In contrast, Stx2a was readily detectable only in the (300 K) or 100,000 molecular filter orthat unfiltered before being serum samples Da that(100 wereK) filtered prior toweight spikingcutoff (Table(MWCO) 2). This indicates the serum matrix effectspiked is due to binding of Stx1 or Stx2 a large molecule, which then prevents thethat tryptic digestion with Stx1a orthe Stx2a. Subsequent massto spectrometry-based analysis showed Stx1a was of readily the intact toxin, and that this effect is more pronounced with Stx2a. detectable in all of the samples, whether filtered or unfiltered. There was a notable loss when the Stx1a
was spiked into serum and then filtered. In contrast, Stx2a was readily detectable only in the serum samples that were filtered prior to spiking (Table 2). This indicates that the serum matrix effect is due to the binding of Stx1 or Stx2 to a large molecule, which then prevents the tryptic digestion of the intact toxin, and that this effect is more pronounced with Stx2a. Guanidinium chloride (GuCl; 6 M) was used to disrupt the interaction between the molecule or molecules (presumably HuSAP) and Stx2. Human serum samples were spiked with varying amounts of Stx1a, Stx2a, Stx2c or Stx2g. The samples were dissolved in GuCl where they were reduced/alkylated and then methanol precipitated. The resulting pellet was5243 digested with trypsin and then analyzed by mass
to the amount of toxin detected in the broth spike in serum was calculated for four GuCl treated samples: Stx1a (0.3 ± 0.1; n = 4), Stx2a (0.3 ± 0.04; n = 4), Stx2c (0.8 ± 0.2; n = 4), and Stx2g (0.7 ± 0.06; n = 4). This procedure substantially improved the sensitivity of detection of Stx2a, Stx2c, and Stx2g samples. However, approximately 20%–70% of the Stx toxin in the sample is lost during this process. Since the Toxins 2015, 7, 5236–5253 samples can be concentrated, it is possible that this loss may be overcome by using a larger sample. 8100
2100
2600
4050
1050
1300
MRM Intensity
i i
0
ii
10
A
15
10
25600
1340
12800
670
i ii
0 10
A
15
ii
0
B
i
ii
0 10
15
C
Stx1a
15
15700
7850
i
ii
0 10
B
15
i ii
0 10
C
Stx2a
15
Retention time (min.) Figure 6. The intensity of the MRM signals derived from the y ion of the analyte decapeptide of Stx1a
Figure 6. The intensity of the MRM signals derived from8 the y8 ion of the analyte decapeptide or Stx2a (i) in sterile filtered bacterial medium (A); human serum (B); and human serum denatured of Stx1a or Stx2a (i)chloride in sterile filtered bacterial15 N-labeled medium internal (A); human serum (B); and human with guanidinium (C). The corresponding standard is normalized to 500 15 The amount of (ii) to allow the signal the analyte chloride decapeptide to be viewed on the same plot. serum denatured with from guanidinium (C). The corresponding N-labeled internal Stx1a in each injection (n = 2) was calculated to be (left (l) to right (r)) 5.8 ˘ 0.4 fmol, 3 ˘ 1 fmol, and standard is normalized to 500 (ii) to allow the signal from the analyte decapeptide to be 1.7 ˘ 0.8 fmol, respectively. The amount of Stx2a in each injection (n = 2) was calculated to be (l to r) viewed The amount in each injection (n = 2) was calculated to be 29 ˘on 0.4 the fmol,same 0.08 ˘plot. 0.05 fmol, and 10 ˘ of 0.6 Stx1a fmol, respectively. (leftGuanidinium (l) to right (r)) 5.8 ± 0.4 fmol, 3 ±was 1 fmol, 1.7 ± 0.8 respectively. amount chloride (GuCl; 6 M) used and to disrupt the fmol, interaction between The the molecule or HuSAP) serumtosamples of molecules Stx2a in(presumably each injection (n and = 2)Stx2. wasHuman calculated be (l were to r)spiked 29 ±with 0.4varying fmol, amounts of Stx1a, Stx2a, Stx2c or Stx2g. The samples were dissolved in GuCl where they were 0.08 ± 0.05 fmol, and 10 ± 0.6 fmol, respectively.
reduced/alkylated and then methanol precipitated. The resulting pellet was digested with trypsin and then analyzed by mass spectrometry. Using GuCl to disrupt the interaction allows us to detect previously inaccessible amounts of Stx2 in human serum (Figures 6 and 7). The ratio of the amount of toxin detected in the broth spike to the amount of toxin detected in the broth spike in serum was calculated for four GuCl treated samples: Stx1a (0.3 ˘ 0.1; n = 4), Stx2a (0.3 ˘ 0.04; n = 4), Stx2c (0.8 ˘ 0.2; n = 4), and Stx2g (0.7 ˘ 0.06; n = 4). This procedure substantially improved the sensitivity of detection of Stx2a, Stx2c, and Stx2g samples. However, approximately 20%–70% of the Stx toxin in the sample is lost during this process. Since the samples can be concentrated, it is possible that this loss may be overcome by using a larger sample.
5244
Toxins 2015, 7, 5236–5253
Toxins 2015, 7
12 5400
860
6460
i
MRM Intensity
2700
430
3230
i
i ii
0 10
A
15
2900
ii
0 10
B
ii
0
15
10
C
Stx2c
15
3500
880
i
1450
1750
440
i ii
0 10
A
15
i ii
0 10
B
15
ii
0 10
C
Stx2g
15
Retention time (min.) Figure 7. The intensity of the MRM signals derived from the y ion of the analyte decapeptide of Stx2c
Figure 7. The intensity of the MRM signals derived from8 the y8 ion of the analyte decapeptide or Stx2g (i) in sterile filtered bacterial medium (A); human serum (B); and human serum denatured of Stx2c or Stx2g (i)chloride in sterile filtered bacterial15 N-labeled medium internal (A); human serum (B); and human with guanidinium (C). The corresponding standard is normalized to 500 15 (ii) to allow the signal the analytechloride decapeptide to be viewed on the same plot. The amount of serum denatured with from guanidinium (C). The corresponding N-labeled internal Stx2c in each injection (n = 2) was calculated to be (left (l) to right (r)) 34 ˘ 3 fmol, 0.02 ˘ 0.01 fmol, and standard is normalized to 500 (ii) to allow the signal from the analyte decapeptide to be 28 ˘ 7 fmol, respectively. The corresponding amount of Stx2g in each injection (n = 2) was calculated viewed the same plot. amount of3Stx2c in each injection (n = 2) was calculated to be to beon (l to r) 4.1 ˘ 0.3 fmol,The 0.99). 3.4. Quantifying Shiga-Like Toxins in Bacterial Media Clinical isolates of STEC producing Stx1a, Stx1e, Stx2a, Stx2c, Stx2e, or Stx2g were grown in LB or TSB and induced to produce Shiga-like toxin by the addition of the antibiotic mitomycin C [42]. An aliquot of the filter sterilized supernatants from each of these samples was digested with trypsin and a fixed amount of the appropriate trypsin digested 15 N-labled internal standard was added. The six samples were analyzed by mass spectrometry and the area ratio of the signal from the y8 ion of the analyte to the corresponding 15 N-labeled decapeptide was calculated. The previously described calibration curves were used to quantify the amount of toxin present in the ten previously described samples. These data are listed in the legends of Figures 1 and 2. We were able to detect and quantify all of the Stx2 toxin subtypes in the attomole range (20 (Stx1e) to 960 (Stx2g) attomoles)) (Figure 1). We were also able to detect Stx1 at similarly low levels (Figure 2). In all cases, we were able to detect and quantify toxins in the attomole range. 3.5. Quantifying Shiga Like Toxins in Human Serum Bacterial medium containing Stx2a or Stx1a was spiked into human serum and analyzed by mass spectrometry. We were able to detect and quantify the amount of Stx1a and Stx2a in the samples. A component of the serum (presumably HuSAP) significantly impeded the trypsin digestion of Stx2a. This could be overcome by using GuCl to denature the proteins in the sample and prevent their refolding by reducing and alkylating them. Methanol precipitation removed the GuCl and trypsin digestion released the analyte decapeptides. This approach allows a sample to be concentrated prior to analysis, which permits a larger volume sample to be analyzed with a resulting increase in sensitivity. In addition, the use of filtration to retain the Stx2/HuSAP complex for subsequent analysis using GuCl may further increase the sensitivity of this method. 4. Experimental Procedures 4.1. Generation of Shiga-Like Toxin Samples The strains of Shiga-like toxin producers used in this study have been previously described [35]. For each strain, a single colony was used to inoculate a 20 mL culture of tryptic soy broth or Luria Broth (TSB or LB; Fisher Scientific, Pittsburgh, PA, USA) and grown overnight at (37 ˝ C and 250 rpm). The next day 10 mL of the overnight culture was used to inoculate 500 mL of TSB or LB supplemented with 50 ng/mL of mitomycin C (Sigma-Aldrich, Milwaukee, WI, USA) and grown for 24 h (37 ˝ C, 250 rpm). For the Stx2 producing strains, the resulting culture was centrifuged for 15 min at 5000ˆ g. For the Stx1 producing strains the culture was diluted 1:1 with Phosphate B-PER (Thermo Scientific, Waltham, MA, USA) and then centrifuged for 15 min at 5000ˆ g. The resulting supernatants were sterile filtered and used for mass spectrometry-based analysis (vide infra) [43]. 4.2. Preparation of Serum Samples The human serum samples were obtained from an FDA licensed commercial donor center and processed in an FDA registered facility (Innovative Research, Inc., Novi, MI, USA). They were reduced/alkylated/trypsin cleaved (vide infra). Human serum samples were processed through 100,000 Da or 300,000 Da MWCO centrifugal filters before reduction/alkylation/trypsin digestion. One hundred microliters of serum was placed in the filter and centrifuged for 20 min at 14,000ˆ g. Ten microliters of serum filtrate was spiked with 10 µL of sterile-filtered, toxin-containing supernatant in broth, then reduced/alkylated/trypsin digested and processed for mass spectrometry-based analysis. Alternately, 50 µL of serum was 5247
Toxins 2015, 7, 5236–5253
combined with 50 µL of toxin-containing supernatant, and then filtered through 100,000 Da or 300,000 Da MWCO filters for 20 min at 14,000ˆ g. Twenty microliters of the filtrate was then reduced/alkylated/trypsin digested and subsequently analyzed by mass spectrometry. Filtrates were stored at ´20 ˝ C until analysis. Forty microliters of toxin-containing supernatant, alone or with 10 µL of serum, was diluted with 150 µL of 8 M guanidinium chloride and mixed. Samples were reduced (adding 5 µL 1 M DTT; 30 min; 37 ˝ C) and alkylated (37 µL of a 500 mM iodoacetamide; 30 min; room temperature in the dark), followed by quenching with DTT (adding 6 µL 1 M DTT; room temperature). These samples were methanol precipitated by the addition of ice-cold methanol to give a final concentration of 85% methanol and allowed to precipitate for 1 h at ´20 ˝ C. Samples were centrifuged (10 min; 20,000ˆ g; 0 ˝ C). The methanol supernatant was removed and the pellets were washed with methanol and centrifuged (10 min; 20,000ˆ g; 0 ˝ C). The methanol supernatant was removed and pellets were air dried briefly and then brought up in 90 µL of buffer A (25 mM ammonium bicarbonate pH 8.0, 8% acetonitrile, 0.01% β-octylglucopyranoside). Ten microliters of a trypsin solution (20 µg/mL) was added to each sample and they were incubated for 2 h at 37 ˝ C. Samples were then processed for mass spectrometry-based analysis. Filtrates were stored at ´20 ˝ C until analysis. 4.3. Reduction, Alkylation, and Tryptic Cleavage of Shiga-Like Toxins The sample preparation has been described previously [35]. The samples consisted of one of the following: 20 µL of sterile filtered bacterial supernatant, or 10 µL of serum plus 10 µL of undiluted or diluted bacterial supernatant. The reduction/alkylation/trypsin cleavage has been described previously [35]. All solutions were freshly prepared prior to use. Ten microliters of 15 mM dithiothreitol (DTT) in buffer A (25 mM ammonium bicarbonate, pH 8.0; 0.01% β-octylglucopyranoside; and 8% acetonitrile) was added to the sample solution and incubated for 0.5 or 1 h at 37 ˝ C and then cooled to room temperature. Forty microliters of 22 mM iodoacetamide (IA) solution in buffer A was added to the DTT solution and allowed to stand in the dark at room temperature for 0.5 or 1 h. Addition of 20 µL of a 22 mM solution of DTT in buffer A quenched the excess IA. The reduced and alkylated proteins were digested with trypsin solution (10 µL of a solution containing 100 µg of trypsin/mL of water) at 37 ˝ C for either 2 or 16 h. After digestion, the samples were filtered through a 10,000 Da MWCO filter (12 min; 14,000ˆ g) followed by a 3000 Da MWCO filter (20 min; 14,000ˆ g) and stored at ´20 ˝ C for eventual analysis. 4.4. Mass Spectrometry The instrument response was optimized by a previously described method [44]. The qualitative mass spectrometry was performed using a Thermo Scientific (Thermo Fisher Scientific, Waltham, MA, USA) model Orbitrap Elite instrument equipped with a nanoelectrospray source. A 4000 Q-Trap (Sciex, Dublin, CA, USA) mass spectrometer equipped with a nanoelectrospray source was used for quantification. This mass spectrometer was operated in multiple reaction monitoring (MRM) mode, alternating between detection of the nine peptides and the corresponding 15 N-labeled internal standards. The mass settings for the peptides are summarized in Table S1. The retention times of the peptides are listed in Table S2. Quantification was done with the IntelliQuan quantification algorithm using Analyst 1.5 software (Sciex, Dublin, CA, USA). 4.5. Nanospray LC-MS/MS A 4000 Q-Trap mass spectrometer (Sciex, Dublin, CA, USA) equipped with a nanoelectrospray source was used to perform nanospray liquid chromatography and tandem mass spectroscopy (LC-MS/MS). An aliquot (6 µL) of each digest was loaded onto a C-18 trap cartridge (Acclaim PepMap100, 5 µm, 100 Å, 300 µm (inside diameter) ˆ 5 mm (Dionex, Sunnyvale, CA, USA)). Salts were washed from the cartridge with an acetic acid/acetonitrile/heptafluorobutyric acid/water solution (0.5/1/0.02/99). The now salt-free bound peptides were eluted onto a reversed-phase 5248
Toxins 2015, 7, 5236–5253
column (Vydac (Hesperia, CA, USA) 238EV5.07515, 75 µm ˆ 150 mm). The solvents were delivered with a Tempo nanoflow LC system (Dionex, Dublin, CA, USA) with an autosampler, a column switching device, and a nanoflow solvent delivery system. Samples were eluted from the column with a binary gradient (A, 0.5% acetic acid in water, and B, 80% acetonitrile with 0.5% acetic acid). The flow rate was 250 nL/min with a 16 min linear gradient starting with 5% B and ending with 100% B. Elution with 100% B was conducted for 7 min followed by a return to 5% B over 4 min. The eluted samples were sprayed with a non-coated spray tip (FS360-20-10-N-20-C12, New Objective Inc., Woburn, MA, USA) onto the Nanospray II source (Sciex, Dublin, CA, USA). 4.6. Preparation of the Gene Containing the Internal Standards [45] A gene was designed to yield a protein that would liberate the peptides used in this manuscript upon digestion with trypsin (YNDDDTFTVK, YNDDDSFTVK, YNDDDTFTAK, YNGDNTFTVK, YNEDNTFTVK, YNENDTFTVK, YNEDDTFTVK, ELFTNR, EYWTNR, ELYTTR, VEYTK, and IEFSK) and others. The codons for the amino acids were changed from the native sequence to minimize repeat regions and to maintain a G/C and A/T content that was consistent with the E. coli host that would overexpress the desired protein. The gene was prepared by Biomatik (Wilmington, DE, USA) and subsequently was excised from the pBlueScript II SK(+) (kan) plasmid and cloned into a pET 15b vector (BLA selection) to yield a construct with an N-terminal His tag to facilitate purification. The gene composition was verified by sequencing. The pET15b plasmid was cloned into BL21 cells for overexpression of the encoded protein. The gene sequence is as follows: ‚ ATGGGCAGCAGCCATCATCATCATCATCACAGCAGCGGCCTGGTGCCGCGCGGCAGCCAT ATGAGAGCGGATTGTGCCAAGTACAATGACGACGACACCTTTACTGTCAAGATCAAGTAT AACGGCGATAATACCTTTACTGTCAAGGCGGACTGTGCCGTCGGCAAGACTCCTGATTGT GTCACTGGTAAGTATAACGATGATGACTCCTTCACCGTGAAGTATAACGAGGATAATACG TTCACCGTTAAGGCCCGTGAGTTGTTTACCAACCGCTACAATGACGACGATACCTTTACTG CGAAGGGCCGCGAGTACTGGACCTCTCGCTATAACGAGAACGATACGTTCACAGTTAAGG CCCGCGAGTACTGGACCAACCGCTACAATGAGGACGATACCTTCACGGTCAAGTCCCGCG AATTATATACTACCCGCGTGGAGTATACTAAGATTGAGTTTTCCAAGAATGGCGAGGGCT TCTCAGAGGTGATTTTTCGCACTAACGCCTGCCACAATGGCGGTGGCTTTAGCGAGGTTAT CTTTAGGACTACGGCCTGTCATAACGGAGGCGGTTTCTCTGAGGTCATTTTCCGTTCCTCG ACCTGTGAGTCCGGCTCCGGCTTTGCTGAGGTGCAGTTTAACAACGACTAGTGACTCGAG 4.7. Peptides, Internal Standards, Purified Proteins, and Calibration Curves The natural abundance (14 N) peptides YNDDDTFTVK, YNDDDSFTVK, YNDDDTFTAK, ELFTNR, and ELYTTR were obtained from Elim Biopharmaceuticals (Hayward, CA, USA) or Peptide 2.0 (Chantilly, VA, USA). The structures (Figure S6) were confirmed by mass spectrometry and each was >95% pure. The concentration of the peptide was calculated by using the observed absorbance and the calculated extinction coefficient (ExPASy; [39]) or the manufacturer’s specifications. A solution of 500 or 1000 picomoles/microliter in acetonitrile/water (1:1) buffer was prepared for each peptide. Dilutions of these solutions combined with a fixed aliquot of the trypsin digest of the Stx 15 N-labeled internal standard protein (15 N-Stx-ISP) were used to prepare the calibration curves. The 15 N-labeled internal standard-containing protein was prepared by growing the clone in minimal medium supplemented with 15 NH4 Cl (99.7% 15 N; Cambridge Isotope, Andover, MA, USA) and purified using standard molecular biology techniques [35]. The purity of the 15 N-labeled internal standard protein was greater than 90% by Coomassie stained SDS-PAGE gel.
5249
Toxins 2015, 7, 5236–5253
Toxins 2015, 7
18
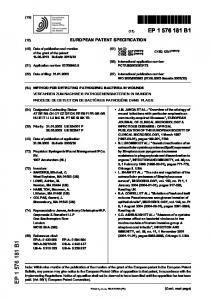
5. Conclusions 5. Conclusions
WeWe have developed method detecting in bacterial have developeda amass mass spectrometry-based spectrometry-based method of of detecting Stx1Stx1 and and Stx2Stx2 in bacterial 15 (15 N-Stx-ISP) to mediamedia and and human serum. We used a synthetic gene to produce a single protein human serum. We used a synthetic gene to produce a single protein ( N-Stx-ISP) to 15 conveniently andand cheaply generate internalstandards. standards. As new Stx variants conveniently cheaply generatethe theneeded needed 15N-labeled N-labeled internal As new Stx variants emerge they can be added to the gene. This method can be used to distinguish among the known emerge they can be added to the gene. This method can be used to distinguish among the known Stx2 Stx2 and Stx1 subtypes in complex media. When chaotropes are employed, it can be used to and Stx1 subtypes in complex media. When chaotropes are employed, it can be used to detect both Stx1detect both and Stx1Stx2 andinStx2 in human serum. limit of in detection serum is approximately fmol/mL. human serum. The limit The of detection serum is in approximately 5 fmol/mL. The5 entire The entire procedure can be accomplished in approximately 5 h (Figure 8). procedure can be accomplished in approximately 5 h (Figure 8).
MRM Intensity
3500
1. Serum sample + GuCl 2. DTT 37 ºC (30 min.) 3. IA RT (30 min.) 4. 5. 6. 7.
MeOH precipitation (1hr) Trypsin 37 ºC (2 hr) Filtration + IS (30 min.) nanoLC-ESI (45 min.)
1750
0
MS1
Collision cell
MS2
Detector
10
15
Time (min)
Signal
Triple quadrupole mass spectrometer
FigureFigure 8. Scheme showing the process of analyzing a humana serum massby spectrometry. 8. Scheme showing the process of analyzing human sample serum by sample mass The serum sample is diluted with the chaotrope guanidinium chloride (GuCl; 6 M) and the sample is spectrometry. The serum sample is diluted with the chaotrope guanidinium chloride then reduced/alkylated with dithiothreitol (DTT) and iodoacetamide (IA), respectively. The sample (GuCl; 6 M) and the sample is then reduced/alkylated with dithiothreitol (DTT) and is methanol precipitated and then brought up in 90 microliters of buffer (8% acetonitrile, 0.01% iodoacetamide (IA), respectively. The sample is methanol precipitated and then brought up BOG, 25 mM ABC pH 8) and then digested with trypsin. The trypsin digest is filtered sequentially in 90 microliters of buffer (8% acetonitrile, 0.01% BOG, 25 mM ABC pH 8) and then through a 10,000 and a 5000 Da MWCO filter. The internal standard (IS) is added and the sample digested with trypsin. The trypsin digest is filtered sequentially through a 10,000 and a is run on the instrument. The appropriate 15 N-labeled internal standard is used to identify the peak 5000 Da MWCO filter. The internal standard (IS) is added and the sample is run on the corresponding to analogous unlabeled peptide based on their identical physico-chemical properties 15 instrument. The appropriate internal standard is ratio used oftothe identify the peak (chromatographic retention time andN-labeled MS fragmentation). The area unlabeled peptide to corresponding to analogous unlabeled peptide based on their identical physico-chemical that of the added internal standard may be calculated and used to quantitate the amount of Stx present (chromatographic time and MSsample fragmentation). TheStx2g. area ratio of the in the properties sample. The signal shown is retention from a human serum spiked with
unlabeled peptide to that of the added internal standard may be calculated and used to quantitate the amount of Stx present in the sample. signal shown is from a human serum Supplementary Materials: The following are available onlineThe at www.mdpi.com/2072-6651/7/12/4875/s1. sample spiked with Stx2g. Acknowledgments: We wish to acknowledge Robert Mandrell, Anna Bates, and Michael Cooley for kindly providing samples. We also wish to acknowledge Bradley Hernlem and J. Mark Carter for their careful reading Supplementary Materials: The following are available online at www.mdpi.com/2072of the manuscript and helpful comments.
6651/7/12/4875/s1. Author Contributions: C.J.S. conceived and designed the experiments; C.B.S., S.A.P., and X.H. generated, isolated and/or purified the Shiga toxins; and M.L.E.-B. digested the samples and performed the MS/MS Acknowledgments analyses. All authors analyzed data and were involved in preparing the manuscript. C.J.S. wrote the paper. Conflicts of Interest: The authors declare no conflict of interest.
We wish to acknowledge Robert Mandrell, Anna Bates, and Michael Cooley for kindly providing samples. References We also wish to acknowledge Bradley Hernlem and J. Mark Carter for their careful reading of the manuscript and helpful comments. 1.
2. 3. 4.
5.
Tyler, J.S.; Livny, J.; Friedman, D.I. Lambdoid phages and Shiga toxin. In Phages: Their Role in Pathogenesis and Biotechnology; Waldor, M.K., Friedman, D.I., Adhya, S.L., Eds.; ASM Press: Washington, DC, USA, 2005; pp. 131–164. Friedman, D.I.; Court, D.L. Bacteriophage lambda: Alive and well and still doing its thing. Curr. Opin. Microbiol. 2001, 4, 201–207. [CrossRef] Cantey, J.R. Shiga toxin—An expanding role in the pathogenesis of infectious diseases. J. Infect. Dis. 1985, 151, 766–771. [CrossRef] [PubMed] Eaton, K.A.; Friedman, D.I.; Francis, G.J.; Tyler, J.S.; Young, V.B.; Haeger, J.; Abu-Ali, G.; Whittam, T.S. Pathogenesis of renal disease due to enterohemorrhagic Escherichia coli in germ-free mice. Infect. Immun. 2008, 76, 3054–3063. [CrossRef] [PubMed] Tarr, P.I.; Gordon, C.A.; Chandler, W.L. Shiga-toxin-producing Escherichia coli and haemolytic uraemic syndrome. Lancet 2005, 365, 1073–1086. [CrossRef]
5250
Toxins 2015, 7, 5236–5253
6.
7. 8.
9.
10. 11.
12. 13. 14.
15. 16. 17.
18.
19.
20.
21. 22. 23. 24.
25.
O’Brien, A.D.; Tesh, V.L.; Donohue-Rolfe, A.; Jackson, M.P.; Olsnes, S.; Sandvig, K.; Lindberg, A.A.; Keusch, G.T. Shiga toxin: Biochemistry, genetics, mode of action, and role in pathogenesis. Curr. Top. Microbiol. Immunol. 1992, 180, 65–94. [PubMed] Fuller, C.A.; Pellino, C.A.; Flagler, M.J.; Strasser, J.E.; Weiss, A.A. Shiga toxin subtypes display dramatic differences in potency. Infect. Immun. 2011, 79, 1329–1337. [CrossRef] [PubMed] Lindgren, S.W.; Samuel, J.E.; Schmitt, C.K.; O’Brien, A.D. The specific activities of Shiga-like toxin type ii (SLT-II) and SLT-II-related toxins of enterohemorrhagic Escherichia coli differ when measured by Vero cell cytotoxicity but not by mouse lethality. Infect. Immun. 1994, 62, 623–631. [PubMed] Tesh, V.L.; Burris, J.A.; Owens, J.W.; Gordon, V.M.; Wadolkowski, E.A.; O’Brien, A.D.; Samuel, J.E. Comparison of the relative toxicities of Shiga-like toxins type I and type II for mice. Infect. Immun. 1993, 61, 3392–3402. [PubMed] Smith, D.L.; Rooks, D.J.; Fogg, P.C.; Darby, A.C.; Thomson, N.R.; McCarthy, A.J.; Allison, H.E. Comparative genomics of Shiga toxin encoding bacteriophages. BMC genomics 2012, 13, 311. [CrossRef] [PubMed] James, C.E.; Stanley, K.N.; Allison, H.E.; Flint, H.J.; Stewart, C.S.; Sharp, R.J.; Saunders, J.R.; McCarthy, A.J. Lytic and lysogenic infection of diverse Escherichia coli and Shigella strains with a verocytotoxigenic bacteriophage. Appl. Environ. Microbiol. 2001, 67, 4335–4337. [CrossRef] [PubMed] Paton, A.W.; Paton, J.C. Enterobacter cloacae producing a Shiga-like toxin II-related cytotoxin associated with a case of hemolytic-uremic syndrome. J. Clin. Microbiol. 1996, 34, 463–465. [PubMed] Schmidt, H.; Montag, M.; Bockemuhl, J.; Heesemann, J.; Karch, H. Shiga-like toxin II-related cytotoxins in Citrobacter freundii strains from humans and beef samples. Infect. Immun. 1993, 61, 534–543. [PubMed] Probert, W.S.; McQuaid, C.; Schrader, K. Isolation and identification of an Enterobacter cloacae strain producing a novel subtype of Shiga toxin type 1. J. Clin. Microbiol. 2014, 52, 2346–2351. [CrossRef] [PubMed] Paton, J.C.; Paton, A.W. Instability of a Shiga toxin type 2 gene in Enterobacter cloacae. J. Clin. Microbiol. 1997, 35, 1917. [PubMed] Kimura, T.; Tani, S.; Yi, Y.M.; Takeda, T. Serum amyloid P component is the Shiga toxin 2-neutralizing factor in human blood. J. Biol. Chem. 2001, 276, 41576–41579. [CrossRef] [PubMed] Marcato, P.; van der Helm, K.; Mulvey, G.L.; Armstrong, G.D. Serum amyloid P component binding to Shiga toxin 2 requires both a subunit and B pentamer. Infect. Immun. 2003, 71, 6075–6078. [CrossRef] [PubMed] Armstrong, G.D.; Mulvey, G.L.; Marcato, P.; Griener, T.P.; Kahan, M.C.; Tennent, G.A.; Sabin, C.A.; Chart, H.; Pepys, M.B. Human serum amyloid P component protects against Escherichia coli O157:H7 Shiga toxin 2 in vivo: Therapeutic implications for hemolytic-uremic syndrome. J. Infect. Dis. 2006, 193, 1120–1124. [CrossRef] [PubMed] Caprioli, A.; Luzzi, I.; Seganti, L.; Marchetti, M.; Karmali, M.A.; Clarke, I.; Boyd, B. Frequency and nature of verocytotoxin 2 (VT2) neutralizing activity (NA) in human and animal sera. In Recent Advances in Verocytotoxin-Producing Escherichia coli Infections; Karmali, M.A., Goglio, A., Eds.; Elsevier: Amsterdam, The Netherlands, 1994; pp. 353–356. He, X.; Qi, W.; Quinones, B.; McMahon, S.; Cooley, M.; Mandrell, R.E. Sensitive detection of Shiga toxin 2 and some of its variants in environmental samples by a novel immuno-PCR assay. Appl. Environ. Microbiol. 2011, 77, 3558–3564. [CrossRef] [PubMed] Feng, P.C.; Jinneman, K.; Scheutz, F.; Monday, S.R. Specificity of PCR and serological assays in the detection of Escherichia coli Shiga toxin subtypes. Appl. Environ. Microbiol. 2011, 77, 6699–6702. [CrossRef] [PubMed] Willford, J.; Mills, K.; Goodridge, L.D. Evaluation of three commercially available enzyme-linked immunosorbent assay kits for detection of Shiga toxin. J. Food Prot. 2009, 72, 741–747. [PubMed] Skinner, C.; Patfield, S.; Hernlem, B.J.; He, X. New Stx2e Monoclonal Antibodies for Immunological Detection and Distinction of Stx2 Subtypes. PLoS ONE 2015, 10, e0132419. [CrossRef] [PubMed] Alam, S.I.; Kumar, B.; Kamboj, D.V. Multiplex detection of protein toxins using MALDI-TOF-TOF tandem mass spectrometry: Application in unambiguous toxin detection from bioaerosol. Anal. Chem. 2012, 84, 10500–10507. [CrossRef] [PubMed] Conrady, D.G.; Flagler, M.J.; Friedmann, D.R.; van der Wielen, B.D.; Kovall, R.A.; Weiss, A.A.; Herr, A.B. Molecular basis of differential B-pentamer stability of Shiga toxins 1 and 2. PLoS ONE 2010, 5, e15153. [CrossRef] [PubMed]
5251
Toxins 2015, 7, 5236–5253
26.
27.
28.
29.
30.
31.
32.
33.
34.
35.
36. 37.
38. 39. 40.
41. 42. 43.
Fagerquist, C.K.; Sultan, O. Top-down proteomic identification of furin-cleaved alpha-subunit of Shiga toxin 2 from Escherichia coli O157:H7 using MALDI-TOF-TOF-MS/MS. J. Biomed. Biotechnol. 2010, 2010, 123460. [CrossRef] [PubMed] Fagerquist, C.K.; Sultan, O. Induction and identification of disulfide-intact and disulfide-reduced beta-subunit of Shiga toxin 2 from Escherichia coli O157:H7 using MALDI-TOF-TOF-MS/MS and top-down proteomics. Analyst 2011, 136, 1739–1746. [CrossRef] [PubMed] Kitova, E.N.; Daneshfar, R.; Marcato, P.; Mulvey, G.L.; Armstrong, G.; Klassen, J.S. Stability of the homopentameric B subunits of Shiga toxins 1 and 2 in solution and the gas phase as revealed by nanoelectrospray fourier transform ion cyclotron resonance mass spectrometry. J. Am. Soc. Mass Spectrom. 2005, 16, 1957–1968. [CrossRef] [PubMed] Kitova, E.N.; Kitov, P.I.; Bundle, D.R.; Klassen, J.S. The observation of multivalent complexes of Shiga-like toxin with globotriaoside and the determination of their stoichiometry by nanoelectrospray fourier-transform ion cyclotron resonance mass spectrometry. Glycobiology 2001, 11, 605–611. [PubMed] Kitova, E.N.; Kitov, P.I.; Paszkiewicz, E.; Kim, J.; Mulvey, G.L.; Armstrong, G.D.; Bundle, D.R.; Klassen, J.S. Affinities of Shiga toxins 1 and 2 for univalent and oligovalent PK-trisaccharide analogs measured by electrospray ionization mass spectrometry. Glycobiology 2007, 17, 1127–1137. [CrossRef] [PubMed] Kitova, E.N.; Mulvey, G.L.; Dingle, T.; Sinelnikov, I.; Wee, S.; Griener, T.P.; Armstrong, G.D.; Klassen, J.S. Assembly and stability of the Shiga toxins investigated by electrospray ionization mass spectrometry. Biochemistry 2009, 48, 5365–5374. [CrossRef] [PubMed] Kondo, F.; Kobayashi, S.; Matsumoto, M.; Yamada, S.; Saito, M.; Suzuki, Y.; Ishikawa, N.; Nakanishi, T.; Shimizu, A. Analysis of Vero toxins 1 and 2 by high-performance liquid chromatography/electrospray ionization mass spectrometry. J. Mass Spectrom. 1997, 32, 1140–1142. [CrossRef] Kondo, F.; Saito, H.; Hayashi, R.; Onda, H.; Kobayashi, S.; Matsumoto, M.; Suzuki, M.; Ito, Y.; Oka, H.; Nakanishi, T.; et al. Identification of Shiga toxins in Shiga toxin-producing Escherichia coli using immunoprecipitation and high-performance liquid chromatography-electrospray ionization mass spectrometry. Analyst 2003, 128, 1360–1364. [CrossRef] [PubMed] Meisen, I.; Friedrich, A.W.; Karch, H.; Witting, U.; Peter-Katalinic, J.; Muthing, J. Application of combined high-performance thin-layer chromatography immunostaining and nanoelectrospray ionization quadrupole time-of-flight tandem mass spectrometry to the structural characterization of high- and low-affinity binding ligands of Shiga toxin 1. Rapid Commun. Mass Spectrom. 2005, 19, 3659–3665. [PubMed] Silva, C.J.; Erickson-Beltran, M.L.; Skinner, C.B.; Dynin, I.; Hui, C.; Patfield, S.A.; Carter, J.M.; He, X. Safe and effective means of detecting and quantitating Shiga-like toxins in attomole amounts. Anal. Chem. 2014, 86, 4698–4706. [CrossRef] [PubMed] Domon, B.; Aebersold, R. Mass spectrometry and protein analysis. Science 2006, 312, 212–217. [CrossRef] [PubMed] Pan, S.; Aebersold, R.; Chen, R.; Rush, J.; Goodlett, D.R.; McIntosh, M.W.; Zhang, J.; Brentnall, T.A. Mass spectrometry based targeted protein quantification: Methods and applications. J. Proteome Res. 2009, 8, 787–797. [CrossRef] [PubMed] Picotti, P.; Aebersold, R. Selected reaction monitoring-based proteomics: Workflows, potential, pitfalls and future directions. Nat. Methods 2012, 9, 555–566. [CrossRef] [PubMed] ExPASy. Available online: http://www.expasy.org/tools/ (accessed on 16 November 2015). Silva, C.J.; Dynin, I.; Erickson, M.L.; Requena, J.R.; Balachandran, A.; Hui, C.; Onisko, B.C.; Carter, J.M. Oxidation of Methionine 216 in Sheep and Elk Prion Protein Is Highly Dependent upon the Amino Acid at Position 218 but Is not Important for Prion Propagation. Biochemistry 2013, 52, 2139–2147. [CrossRef] [PubMed] Roepstorff, P.; Fohlman, J. Proposal for a common nomenclature for sequence ions in mass spectra of peptides. Biomed. Mass Spectrom. 1984, 11, 601. [CrossRef] [PubMed] Skinner, C.; McMahon, S.; Rasooly, R.; Carter, J.M.; He, X. Purification and characterization of Shiga toxin 2f, an immunologically unrelated subtype of Shiga toxin 2. PLoS ONE 2013, 8, e59760. [CrossRef] [PubMed] He, X.; Patfield, S.; Hnasko, R.; Rasooly, R.; Mandrell, R.E. A polyclonal antibody based immunoassay detects seven subtypes of Shiga toxin 2 produced by Escherichia coli in human and environmental samples. PLoS ONE 2013, 8, e76368. [CrossRef] [PubMed]
5252
Toxins 2015, 7, 5236–5253
44.
45.
Onisko, B.; Dynin, I.; Requena, J.R.; Silva, C.J.; Erickson, M.; Carter, J.M. Mass spectrometric detection of attomole amounts of the prion protein by nanoLC/MS/MS. J. Am. Soc. Mass Spectrom. 2007, 18, 1070–1079. [CrossRef] [PubMed] Sambrook, J.; Fritsch, E.F.; Maniatis, T. Molecular Cloning: A Laboratory Manual, 2nd ed.; Cold Spring Harbor Press: Cold Spring Harbor, NY, USA, 1989; p. 1626. © 2015 by the authors; licensee MDPI, Basel, Switzerland. This article is an open access article distributed under the terms and conditions of the Creative Commons by Attribution (CC-BY) license (http://creativecommons.org/licenses/by/4.0/).
5253