South African Journal of Animal Science 2003, 33 (1) © South African Society for Animal Science
43
Age trends in economically important traits of Merino ewes subjected to 10 years of divergent selection for multiple rearing ability S.W.P. Cloete1,2,#, A.R. Gilmour3, J.J. Olivier4 and J.B. van Wyk1 1
University of the Free State, PO Box 339, Bloemfontein 9300, South Africa Elsenburg Agricultural Centre, Private Bag X1, Elsenburg 7607, South Africa 3 NSW Agriculture, Orange Agricultural Institute, Forest Road, Orange 2800, NSW, Australia 4 ARC: Animal Improvement Institute, Private Bag X5013, Stellenbosch 7599, South Africa 2
________________________________________________________________________________________________
Abstract Data were recorded for annual reproduction, wool traits and pre-joining live weight of between 992 (for staple strength) to approximately 1200 production records of Merino ewes over the period from 1997 to 2002. The resource population has been divergently selected from the same base since 1986, either for (H line) or against (L line) maternal multiple rearing ability. When expressed relative to mean L line performance, the advantage in reproduction for the H line amounted to 34% for number of lambs born per ewe, 49% for number of lambs weaned per ewe and 56% for weight of lamb weaned per ewe. Overall trends in reproduction with an increase in age from 2 - 7+ years were consistent with corresponding trends in the literature. The shape of these curves did not differ between selection lines, i.e. no significant interaction between selection line and ewe age was found. Maiden H line ewes were heavier than L line contemporaries. Ewe joining weight increased with age in both lines. Line differences were reduced to a tendency in 3-year old ewes, and no subsequent line differences were found. The random non-linear component of the spline for ewe age also interacted with selection line for clean fleece weight. Conclusive advantages in favour of L line ewes were obtained at 3 - 6 years of age. In maiden ewes the line difference was restricted to a tendency in favour of the L line while no line difference occurred in 7-year old ewes. Ewes in the L line outperformed H line contemporaries for staple strength at four years of age, but no line difference was found at other ages. Coefficient of variation of fibre diameter and mean fibre diameter did not differ between lines. Coefficient of variation of fibre diameter generally declined curvi-linearly with an increase in ewe age, while fibre diameter showed a near linear increase. Estimates of h² for reproduction traits were 0.09±0.05 for number of lambs born per ewe, 0.05±0.05 for number of lambs weaned per ewe, and 0.05±0.05 for weight of lamb weaned per ewe. Corresponding h² estimates for wool traits were 0.34±0.08 for clean fleece weight, 0.05±0.05 for staple strength, 0.74±0.02 for coefficient of variation and 0.76±0.02 for fibre diameter. A h² estimate of 0.37±0.09 was obtained for ewe live weight at joining. Ewe permanent environment (c²ewe) for the reproduction traits were 0.15±0.05 for number of lambs born per ewe, 0.19±0.05 for number of lambs weaned per ewe and 0.19±0.05 for weight of lamb weaned per ewe. The corresponding c²ewe estimate for ewe joining weight was 0.40±0.09, while those for annual wool production traits were 0.31±0.08 for clean fleece weight and 0.12±0.05 for staple strength. Coefficient of variation and mean fibre diameter were not influenced by the ewe permanent environment. Line differences in age trends for wool traits and ewe joining weight were attributed to the drainage by reproduction on the reserves of H line ewes. _____________________________________________________________________________________ Keywords: Age trends, lamb output, clean fleece weight, staple strength, ewe joining weight, smoothing splines #
Corresponding author. E-mail address:
[email protected]
Introduction Previous work at this institution indicated that divergent selection for ewe multiple rearing ability resulted in lines differing widely in lamb output (Cloete & Scholtz, 1998). Given that lamb and mutton are in demand by the South African consumer, this difference has considerable economic implications. Over the past decade, fluctuations in the ratio between wool and meat prices have resulted in the shifting of the emphasis between the two products during selection. This resulted in distinct changes in the South African Merino industry. The breeding strategy was adapted to enable an improved meat production capability (Olivier, 1999). It is well known that wool prices improved substantially over the last season, impacting on the income derived by farmers from that source. The implications of the strategy of selecting for an improved
The South African Journal of Animal Science is available online at http://www.co.za/Sajas.html
South African Journal of Animal Science 2003, 33 (1) © South African Society for Animal Science
44
reproduction rate on other traits contributing to the lifetime income from ewes have, so far, not been studied in detail. Against this background, we compared the performance of breeding ewes selected divergently for multiple rearing ability with regard to wool and live weight traits. In the previous study, it became clear that ewe permanent environmental correlations of reproduction with wool traits and live weight differed markedly from corresponding genetic correlations with regard to sign and magnitude (Cloete et al., 2003). The implications of a strategy for the improvement of reproduction on performance of ewes in the current flock thus need to be studied further.
Material and methods Two lines of Merino sheep were selected divergently from the same base population since 1986, using maternal ranking values for lambs reared per joining (Cloete & Scholtz, 1998). Ewe and ram replacements in the High (H) line were preferably the progeny of ewes rearing more than one lamb per joining (i.e. reared twins at least once). The progeny of ewes rearing fewer than one lamb per joining (i.e. barren or lost all lambs born at least once) were preferred as replacements in the Low (L) line. Depending on the average reproduction of the lines and the replacement needs, progeny of ewes that reared one lamb per joining were occasionally accepted in both lines. Selection decisions were mostly based on ≥3 maternal joinings, especially in the case of rams. Once selected, ewes normally remained in the breeding flock for five to six joinings. The H line was augmented by 28 ewe progeny born from an embryo transfer program during 1991 and 1992 (Cloete et al., 1998). The mean performance of the ewes derived in this way was similar to that recorded in the H line, and they were treated as one group. For the duration of the experiment (1997 to 2002, after at least 10 years of divergent selection), the two lines were maintained as a single flock, except during joining over a 6-week period in single sire groups to four to six rams during January-February each year. The lines were maintained on the Elsenburg experimental farm near Stellenbosch at this stage. Cloete & Scholtz (1998) and Cloete et al. (2003) detailed the locality and the management practices implemented, as well as the recording of data in the flock. Reproduction traits under consideration included repeated records of number of lambs born per ewe, number of lambs weaned per ewe and total weight of lamb weaned per ewe (corrected for gender and birth year), as defined by Cloete et al. (2003). Live weight at joining and annual greasy fleece weight were also recorded. A wool sample was taken at shearing from individual ewes, and analysed for clean yield, staple strength, coefficient of variation of fibre diameter as well as mean fibre diameter. Clean yield was used to calculate clean fleece weight. ASREML (Gilmour et al., 1999) was used to estimate variance components for the reproduction traits, clean fleece weight, staple strength, coefficient of variation, mean fibre diameter and live weight in single-trait, repeated records analyses. The analysis of discrete data such as number of lambs born and weaned with parametric methods used in the present study is not optimal, as was outlined by Purvis & Hillard (1997). The availability of suitable software, and the close approximation of outcomes from linear models to that derived from non-linear methods have resulted in recommendations that the former methods could be employed until alternative software packages become readily available (Jorhensen, 1994; Brien et al., 2002). Direct additive genetic effects and permanent environmental ewe effects were computed where applicable, as determined by the derived log likelihood tests. The statistical modelling and assumptions were similar to that described by Cloete et al. (2003). A random effect of service sire was initially included in the analyses for reproduction traits, but it was found not to affect (P > 0.05) log likelihood values, and was thus excluded from the final runs. A cubic spline (Verbyla et al., 1999) was used to model changes in production with age. The interaction of selection line with the linear and curvilinear components of the spline was fitted initially, and retained in the final analyses where significant.
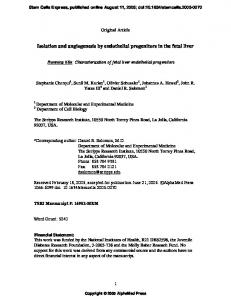
Results Overall reproduction over the 6-year study period was markedly higher (P < 0.01) in the H line than in the L line (Table 1). Expressed relative to mean L line performance, the advantage in the H line amounted to 34% for number of lambs born, 49% for number of lambs weaned and 56% for weight of lamb weaned. The linear and non-linear spline components of age at lambing did not interact with selection line for the reproduction traits (P > 0.05). Trends for total weight of lamb weaned are provided as illustration in Figure 1. It is clear that the shape of the curves was similar for the two lines, but that the mean performance levels in
The South African Journal of Animal Science is available online at http://www.co.za/Sajas.html
South African Journal of Animal Science 2003, 33 (1) © South African Society for Animal Science
45
the H line exceeded those in the L line. Number of lambs born and weaned per ewe, as well as total weight of lambs weaned per ewe increased (P < 0.05) with age to reach a maximum by four to five years (Table 1). A subsequent decline followed in number and total weight of lamb weaned per ewe, but not for number of lambs born per ewe. Table 1 Least squares means (±s.e.) for reproduction traits and live weight at joining in 1199 records from ewes in the H and L lines, as affected by selection line and age. Means for selection line were predicted at an average ewe age Trait Fixed effect
Number of Lambs born per ewe 1.23±0.05 Overall mean NS Year ** Selection line 1.41±0.06 H Line 1.05±0.06 L Line ** Age at lambing 0.81±0.05 2 years 1.07±0.05 3 years 1.23±0.05 4 years 1.29±0.05 5 years 1.28±0.05 6 years 1.26±0.07 7+ years NS Not significant (P > 0.05) ** Significant (P < 0.01)
Number of Lambs weaned per ewe 0.97±0.04 NS ** 1.16±0.05 0.78±0.06 ** 0.65±0.05 0.86±0.04 0.97±0.04 0.98±0.04 0.90±0.05 0.74±0.07
Weight of lamb weaned per ewe (kg) 20.6±0.9 NS ** 25.1±1.0 16.1±1.1 ** 13.7±1.0 18.3±0.9 20.6±0.9 20.9±0.9 19.3±0.9 15.4±1.5
Live weight at joining (kg) 50.2±0.6 ** NS 50.8±0.7 49.7±0.7 ** 40.0±0.6 47.0±0.6 50.3±0.6 51.9±0.5 53.3±0.5 54.4±0.7
Weight of lamb weaned
30 25 20
L Line H Line
15 10 5 2
3
4
5
6
7
Ewe age
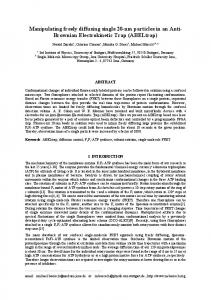
Figure 1 Age trends in total weight of lamb weaned in H and L line ewes. Vertical bars about the means denote standard errors Selection line interacted (P < 0.05) with the linear component of the spline for ewe age in the case of live weight at joining. This interaction is depicted in Figure 2. Ewes in the H line were 5% heavier (P < 0.05) than L line contemporaries at two years of age (41.0±0.7 vs. 38.9±0.8 kg respectively). Live weight increased (P < 0.01) with age in both lines, but the initial line difference was reduced to a tendency (P < 0.10) at three years of age. No line difference was found at later ages. Overall means for clean fleece weight and staple strength suggested differences in favour of the L line for these traits (Table 2). The interpretation of results for these traits was, however, complicated by significant interactions of selection line with the curvilinear spline components for ewe age. Ewes in the L line had a higher (P < 0.05) clean fleece weight than H line contemporaries at three to six years of age. Ewes
The South African Journal of Animal Science is available online at http://www.co.za/Sajas.html
South African Journal of Animal Science 2003, 33 (1) © South African Society for Animal Science
46
in the H line tended (P < 0.10) to have a lower clean wool production at two years of age than their L line contemporaries (3.45±0.8 vs. 3.63±1.0 kg respectively). In older ewes very little evidence of an increase in clean fleece weight with age was observed in the H line, while wool production increased (P < 0.05) to higher levels in 4-year old ewes belonging to the L line (Figure 3). A subsequent decline in fleece weight followed in L line, so that no line difference was observed in 7-year old ewes. 56
Live weight (kg)
52 48
L Line H Line
44 40 36 2
3
4
5
6
7
Ewe age
Figure 2 Age trends in ewe joining weight in H and L line ewes. Vertical bars about the means denote standard errors Table 2 Least squares means (±s.e.) for wool traits in 1199 records from ewes in the H and L lines (991 records in the case of staple strength), as affected by selection line and age. Means for selection line were predicted at an average ewe age Trait Fixed effect
Clean fleece weight (kg) 3.78±0.06 Overall mean ** Year * Selection line 3.59±0.08 H Line 3.96±0.09 L Line ** Age at lambing 3.54±0.07 2 years 3.72±0.07 3 years 3.78±0.06 4 years 3.74±0.06 5 years 3.67±0.06 6 years 3.61±0.08 7+ years NS Not significant (P > 0.05) * Significant (P < 0.05) ** Significant (P < 0.01)
Staple strength (N/ktex) 43.6±1.0 ** * 40.9±1.3 46.4±1.6 ** 54.8±1.1 39.7±1.0 43.5±1.1 45.9±1.1 48.3±1.2 53.8±1.6
Coefficient of variation (%) 19.4±0.3 ** NS 19.3±0.3 19.6±0.4 * 20.3±0.3 19.7±0.3 19.4±0.3 19.4±0.3 19.4±0.3 19.0±0.3
Fibre diameter (µm) 22.5±0.2 * NS 22.6±0.2 22.4±0.3 ** 21.4±0.2 22.0±0.2 22.5±0.2 23.0±0.2 23.4±0.2 23.8±0.2
Means for staple strength declined (P < 0.05) in both lines from two to three years of age (Figure 4). This decline was followed by a general increase in subsequent age groups (Table 2). The only age group where a 12% advantage in favour of L line ewes could be discerned in staple strength, was in 4-year old ewes (40.8±1.3 vs. 46.3±1.6 N/ktex respectively). Selection line and ewe age were not involved in any interactions in the case of coefficient of variation and fibre diameter. Both traits were independent of selection line (Table 2). Coefficient of variation showed a declining tendency (P < 0.05) with age, and
The South African Journal of Animal Science is available online at http://www.co.za/Sajas.html
South African Journal of Animal Science 2003, 33 (1) © South African Society for Animal Science
47
stabilized at approximately 19.4% from four years of age onwards. Fibre diameter showed a near linear increase (P < 0.05) with age, to reach nearly 24 µm in 7-year old ewes.
Clean fleece weight (kg)
4.2 4 3.8
L Line H Line
3.6 3.4 3.2 2
3
4
5
6
7
Ewe age
Figure 3 Age trends in clean fleece weight in H and L line ewes. Vertical bars about the means denote standard errors
Staple strenght (N/ktex)
60 55 50
L Line H Line
45 40 35 2
3
4
5
6
7
Ewe age
Figure 4 Age trends in staple strength in H and L line ewes. Vertical bars about the means denote standard errors Heritabilities obtained for the reproduction traits were consistently below 0.1 (Table 3). Ewe permanent environmental variance ratios were somewhat higher, approaching 0.2 for number and weight of lamb weaned per ewe. In the case of live weight at joining and clean fleece weight, h² estimates approached 0.4 while they exceeded 0.7 in analyses on coefficient of variation of fibre diameter and mean fibre diameter. Staple strength was lowly heritable, at 0.05. Estimates of c² were between 0.3 and 0.4 for ewe joining weight
The South African Journal of Animal Science is available online at http://www.co.za/Sajas.html
South African Journal of Animal Science 2003, 33 (1) © South African Society for Animal Science
48
and clean fleece weight, and 0.12 for staple stength. Ewe permanent environmental effects were not significant for coefficient of variation of fibre diameter as well as mean fibre diameter. Table 3 Variance components and ratios for traits of economic importance in mature breeding ewes in the H and L lines Variance components Trait σ ²a σ ²pe σ ²e Number of lambs born 0.0375 0.0667 0.3318 Number of lambs weaned 0.0201 0.0830 0.3243 Weight of lamb weaned (kg) 8.8327 32.992 130.63 Ewe joining weight (kg) 11.160 12.049 6.6957 Clean fleece weight (kg) 0.1388 0.1264 0.1394 Staple strength (N/ktex) 8.6737 19.670 139.61 Coefficient of variation (%) 4.1542 n.a. 1.4778 Fibre diameter (µm) 2.4194 n.a. 0.7694 σ ²a – Direct additive variance; σ²pe – Ewe permanent environmental variance; σ²e – Heritability; c²pe – Ewe permanent environmental variance ratio; n.a. – Not applicable
Variance ratios h² c²pe 0.09±0.05 0.15±0.05 0.05±0.05 0.19±0.05 0.05±0.05 0.19±0.05 0.37±0.09 0.40±0.09 0.34±0.08 0.31±0.08 0.05±0.05 0.12±0.05 0.74±0.02 n.a. 0.76±0.02 n.a. Environmental variance; h² –
Discussion The general trends in ewe reproduction with an increase in age were consistent with those reported by Fourie & Heydenrych (1983a), Brash et al. (1994a) and Cloete et al. (2003). The H line had an advantage (P < 0.01) relative to the L line with regard to lamb output, as was reported previously (Cloete & Scholtz, 1998; Cloete et al., 2003). Selection for total weight of lamb weaned in the United States led to similar benefits (Ercanbrack & Knight, 1998). At two years of age, H line ewes were heavier (P < 0.05) than contemporaries in the L line. This line difference was consistent with genetic trends in the two lines, where H line progeny became heavier and plainer relative to the L line (Cloete & Olivier, 1998). It also accords with genetic correlations estimated earlier in the same resource population (Cloete et al., 2003). The difference, however, declined at later ages, and L line ewes were as heavy as H line contemporaries at four years of age and older. This result could be ascribed to the greater demands of a higher reproduction rate on the reserves of H line ewes. In the literature, lactating ewes were also shown to be leaner, and lower in live weight than non-lactating ewes (Lee & Atkins, 1995). It should also be seen in relation to the relatively high unfavourable ewe permanent environmental correlations between weight of lamb weaned and live weight at joining obtained earlier (Cloete et al., 2003). Age trends in ewe joining weight were consistent with those reported in the literature (Fourie & Heydenrych, 1983b). Ewes in the L line had a higher (P < 0.05) clean fleece weight than H line contemporaries at ages from three to six years of age. The trend in clean fleece weight with age in the L line conformed to results in the literature (Fourie & Heydenrych, 1983b), while the H line ewes showed an atypical trend. This line difference could be attributed to the greater metabolic demands associated with an increased reproduction rate, since genetic trends for fleece weight in progeny of the two lines showed no evidence of a genetic divergence for clean fleece weight (Cloete & Olivier, 1998). The genetic correlation between greasy fleece weight and reproduction in the same resource population was correspondingly low in magnitude and variable in sign (Cloete et al., 2003). Ewe permanent environmental correlations of greasy fleece weight with reproduction were, on the other hand, relatively high and unfavourable. The impact of reproduction on fleece production has been quantified in the literature (Charlick & Arnold, 1990; Lee & Atkins, 1995; Hinch et al., 1996). Compared to barren ewes, the penalty in fleece weight was 652 g in ewes rearing singles, and 846 g in ewes rearing twins (Charlick & Arnold, 1990). Comparable estimates in high fecundity Border Leicester X Merino ewes were 530 g for ewes bearing singles, 610 g for ewes bearing twins and 880 g for ewes bearing triplets (Hinch et al., 1996). At this stage, the reason for the decline in clean fleece weight of L line ewes relative to H line ewes at ages older than five years is unclear. Staple strength of L line ewes was superior (P < 0.05) to that of H line contemporaries at four years of age. Given that staple strength is known to be reduced by reproduction (Hinch et al., 1996; Cloete et al., 2000), this result was not entirely unexpected. The reason why it only involved 4-year old ewes is, however, not clear. Staple strength was generally well above the value of 25 to 30 N/ktex which is generally considered as sound (Read, 1996; Scrivener & Vizard, 1997). In previous work at this institute, it was
The South African Journal of Animal Science is available online at http://www.co.za/Sajas.html
South African Journal of Animal Science 2003, 33 (1) © South African Society for Animal Science
49
demonstrated that wool of ewes subjected to pre-lamb shearing was more sound (P < 0.05) than that of ewes shorn before joining, with fewer mid-staple breaks (Cloete et al., 2000). The practice of pre-lamb shearing employed in the resource population used may thus well have contributed to the general soundness of the wool tested. The obtained age trends in staple strength could not be validated from the literature. Age did not have a uniform effect on staple strength in the study of Scrivener & Vizard (1997), but it was stated that the oldest age group had the highest staple strength in one year of a 2-year study. Is has also been shown that the staple strength of breeding ewes was reduced relative to 10- and 16-month old replacements (Greeff et al., 1995). Maiden ewes correspondingly had a lower (P < 0.01) mean staple strength than adult ewes in the study of Hinch et al. (1996), when shorn late in October after lambing in July. In our study, with ewes being shorn prior to lambing, the low staple strength of ewes lambing at three years of age could possibly be related to a carry-over effect from the previous lambing as maidens (Figure 4). Coefficient of variation of fibre diameter as well as fibre diameter was unaffected by selection line. In the sense that fibre diameter is one of the most important determinants of wool price (Purvis, 1995) this result is pleasing. It should, however, be kept in mind that higher reproducing ewes are known to produce finer fleeces than lower reproducing contemporaries (Cloete et al., 2000). Genetic trends in the resource population used were inconclusive in this respect, although H line progeny tended to become stronger while L line progeny tended to become finer (Cloete & Olivier, 1998). The increase in fibre diameter with ewe age is consistent with trends reported in Australia (Atkins, 1990; Hickson et al., 1995). The h² estimate for number of lambs born per ewe in Table 3 accorded with estimates in the literature (0.06 – Brash et al., 1994a; 0.03 – Brash et al., 1994b; 0.07 to 0.12 – Bromley et al., 2000; 0.06 to 0.10 – Cloete et al., 2002b; 2003). In the case of number of lambs weaned per ewe, h² was estimated at 0.05. Comparable estimates in the literature were 0.06 (Brash et al., 1994a), 0.03 (Brash et al., 1994b), 0.03 to 0.07 (Bromley et al., 2000); 0.04 (Swan et al., 2001) and 0.04 (Cloete et al., 2002b; 2003). Our estimate for total weight of lamb weaned per ewe (0.05) accorded with those of Bromley et al. (2001), ranging from 0.02 to 0.11. Our previous estimate on a larger data set, but using the same resource population, amounted to 0.04 (Cloete et al., 2003). It was also closely associated with an estimate of 0.05 made in a Western Australian resource flock (Cloete et al., 2002b). Estimates of c²pe for the reproduction traits in our study exceeded 0.15 in all cases. Corresponding estimates reported by Bromley et al. (2000) were somewhat lower, at 0.01 to 0.07. Swan et al. (2001) reported a c²pe estimate of 0.09 for number of lambs weaned per ewe. The h² estimate for live weight at joining was consistent with that of 0.46 reported by Swan et al. (2001). The latter study also reported a c²pe estimate of 0.13 for live weight, which was somewhat lower than that reported in this study. In a previous study on live weight at joining in the same resource population, but using the complete data set, h² was estimated at 0.49 and c²pe at 0.25 (Cloete et al., 2003). Estimates for the h² of fleece weight ranged from 0.47 to 0.55 in the studies of Bromley et al. (2000; 2001), which were slightly higher than our estimate of 0.31. In a previous study on greasy fleece weight in the same resource population, but using a larger data set, h² was estimated at 0.53 (Cloete et al., 2003). The present estimate of 0.31 is, however, in good agreement with corresponding estimates reported for a number of studies on yearling and hogget sheep (see Cloete et al., 2002a for summary). Bromley et al. (2000) reported c²pe estimates ranging from 0.08 to 0.17 for clean fleece weight in four breeds. Our corresponding estimate was somewhat higher, at 0.31. This estimate is in good agreement with our previous estimate of 0.25 on the same resource population, but employing a larger data set (Cloete et al., 2003). No estimates where the between ewe variance for staple strength in mature ewes was partitioned in genetic and ewe permanent environmental components were found in the literature. From the present data, repeatability (the sum of the former components) was estimated at 0.17 for staple strength. Greeff et al. (1995) estimated h² of staple strength at 0.25 in mature ewes at the great Southern Research Centre. From the information provided in the reference, this estimate seems to be the sum of genetic and ewe permanent environmental effects. It thus appears to be in correspondence with the present estimate. Estimates of h² for coefficient of variation and fibre diameter were well in excess of 0.70 in the present study. Comparable estimates on repeated records of ewes could not be found, but estimates of the same magnitude are commonly found in studies on yearling and hogget sheep (see Cloete et al., 2002a for summary).
Conclusions The estimation of genetic parameters was not considered as the primary objective of the study. It is nonetheless mentionable that estimates were in general agreement with those cited from the literature,
The South African Journal of Animal Science is available online at http://www.co.za/Sajas.html
South African Journal of Animal Science 2003, 33 (1) © South African Society for Animal Science
50
despite the small size of the data set used. The study indicated that high levels of reproduction were attainable in pasture-fed sheep flocks selected for multiple rearing ability. On the down side, it was shown that H line ewes failed to carry their advantage in live weight through to an age where they would, generally, be cast for age. Clean wool production was also impaired in H line ewes aged between three and six years, which is generally regarded as the most productive years from a wool production perspective (Fourie & Heydenrych, 1983b). The penalties in live weight and wool traits in the current flock that could be associated with an increased reproduction should be balanced against the improvement in income derived from the production of lamb. The economic implications thereof would strongly depend on the ratio between the prices of wool and meat.
Acknowledgements We wish to thank those responsible for the maintenance and recording of the experimental animals (J.E. Fourie, J.J.E. Cloete and A.J. Scholtz). The maintenance of the animals was partially enabled by a grant from the SA Wool Industry.
References Atkins, K.D., 1990. Incorporating parameters for lifetime productivity into breeding objectives for sheep. Proc. 4th World Cong. Gen. Appl. Livest. Prod., Edinburgh 15, 17-26. Brash, L.D., Fogarty, N.M. & Gilmour, A.R., 1994a. Reproductive performance and genetic parameters for Australian Dorset sheep. Aust. J. Agric. Res. 45, 427-441. Brash, L.D., Fogarty, N.M. & Gilmour, A.R., 1994b. Genetic parameters for Australian maternal and dualpurpose meatsheep breeds. II. Liveweight, wool and reproduction in Corriedale sheep. Aust. J. Agric. Res. 45, 469-480. Brien, F.D., Konstantinov, K.V. & Greeff, J.C., 2002. Comparison of linear and threshold models for predicting direct and maternal genetic effects on number of lambs weaned in Western Australian Merinos. Proc. 7th World Cong. Gen. Appl. Livest. Prod. 32, 307-310. 18-23 August 2002, Montpellier, France. Bromley, C.M., Snowder, G.D. & Van Vleck, L.D., 2000. Genetic parameters among weight, prolificacy, and wool traits of Columbia, Polypay, Rambouillet, and Targhee sheep. J. Anim. Sci. 78, 846-858. Bromley, C.M., Van Vleck, L.D. & Snowder, G.D., 2001. Genetic correlations for litter weight weaned with growth, prolificacy, and wool traits in Columbia, Polypay, Rambouillet, and Targhee sheep. J. Anim. Sci. 79, 339-346. Charlick, A.J. & Arnold, G.W., 1990. Effect of bearing and rearing lambs on Merino wool production. Aust. J. Exp. Agric. 30, 591-594. Cloete, S.W.P., Gilmour, A.R., Olivier, J.J. & Van Wyk, J.B., 2003. Genetic and phenotypic trends and parameters in reproduction, greasy fleece weight and live weight in Merino lines divergently selected for multiple rearing ability. Aust. J. Exp. Agric. (in press). Cloete, S.W.P., Greeff, J.C. & Lewer, R.P., 2002a. Direct and maternal genetic (co)variances for hogget live weight and fleece traits in Western Australian Merino sheep. Aust. J. Agric. Res. 53, 271-279. Cloete, S.W.P., Greeff, J.C. & Lewer, R.P., 2002b. Genetic and environmental variances in lamb production traits of Merino ewes in a Mediterranean environment. Proc. Inaugural Wool Tech. Conf., Hamilton, Victoria, Australia 15-17 October 2001. Conference CD-Rom. Cloete, S.W.P., Muller, C.J.C. & Durand, A., 2000. The effects of shade and shearing date on the production of Merino sheep in the Swartland region of South Africa. S. Afr. J. Anim. Sci. 30, 164-171. Cloete, S.W.P. & Olivier, J.J., 1998. Direct and correlated responses to selection for multiple rearing ability in South African Merinos. Proc. Ann. Cong. S. Afr. Soc. Anim. Sci. 36, 65-68. Cloete, S.W.P. & Scholtz, A.J., 1998. Lamb survival in relation to lambing and neonatal behaviour in medium wool Merino lines divergently selected for ewe multiple rearing ability. Aust. J. Exp. Agric. 38, 801-811. Cloete, S.W.P., Van Niekerk, F.E. & Rust, J.M., 1998. Application of embryo transfer for the improvement of multiple rearing ability in medium wool Merino ewes. Int. Sheep & Goat Res. J. 14, 11-12. Ercanbrack, S.K. & Knight, A.D., 1998. Responses to various selection protocols for lamb production in Rambioullet, Targhee, Columbia and Polypay sheep. J. Anim. Sci. 76, 1311-1325.
The South African Journal of Animal Science is available online at http://www.co.za/Sajas.html
South African Journal of Animal Science 2003, 33 (1) © South African Society for Animal Science
51
Fourie, A.J. & Heydenrych, H.J., 1983a. Phenotypic and genetic aspects of production in the Dohne Merino III The influence of age of the ewe on reproductive performance. S. Afr. J. Anim. Sci. 13, 164-166. Fourie, A.J. & Heydenrych, H.J., 1983b. Phenotypic and genetic aspects of production in the Dohne Merino IV The influence of age of the ewe on production traits. S. Afr. J. Anim. Sci. 13, 167-170. Gilmour, A.R., Cullis, B.R., Welham, S.J. & Thompson, R. 1999. ASREML – Reference manuel. NSW Agriculture Biometric Bulletin No. 3. NSW Agriculture, Orange Agricultural Institute, Forest Road, Orange 2800, NSW, Australia. Greeff, J.C., Lewer, R.P., Ponzoni, R.W. & Purvis, I.W., 1995. Staple strength: progress towards elucidating its place in Merino breeding. Proc. Aust. Assoc. Anim. Breed. Gen. 11, 595-601. Hickson, J.D., Kinghorn. B.P., Piper, L.R. & Swan, A.A., 1995. Micron blowout – using available genetic variation. Proc. Aust. Assoc. Anim. Breed. Gen. 11, 529-533. Hinch, G.N., Lynch, J.J., Nolan, J.V., Leng, R.A., Bindon, B.M. & Piper, L.R., 1996. Supplementation of high fecundity Border Leicester X Merinos ewes with a high protein feed: its effect on lamb survival. Aust. J. Exp. Agric. 36, 129-136. Jorgensen, J.N., 1994. Estimation of genetic parameters for litter size in sheep using a non-linear method. Acta Agric. Scand. A. Anim. Sci. 44, 8-11. Lee, G.J. & Atkins, K.D., 1995. Consequences of reproduction on live weight, fat depth, wool growth, and intake of grazing Merino ewes in the short and long term. Aust. J. Exp. Agric. 35, 153-159. Olivier, J.J., 1999. The South African Merino performance testing scheme. In: Rising to the challenge – Breeding for the 21st Century Customer. Beef Industry and CRC for Premium Quality Wool Industry Symposia. Proc. Assoc. Advmt Anim. Breed. Gen. 13,119-124. Purvis, I.W., 1995. Strategies for improving wool quality and productivity in fine and superfine woolled Merino flocks. Proc. Aust. Assoc. Anim. Breed. Gen. 11, 510-515. Purvis, I.W. & Hillard, M., 1997. Biology and genetics of reproduction. In: The genetics of sheep. Eds. Piper, L. & Ruvinsky, A., CAB International, Wallingford, Oxon, United Kingdom. pp. 375-394. Read, S., 1996. Consumer demands of wool beyond 2000. Demands of wool and wool growers beyond 2000. SARDI Research report series, No 11. pp. 5-13. Scrivener, C.J. & Vizard, A.L., 1997. The relationship between reproductive performance, time of lambing and the staple strength of wool from Merino ewes. Wool Tech. Sheep Breed. 45, 120-128. Swan, A.A., Piper, L.R., Brewer, H.G. & Purvis, I.W., 2001. Genetic variation in reproductive performance of fine wool Merinos. Proc. Assoc. Advmt Anim. Breed. Gen. 14, 417-420. Verbyla, A.P., Cullis, B.R., Kenward M.G. & Welham, S.J., 1999. The analysis of designed experiments and longitudinal data using smoothing splines. J. Royal Stat. Soc., Series C 48, 269-311.
The South African Journal of Animal Science is available online at http://www.co.za/Sajas.html