Habitation, Vol. 12 pp. 21–26 Printed in the USA. All rights reserved. Copyright © 2010 Cognizant Comm. Corp.
1542-9660/10 $60.00 + .00 DOI: 10.3727/154296610X12686999887120 www.cognizantcommunication.com
CONTROL POLICIES FOR A WATER-TREATMENT SYSTEM USING THE MARKOV DECISION PROCESS. PART 1: MATHEMATICAL FORMULATION Tze Chao Chiam*, Dr. Yuehwern Yih*, Cary Mitchell† *School of Industrial Engineering, Purdue University, West Lafayette, IN 47907 †Department of Horticulture and Landscape Architecture, Purdue University, West Lafayette, IN 47907
A model is developed to assist decision-making for choosing control policies for a closed-loop space life-support system. The water-treatment system, which consists of hygiene and potable-water subsystems, is chosen as the focus of this model due to its direct impact to the crewmembers’ water requirements. This paper is the first part of the study where mathematical formulations of processes involved are presented. Input values and some constants are derived from the NASA Baseline and Assumptions Document (BVAD) [5] and previous research. In order to bridge the gap between descriptions in these documents and a realistic system, a simulation is built. Random processes are also introduced in the model to reflect the stochastic nature of some physical processes. Relationships among these physical processes are described by the mathematical formulations. These formulations are set up in such a way that the conditions of the system can be assessed at the beginning of every hour. Output values are obtained from the simulation and are described in Part Two of the study (companion paper). Some benefits from this study include enhancing understanding of controlling physical systems as well as providing formulations that could serve as a base for further developments of other resource supply-and-demand models for closed-loop systems. Keywords: BVAD, water-system modeling, closed-loop, formulation, process flow
1. Introduction
[6,7]) is modeled to treat dirty-water-treatment requirements. Dirty water produced in each subsystem remains in that subsystem. Several policies are defined for each subsystem. At the beginning of each hour, a policy is applied to the overall system based on the state of the system to ensure that it is operating at a condition that provides sufficient clean water for human consumption or use. In order to obtain such policies, a simulation model is built to receive input values either directly from BVAD or from studies based on BVAD. These values are manipulated through a series of formulations and the output is evaluated to determine the “best policy” to be applied to the system. These formulations provide re-
This research is an effort to study the effect of human water usage in a closed environment as described by [5]. The overall water system consists of hygiene and potable-water subsystems that provide water for different usages. The hygiene-water subsystem supplies water for crewmember usages of urinal flush, hand wash, laundry, shower, dish wash, oral hygiene, and face wash. The potable water subsystem supplies clean water for drinking as well as for re-hydration of food. In this research, a technology-independent water-treatment system (as opposed to a physico-chemical or a bio-regenerative system
Address correspondence to Dr. Yuehwern Yih School of Industrial Engineering, Purdue University, 315 North Grant Street,West Lafayette, IN 47907. Email:
[email protected]
21
22
CHIAM, YIH, AND MITCHELL
lationship among the physical processes involved in the water-treatment system. Random processes are also introduced in the model to represent stochastic behavior that could be present in most systems. The primary contribution of this paper is the mathematical formulations that can serve as a base for further developments of resource supply-demand models for a closed-loop system, based upon conservation of resources. These formulations are also set up for efficient capturing of system conditions at the beginning of each hour. Other benefits include providing a scenario for studying process flows for a possible NASA water-treatment system. Control policies also can be developed based on this scenario. This paper, which discusses formulations involved in the model, is part 1 of the study. Part 2 of the study discusses methodology to obtain and apply the best policies.
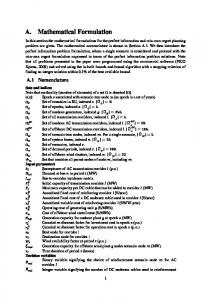
that holds dirty hygiene water to be treated; and a dirty hygiene-water overflow tank that holds excessive dirty water generated before it passes through the treatment technology. The process of water flow is shown in Figure 1. The symbols in the figure are described below. In order to model this subsystem, the following are needed: a system design, a set of variables, the theoretical amount of clean water required at the beginning of every hour, and the theoretical amount of dirty water generated by the end of every hour. The system design consists of the following:
2. Water System
The set of variables consists of the following:
The model used in this research is based on the system described in [4] and [1,2,3]. Several modifications and assumptions were made to reflect an actual system more closely. These modifications include the addition of hourly (water) deficiency, accumulated (water) deficiency, stochastic properties of treatment efficiency, actual water consumption and production, clean-water overflow, dirty-water overflow, a set of possible actions to be taken hourly, and definition of parameters illustrating the states of the system. In this study, “water deficiency” is defined as the amount of water shortage experienced by crewmembers; “stochastic property” refers to randomness present in the system; “efficiency” is a value that governs the amount of water that can be treated through the treatment technology every hour.
1. (Hygiene) Treatment efficiency, Theff: The efficiency of treatment technology used to treat dirty water per hour. 2. Stochastic property of hygiene treatment efficiency, !(Theff): Although efficiency is a fixed value, an arbitrary stochastic value of up to 10% of the fixed value is introduced to reflect randomness that could be present in the system. 3. Stochastic property of the actual amount of hygiene water required for crewmember usage, !(ChActR): The actual amount of water required for crewmember usage is based on usages during the previous and current hour. This value affects the amount of water required for consumption up to ±20% of the base value.
2.1 Hygiene-water subsystem The physical components of the hygiene-water subsystem in this study include a clean-hygienewater tank that holds clean water for hygiene usages; a clean- hygiene-water-overflow tank to hold overflow clean water from treatment technology; a hygiene-treatment tank that limits the amount of dirty water to be treated; a dirty hygiene-water tank
1. (Hygiene) Treatment capacity, Thcap: The maximum amount of water allowed to pass through the treatment technology per hour. 2. (Hygiene) Clean-water tank capacity, CThcap: The maximum amount of clean water that the clean-water tank can hold.
In order to determine the current state of the system, assessments of various aspects of the system are taken. These assessments include the following measures: 1. (Hygiene) Amount of clean water, CLh(t): The amount of (hygiene) clean water at the beginning of every hour. This quantity is also equal to the amount of (hygiene) clean water at the end of the previous hour described in #12. 2. Actual amount of hygiene water required for con-
POLICIES FOR A WATER-TREATMENT SYSTEM - MATHEMATICAL FORMULATION
CThcap
Clean hygiene water tank, CLh(t)
23
Clean hygiene water overflow tank, CLhovf(t)
ChActR(t), ActRandh Hygiene water usage, Chact(t) CLhaft(t), Trth(t)
Dfh(t), CLhaft(t), Dhact(t), Dhtot(t)
Dirty hygiene water tank, Dh(t)
Thcap
Dhtot(t), Trth(t)
Hygiene treatment tank, Trth(t)
Figure 1. Basic structure of the hygiene-water subsystem
sumption, ChActR(t): This value is affected by the amount of deficiency from the previous hour(s). ChActR(t) = Chth(t) + Dh(t), where Dh(t) is the cumulative deficiency described in #5. 3. (Hygiene) Actual random, ActRandh(t): Although the value of the actual amount of water required for consumption can be calculated as shown in #2 above, the value of actual consumption does not necessarily equal the computed value of ChActR(t), due to the stochastic process involved during consumption. In order to capture this random variation, Actual Random is used as follows: ActRandh(t) = ChActR(t) * "(t) * #(t) * !(ChActR), where: "(t) = a random number generated at time t #(t) = a randomly generated direction at time t, either positive or negative, to simulate whether the actual consumption is greater than or less than the actual amount of water required for consumption.
This formulation ensures that the stochastic process only takes place when water consumption occurs. ActRandh(t) is non-zero when there is no deficiency during the hour. If there is no water required during the hour (due to the activity schedule, or if there is no “carry-over” deficiency value), ChActR(t) will be zero. Hence, ActRandh(t) also will be zero. 4. (Hygiene) Actual consumption, Chact(t): Actual amount of water consumption, taking into consideration the amount of water needed due to scheduled activities and deficiencies from current and/or previous hour(s): Chact(t) = min{ChActR(t) + ActRandh(t), CLh(t)} The amount of actual consumption is limited by the amount of clean water available at the beginning of the hour. If the amount of water required is less than that available, then the amount of water available is sufficient to meet the requirements. 5. (Hygiene) Accumulated Deficiency, Dfh(t): Amount of accumulated hygiene water deficiency up to the hour.
24
CHIAM, YIH, AND MITCHELL
Dfh(t) = min{0, ChActR(t) - Chact(t)} 6. (Hygiene) Clean after, CLhaft(t): The amount of clean water left after crewmember water consumption. CLhaft(t) = min{0, CLh(t) - Chact(t)} 7. (Hygiene) Amount of dirty water, Dh(t):The amount of dirty water in the dirty-water tank at the beginning of the hour. This quantity is also equal to the amount of dirty water at the end of the previous hour described in #11. 8. Actual amount of hygiene dirty water produced, Dhact(t): It is assumed that all clean water used during the hour becomes dirty water during the same hour. D
(t) = C
h act
h act
(t)
9. Total hygiene dirty water produced, Dhtot(t): Total amount of dirty water accumulated throughout the hour. Dhtot(t) = Dhinit(t) + Dhact(t). 10. (Hygiene) Treatment amount, Trth(t). The amount of clean water obtained from the treatment during the hour. This is also the amount of dirty water reduced due to the treatment. This quantity is affected by: 1. Treatment Efficiency, Theff; 2. Stochastic of Treatment Efficiency, !(Theff); and 3. Stochastic property of hygiene treatment efficiency. A uniform distribution of 10% of the Theff value is used. Trth(t) is formulated as follows: If Dhtot(t) is less than Thcap, all the dirty water in the dirty-water tank is allowed to pass through the treatment tank. Otherwise, only the amount of water equal to Thcap is allowed to pass through the treatment tank. The amount of water treated is as follows: Trth(t) = min{ Dhtot(t) * Theff * (!(Theff) * "(t) * #(t)+1), Thcap * Theff * (!(Theff) * "(t) * #(t)+1)} Where " and # are as defined in #3 above 11. (Hygiene) Final dirty: The amount of dirty wa-
ter in the system after treatment. This quantity is also equal to the amount of dirty water at the beginning of the next hour. Dh(t+1) = Dhtot(t) - Trth(t) 12. (Hygiene) Final clean: The amount of clean water in the system after treatment. This quantity is also equal to the amount of clean water at the beginning of the next hour. CLh(t+1) = CLhaft(t) + Trth(t) 13. (Hygiene) Clean overflow, CLhovf(t): The amount of clean water overflowed due to exceeding tank capacity. CLhovf(t) = min{0, CLh(t) - CThcap} 2.2 Potable-Water Subsystem The physical components of the potable-water subsystem are similar to those described in 2.1 (Hygiene-Water Subsystem): Clean potable water tank, clean potable water overflow tank, potable treatment tank, dirty potable water tank, and dirty potable water overflow tank. The processes and components involved in the potable-water subsystem are also very similar to the hygiene-water subsystem except for the following: 1. Stochastic property, !(Dpact), is introduced in the actual amount of dirty potable water produced. Unlike hygiene water, potable water goes through the human body. As a result, there is variability regarding the actual amount of dirty water produced in this subsystem. 2. An additional parameter, the Human Tank, HTp(t), is introduced to capture the total amount of water in the human body by taking into consideration the amount of clean water consumed as well as the amount of dirty water produced: HTp(t) = HTp(t - 1) + Cpact(t - 1) - Dpact(t - 1) 3. Actual amount of dirty water produced from potable water, Dpact(t): It is assumed that all the clean water consumed during the hour passes through the human body and becomes dirty wa-
POLICIES FOR A WATER-TREATMENT SYSTEM - MATHEMATICAL FORMULATION
ter produced during the same hour. The following formulation ensures that the stochastic process of dirty-water production does not cause more dirty water produced than the theoretical value. This follows the assumption of conservation of water that the total amount of water in the system remains constant throughout the simulation. i. When Cpth(t) is zero, water is consumed due to deficiency from the previous hour. Since it is assumed that all the clean water consumed during the hour becomes dirty water during the same hour, Dpact(t) is the sum of Cpact(t) and Ppth(t), uniformly distributed between 20% of the value of (Cpact(t) + Ppth(t)): Dpact(t) = min{(Ppth(t) + Cpact(t)) * (1 + "(t) * #(t) * !(Dpact)), Ppth(t) + Cpact(t)} ii. When Cpth(t) ≠ 0, and if Cpact(t) < Cpth(t), deficiency results. It is assumed that Dpact(t) is proportionate to the actual amount of clean water consumed, and is uniformly distributed between 20% of the base value of Dpact(t) as shown below.
25
tem are provided in this paper. Input to the simulation program includes values from the BVAD as well as stochastic values in order to mimic the behavior of an actual system. These formulations are set up in such a way that conditions of the system can be easily assessed at the beginning of every hour to obtain an overview of system behavior on an hourly basis. These formulations not only serve as the foundation of this model, they also can be used as a reference to future models related to resource supply-demand in a closed-loop environment. A simulation program is built to simulate this model. This program and other methodologies are used to generate the “best” policy to be applied to the system at the beginning of every hour. These methodologies are discussed in the next paper of this study. Acknowledgements The authors of this paper would like to thank NASA ALS/NSORT for the grant (NAG5-12686) that makes this research project possible. Biographical Sketch
Dpact(t) = min{(Cpact(t)/Cpth(t)) * Ppth(t)) * (1 + "(t)*#(t) * !(Dpact), (Cpact(t)/Cpth(t)) * Ppth(t)) iii. When Cpact(t) > Cpth(t), some amount of water is used for scheduled activities and some other amount is used for compensating for deficiency from the previous hour. When Cpact(t) = Cpth(t), all water is used for scheduled activities. In both cases, Dpact(t) is a result of Cpact(t), Ppth(t) and Cpth(t), uniformly distributed between 20% of its base value. Dpact(t) = min{(Ppth(t) + Cpact(t) - Cpth(t)) * (1 + "(t) * #(t) * !(Dpact)), Ppth(t) + Cpact(t) - Cpth(t)} 4.
Conclusion
Formulations of physical processes involved in a simulation program of a function-driven water sys-
Tze Chao Chiam is currently a PhD student in the School of Industrial Engineering at Purdue University. He has been part of the NASA ALS/NSCORT community since August 2003. Dr. Yuehwern Yih is a Professor in the School of Industrial Engineering at Purdue University. Her areas of focus include design, mentorship, and control of complex systems, behavior-based dynamic control, machine learning and artificial intelligence, etc. She has been involved in the NASA ALS/NSCORT community since August 2002. Dr. Cary Mitchell is a Professor in the Department of Horticulture and Landscape Architecture and the Director of the ALS NSCORT at Purdue. He has worked in the areas of Controlled Environment Agriculture (CEA) and has been involved with NASA’s research in the areas of Space Biology and Advanced Life Support (ALS) since the beginnings of these programs.
26
CHIAM, YIH, AND MITCHELL
References 1.
2.
3.
4.
Ang. C. H. and Yih, Y. 2008. A Simulation Approach to Minimize Water Supply, Water Storage Capacity and Water Treatment Capacity Requirements in an Advanced Life Support System for Mars Missions. Habitation Journal. (Accepted) Ang, C. H. 2006. A Simulation Approach to Minimize Water Supply, Water Storage Capacity and Water Treatment Capacity Requirements in an Advanced Life Support System for Mars Missions. Master Thesis. Purdue University, West Lafayette, IN. Ang, C. H., Chiam. T. C. and Yih, Y. 2005. Impact on Crewmember Schedule on System Performance. 35th International Conference on Environmental Systems. July 2005. Rome, Italy. Chiam, T. C., Ang, C. H. and Yih, Y. 2006. Modeling the Impact of Water Systems Configuration on the Overall
5.
6.
7.
System Health of a Human Space Habitat. 36th International Conference on Environmental Systems. Norfolk, VA. July, 2006. Hanford, A. J. 2004. Advanced Life Support Baseline Values and Assumptions Document, JSC 47804 (CR-2004-208941), NASA Lyndon B. Johnson Space Center, Houston, Texas, August 2004. Sharvelle, S.A., Banks, M.K., McLamore, E., Kim, Y.S., and Clark, S. 2005. Evaluation of Biological Trickling Filter Performance for Graywater Treatment in ALS Systems. 35th International Conference on Environmental Systems. Rome, Italy. July 2005. Sharvelle, S., Banks, M.K., and Heber, A.J. 2003. Wastestream Characterization for a Packed Bed Biofilter Intended for Simultaneous Treatment of Graywater and air in an Advanced Life Support System. 33rd International Conference on Environmental Systems. Vancouver, Canada. July, 2003.