Indian Journal of Engineering & Materials Sciences Vol. 20, August 2013, pp. 289-298
Mathematical modeling and prediction of the thrust force and torque in drilling of sisal/glass-vinyl ester hybrid composite using the RSM, MLPNN, RBFN and ENN methods S Velumania*, P Navaneethakrishnanb, S Jayabalc & D S Robinson Smartd a
Department of Mechanical Engineering, Velalar College of Engineering & Technology, Erode 638 012, India b
Department of Mechanical Engineering, Kongu Engineering College, Perundurai 638 052, India
c
Department of Mechanical Engineering, A.C. College of Engineering and Technology, Karaikudi 630 004, India d
Department of Mechanical Engineering, Karunya University, Coimbatore 641 114, India Received 5 July 2011; accepted 1 February 2013
Drilling a polymer composite material without defects is not an easy task; even so, these materials are largely used in aerospace and other industries, due to their excellent mechanical properties. Tool wear, delamination and fiber pull out are the major problems in drilling. Literature reveals that the thrust force (th) and torque (tq) have a significant effect on tool life and delamination. Therefore, to improve the performance of drilling, it is essential to study the thrust force and torque. This paper discusses the methodologies used in the prediction and evaluation of the thrust force and torque in the drilling of sisal and glass fiber reinforced vinyl ester resin hybrid composite materials. Experiments are conducted in the CNC machining center, and high speed steel (HSS) drill bits are used in the machining center for the drilling operations. Process parameters such as the drill diameter (d), spindle speed (s) and feed rate (f) are considered as the controlling factors for the study. The experimental data obtained are used for training and testing with RSM and ANN techniques such as MLPNN, RBFN and ENN. The predicted thrust force and torque, based on the MLPNN model, are found to be in very good agreement with the experimental values. Keywords: RSM, MLPNN, RBFN, ENN, Thrust force, Torque
In recent years, fiber-reinforced materials have revolutionized the making of high performance structures in aerospace, military and transportation industries, since they possess significant advantages in the strength to weight ratio, stiffness to weight, corrosion resistance, fatigue strength, thermal resistance, and damping properties1,2. The prediction of cutting forces in machining will be helpful to improve reliability, accuracy and productivity in conventional and CNC machining. Actually, it gives information about cutter deflection, machine tool chatter, tool wear, breakage and then tool life. The surface integrity can be improved by selecting the appropriate cutting conditions, tool path and tool geometry3. Drilling is a hole producing process, and is to be taken as one of the important machining processes, because it accounts for a major portion of the overall —————— *Corresponding author (E-mail:
[email protected])
machining operations. In addition, the drilling processes may result in the production of unnecessary waste, because many drilling operations are usually among the final steps in fabricating a part4. A finite element approach was used by Shatla and Altan5 to determine the drilling torque and thrust force. Chandramohan et al.6 predicted the thrust force and torque for sisal and roselle, sisal and banana, and roselle and banana fiber reinforced composites, using the regression model, and concluded that sisal and roselle (hybrid) is the best, as it can be used for internal fixations compared to other materials. Gaitonde et al.7 studied the effects of the process parameters on delamination during the high-speed drilling of carbon fiber reinforced plastic (CFRP) composites. Durao et al.8 investigated the thrust force and delamination in the composite material, when drilling holes with five different drill geometries. Singh et al.9 investigated the thrust force and torque developed during the drilling of glass fiber reinforced
290
INDIAN J. ENG. MATER. SCI., AUGUST 2013
plastics (GFRP) composites with L27 orthogonal array experiments. A fuzzy rule based model had been developed for the prediction of thrust force and torque in the drilling of GFRP composites9. Rubio et al.10 investigated the performance drilling of glass fiber reinforced plastics (GFRP) in high speed machining (HSM), and reported that HSM is suitable for drilling GFRP for low damage levels. Abrao et al.11 investigated the effect of the cutting tool geometry and material, on the thrust force and delamination produced, when drilling a glass fiber reinforced epoxy composite, and found that the damaged area increased considerably with the feed rate, and moderately with the cutting speed. Ramji et al.12 studied the thrust and torque of cryogenically treated and tempered carbide tipped drills at various levels of cutting speed, feed and tool conditions, and also reported that the cryogenically treated tools showed superior results in terms of reduced forces, tool wear and surface roughness of the drilled holes. Davim et al.13 investigated the delamination problems, and evaluated the cutting parameters (cutting velocity and feed) and the influence of the matrix under specific cutting force, delamination factors and surface roughness in two types of matrix (Viapal VUP 9731 and ATLAC 382-05). Davim14 has elaborately dealt with delamination, damage reduction in the drilling of composite materials, and the influence of the machining parameters on delamination. Ganesh Babu et al.15 studied the machining properties of composite material by measuring the cutting forces, and used response surface methodology for the optimization. Davim et al.16 studied a novel technique to measure the adjusted delamination factor Fda using the digital analysis. Jayabal and Natarajan17 investigated the drilling of coir-glass fiber reinforced composites with the HSS drill bit, to evaluate the thrust force and torque under different cutting conditions, by the Regression Analysis and Neuro Fuzzy methods, and observed that the Neuro Fuzzy model performed better than the Regression model. Zhang et al.18 presented a general closed-form mechanical model, for predicting the critical thrust force for the drilling of composite material. Shetty19 studied the Taguchi optimization methodology, and applied it to optimize the cutting parameters. Jayabal et al.20 investigated the drilling of composites and optimized the drilling parameters,
using the optimal settings of the Box-Behnken design, Nelder-Mead and genetic algorithm methods. Sait21 investigated the machining parameters on turning glass-fiber reinforced plastic (GFRP) pipes, and optimized the parameters using the desirability function analysis. Garg et al.22 studied the performance of back propagation neural networks (BPNN) and radial basis function networks (RBFN), in the prediction of the flank wear of high speed steel drill bits for drilling holes. Davim23 reported the fundamentals and recent advances in the machining of composite materials (polymers, metals and ceramics) for modern manufacturing engineering. The literature review reveals that the study of machinability behavior and tool condition monitoring are important areas of research, and already a lot of works have been published in either the response surface methodology (RSM) or artificial neural networks (ANN) techniques individually. In this paper, a comparative study of the performance of RSM, multi layer perceptron neural network (MLPNN), RBFN and Elman neural network (ENN) techniques has been made. The drilling parameters were selected at three levels (drill bit diameters of 6, 8 and 10 mm, spindle speeds of 600, 1200 and 1800 rpm and feed rates of 0.1, 0.2 and 0.3 mm/rev.), and the responses, i.e., the thrust force and torque were measured for each run, when the experiments were conducted. The assignment of levels to factors is given in Table 1. Experimental Procedure Materials and methods
In order to perform the experimental work, Chopped Sisal and E-Glass hybrid fiber reinforced vinyl ester resin composite laminates of size 180 mm × 160 mm with a thickness of 5 mm were produced by the cold process method. The DMA, cobalt octovate and MEKP were mixed with the vinyl ester resin, to initiate, accelerate and maintain the chemical reaction. Straight shank HSS twist drills of 6, 8 and 10 mm were used for this drilling investigation. Table 1 – Factors and their levels Factors/Levels
Unit
Low
Middle
High
Drill bit diameter Spindle speed Feed rate
mm rpm mm/rev
6 600 0.1
8 1200 0.2
10 1800 0.3
VELUMANI et al.: DRILLING OF SISAL/GLASS-VINYL ESTER HYBRID COMPOSITE
Experimental set-up
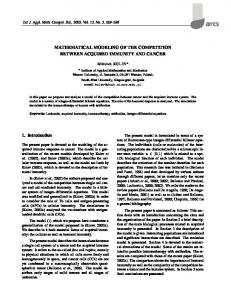
The experiments were carried out in the three axes CNC Vertical Milling Machine (make: MTAB MAX MILL, motor capacity: 3.7 kW and max. tool diameter: 60 mm), using HSS twist drills. The thrust force and torque were measured with a 3-axes piezoelectric dynamometer (Kistler 9257B). It has a measuring range of 0-5 kN. The dynamometer was connected to a multi channel charge amplifier, and a personal computer was also connected, for data acquisition and processing. All the experiments were performed under dry drilling conditions. The drilling set up is shown in Fig. 1. The work pieces were prepared by cutting the fabricated composite sheet into smaller sizes of 100 mm × 50 mm for holding it conveniently in the machine. Drilling tests were planned to be conducted at the CNC Machining center in the speed range of 600-1800 rpm, and the work piece was held tightly in the vice which was placed over the Kistler dynamometer. A straight shank drill was fixed in the chuck. Before carrying out the experiments, wiring connections between the dynamometer, the amplifier and the personnel computer (PC), and power connections to these instruments were established. With the design of experiments, runs were planned for three factors, each at three levels, as given in Table 2. With CNC programming, the spindle speeds and feed rates for the 27 runs were obtained. The measured thrust force and torque data are given in Table 2. Response Surface Methodology (RSM) Response surface methodology (RSM) is a collection of mathematical and statistical techniques
Fig. 1 – Photographic image of CNC marching center with drilling attachments
291
that are useful for empirical model building and analyzing problems. The RSM technique was introduced by Box et al.24; the main objective was to optimize and predict the response surface (dependent variable), which is influenced by several independent variables (input variables). The first step in RSM is to find a suitable approximation to the true relationship. The most common forms are the lower order polynomials (first or second-order). k
Y = β0 +
∑ i =1
k
βi xi +
∑
k
βii xi2 +
i =1
k
∑∑ i =1
βil xi x j + ε
… (1)
j =1
where, Y is the response or output, k is the number of the factors, i and j are the index numbers for the factor, β0 is the free or offset term called intercept term, x1, x2,.. xk are the independent variables, βi is the first-order main effect, βii is the second order (quadratic) effect, βij is the interaction effect, and ε is the error or uncertainty between the predicted and the Table 2 – Experimental values Test Drill bit dia Spindle speed Feed rate Exp thrust Exp torque mm rpm mm/rev N N-cm No. 1 2 3 4 5 6 7 8 9 10 11 12 13 14 15 16 17 18 19 20 21 22 23 24 25 26 27
6 6 6 6 6 6 6 6 6 8 8 8 8 8 8 8 8 8 10 10 10 10 10 10 10 10 10
600 600 600 1200 1200 1200 1800 1800 1800 600 600 600 1200 1200 1200 1800 1800 1800 600 600 600 1200 1200 1200 1800 1800 1800
0.1 0.2 0.3 0.1 0.2 0.3 0.1 0.2 0.3 0.1 0.2 0.3 0.1 0.2 0.3 0.1 0.2 0.3 0.1 0.2 0.3 0.1 0.2 0.3 0.1 0.2 0.3
28 47 88 30 54 83 32 52 85 41 71 104 44 83 99 47 79 101 72 82 101 72 86 109 74 84 116
0.95 2.4 3.4 0.99 2.4 3.2 1.3 2.1 3.1 1.6 3.6 4.4 1.7 3.9 5.2 1.9 3 4.8 2.1 4 5.1 2.3 3.4 5.7 2.5 3.7 6.2
292
INDIAN J. ENG. MATER. SCI., AUGUST 2013
measured values. The RSM predicted thrust force and torque values are shown in Figs 2 and 3, respectively. The RSM surface plot of the thrust force between ds , df and sf are shown in Figs 4 , 5 and 6, respectively. Similarly, The RSM surface plot of the torque between ds, df and sf are shown in Figs 7, 8 and 9 respectively. The data for the internal architecture of the response surface model were obtained from the experimental tests. After training the database, a model was created using the regression method. To check the performance of the developed model, a validation test comprising experiments under different cutting conditions was planned. The developed RSM model was utilized to predict the responses for the given inputs, which are shown in Tables 3 and 4 for the thrust force and torque respectively.
Fig. 2 – Measured and RSM predicted thrust force values
Fig. 3 – Measured and RSM predicted torque values
Fig. 4 – RSM surface plot of th between d and s
Fig. 5 – RSM surface plot of th between d and f
Fig. 6 – RSM surface plot of th between s and f
VELUMANI et al.: DRILLING OF SISAL/GLASS-VINYL ESTER HYBRID COMPOSITE
293
Table 3 – The thrust force values (N) predicted by RSM, MLPNN, RBFN and ENN
Fig. 7 – RSM surface plot of tq between d and s
Fig. 8 – RSM surface plot of tq between d and f
Fig. 9 – RSM surface plot of tq between s and f
Test No.
Exp. values
th RSM
th MLPNN
th RBFN
th ENN
1 2 3 4 5 6 7 8 9 10 11 12 13 14 15 16 17 18 19 20 21 22 23 24 25 26 27
28 47 88 30 54 83 32 52 85 41 71 104 44 83 99 47 79 101 72 82 101 72 86 109 74 84 116
25.46 55.32 85.19 26.63 56.24 85.85 27.8 57.16 86.52 45.71 70.74 95.77 47.96 72.74 97.52 50.21 74.74 99.27 65.96 86.16 106.35 69.3 89.24 109.19 72.63 92.32 112.02
29.8 48.47 86.36 29.14 51.19 84.87 29.34 55.2 83.25 42.18 72.97 103.29 43.88 77.87 103.29 45.15 80.99 101.8 71.4 80.96 103.71 73.6 84.79 107.1 73.66 87.82 108.76
29.2 48.24 88.42 30.43 50.18 88.17 32.26 51.45 86.09 42.83 70.76 99.56 45.85 75.46 100.45 49.13 78.39 100.29 69.86 86.21 101.6 70.23 91.04 104.33 71.41 94.61 106.19
30.87 47.15 86.72 31.39 50.41 86.58 33.21 49.9 83.78 41.81 73.42 101.47 46.39 77.56 102.6 49.26 80.04 104.4 67.65 85.5 102.58 70.63 88.49 105.3 71.34 90.12 107.29
Multi Layer Perceptron Neural Networks (MLPNN) Multilayer perceptron networks (MLP) is a feed forward artificial neural networks model that maps sets of input data onto a set of proper output. They have a highly interconnected structure, similar to the brain cells of human neural networks, and consist of a large number of simple processing elements called neurons, which are arranged in different layers in the network. MLPs are used with the supervised learning technique, and it lead to a successful back propagation algorithm. The MLPNN network diagram is shown in Fig. 10. The model has three types of layers an input layer, an output layer and one or more intermediary layers called the hidden layer(s). For the perceptrons in the input layer, linear transfer functions have been used, and for the perceptrons in the hidden layer, the output layer sigmoidal or squashed functions are used. The
INDIAN J. ENG. MATER. SCI., AUGUST 2013
294
Table 4 – The torque values (N-cm) predicted by RSM, MLPNN, RBFN and ENN Test No.
Exp. values
Tq RSM
Tq MLPNN
Tq RBFN
Tq ENN
1 2 3 4 5 6 7 8 9 10 11 12 13 14 15 16 17 18 19 20 21 22 23 24 25 26 27
0.95 2.4 3.4 0.99 2.42 3.2 1.3 2.1 3.1 1.6 3.6 4.4 1.7 3.9 5.16 1.9 3 4.8 2.1 4 5.1 2.3 3.4 5.7 2.5 3.7 6.2
1.25 2.37 3.48 1.18 2.3 3.43 1.1 2.24 3.38 1.67 3.09 4.5 1.72 3.15 4.57 1.76 3.2 4.64 2.09 3.81 5.53 2.25 3.99 5.72 2.42 4.17 5.91
1.08 2.54 3.14 1.04 2.38 3.2 1.02 2.13 3.28 1.73 3.85 4.66 1.71 3.48 4.77 1.73 3.09 5.01 2.18 3.85 5.24 2.24 3.6 5.59 2.45 3.75 5.95
1.51 2.49 3.24 1.44 2.23 3.22 1.38 2.02 3.07 1.85 3.46 4.73 1.84 3.38 5.01 1.79 3.18 5.08 2.11 3.78 5.15 2.19 3.9 5.53 2.22 3.9 5.71
1.08 2.29 3.44 1.11 2.35 3.19 1.14 2.33 3.08 1.8 3.65 4.68 1.61 3.51 4.81 1.57 3.36 4.86 1.88 3.8 5.47 2.27 3.9 5.59 2.52 3.8 5.53
input layers serve to distribute the values they receive to the next layer, and so on. In this supervised learning type, the input-output parameters are sequentially presented to the networks undergoing a training phase with error correction learning, which means that depending upon the deviation of the predicted output from the desired output; the various interconnections are adjusted using an average gradient information. Input of i th neuron in the hidden layer Iyi was calculated by n
I yi =
∑
f ( wxiyi xi + bxiyi )
… (2)
i =1
where n is the number of neurons in the input layer and wxiyi is numerical weight value of the connection between the input and the hidden layer neurons. The xi is the ith normalized output from the input layer. bxiyi is the bias value between the input and the hidden layer neurons. yi is the ith neuron in the hidden layer. wyizi is the weight between the ith neuron in the hidden layer and the output layer. byizi is the bias weight between the hidden and the output layer. zi is the output or response. f and g are the functions. The mathematical representation is expressed as n
zi =
∑ g (w
yizi I yi
+ byizi )
… (3)
i =1
The performance of the ANNs was statistically measured by the mean squared error (MSE) and obtained as follows: n
ErrSqd . =
∑(d − y ) i
2
i
… (4)
i =1
MSE =
1 n
n
∑(d − y ) i
i
2
… (5)
i =1
where di is the desired value and yi is the output value. MSE is the mean square error. The output values obtained from the MLPNN are given in Tables 3 and 4 for the thrust force and torque, respectively.
Fig. 10 – MLPNN networks diagram
Radial Basis Function Networks (RBFN) The radial basis function neural network is a multilayer feed-forward neural networks model. It was introduced by Moody and Darken25. The RBFN networks diagram is shown in Fig. 11. These networks are three layered or with many hidden layers
VELUMANI et al.: DRILLING OF SISAL/GLASS-VINYL ESTER HYBRID COMPOSITE
295
Fig. 11 – RBFN networks diagram
Fig. 12 – ENN networks diagram
between the input and the output layer, and each hidden unit implements a radial activation function, and each output unit implements a weighted sum of hidden units. It uses the Gaussian potential functions. The output values were obtained after processing in the RBFN engine, and the results are given in Tables 3 and 4 for the thrust force and torque, respectively.
where, Y is the response or yield with the function of diameter, speed and feed. The first order polynomial (linear) equation is used to represent the response surface with the interactions of three factors. The general linear equation with interactions is given by
Elman Neural Networks (ENN) Elman neural is one of the types of recurrent artificial neural networks, first employed by Elman26. The special type of networks diagram is shown in Fig. 12. These networks vary from the normal feed forward networks in the sense of loops in the network. It means that at any time there exists at least one feed back connection from the output of the hidden layer to the context units fixed with a weight of one. A three layer network is normally used, and the Elman network has sigmoid artificial neurons in its hidden layer, and linear artificial neurons in its output layer. Every time, the input is propagated in a standard feed forward fashion, and then a learning rule is applied. Thus, the network allows it to perform such tasks as sequence-prediction that is beyond the power of a standard multilayer perceptron. The processed output values are given in Tables 3 and 4 for the thrust force and torque, respectively. Development of Mathematical Model The response surface methodology expressed as: Y = f ( d , s, f ) + ε
can
be
… (6)
Y = β 0 + β1 x1 + β 2 x2 + β3 x3 + β12 x1 x2 + β13 x1 x3 +
β 23 x2 x3 + β123 x1 x2 x3
… (7)
where β0 is the free term of the regression equation, the coefficients β1, β2, β3 are the linear terms and β12, β13, β23 ,and β123 are the interaction terms. Mathematical model of thrust force
With the measured dependent variables from 27 runs, the corresponding independent variables were used, and a mathematical model (regression equation) was developed to represent the response surface Y. Here Y is replaced by the thrust force. th =-77.815 + 12 d-0.003 s + 446.1 f + 0.0009 d s 24.17 d f- 0.004 s f … (8) where, th is the process response or output (dependent variable) thrust force, d is the drill diameter, s is the spindle speed and f is the feed rate mm/rev. R2 is a statistic residue that will give information about the integrity of the fit of a model. R2 of 1.0 indicates that the regression line perfectly fits the data. R2 = 1 - (residual sum of squares (SS)/corrected SS) = 0.96 for this equation. A comparison chart of the RSM predicted and experimental values of the thrust force is shown in Fig. 2.
INDIAN J. ENG. MATER. SCI., AUGUST 2013
296 Mathematical model of torque
The mathematical relationship for correlating the response surface torque (tq) using the process variables (d, s and f) was obtained as: tq =0.249-0.0036 d -0.0007 s + 1.91 f + 0.0001 d s – 1.52 d f- 0.0002 s f … (9) R2 = 1 - (residual SS/corrected SS) and the value has been calculated as 0.95 for this equation. A comparison graph (Fig. 2) of the predicted and experimental values of torque is presented in the regression model. A comparison of the predicted and experimental values of the thrust force and torque for the drilling operation is given in Tables 3 and 4, respectively. The error (%) between the predicted and experimental values is calculated as follows % of error = ( Predicted value − Experimantal value) ×100 Experimental value
Results and Discussion Drilling operations were conducted over a wide range of cutting parameters on a sisal/E-glass-vinyl ester composite sheet. In this work, the diameter of the drill, the spindle speed and feed rate were varied equally in between their bounds. HSS drill bits of diameters 6, 8 and 10 mm were used for drilling holes on the composite. Three process parameters in 27 different combinations were taken up for measuring the thrust force and torque. The measured values were tabulated for different combinations of input parameters, and each run was denoted by a unique identification number. In general, the RSM plots (Figs 2-9) show the significance of each factor in finding its responses. The results in these figures indicate that, the thrust force and torque were increased with increasing feed. This was due to increasing the cross-sectional area of the un-deformed chip. Also, the thrust and torque were increased with an increase in the diameter of the drill. A larger thrust force occurs with larger diameter drills. When the speed increased, the thrust force and torque produced only minor variations. One of the facts for the non active nature was that the high speed, tool and composite material were heated up due to friction, and the property of both the materials was changed. In the RSM technique, the measured values were processed in the statistical software (Design Expert).
After training, the coefficient values of the regression equations were found, and the R2 value was obtained as 0.96 for the thrust force. 0.96 is the value of the relative deviation of the RSM predicted value to the measured value. Based on the R2 value and F value, the order of the polynomial regression equation was decided, and in this case, the linear equation with 2FI was selected. The effect of the parameters to the responses is shown in Figs 4-6 for the thrust force. The graph plot between the predicted values and the measured values of the thrust force is shown in Fig. 2, which clearly reveals that minor deviations exist in the thrust values corresponding to the input values when compared with the measured values and later this deviation was used for calculating error percentages. Similarly, for the torque R2 value was calculated as 0.95, and based on the R2 and F values, the linear equation with 2FI was chosen, since the 2FI equation has given a better fit with the measured values. The effect of the input variables on the response is shown in Figs 7-9 for the thrust force. The graph plot between the predicted value of torque and the measured values is shown in Fig. 3, which clearly reveals that the torque value calculated by the RSM is very close to the measured values. The learning practice of the MLPNN is an iterative procedure, and the entire training set is presented to the neural networks and trained repeatedly. Among the 27 runs conducted, 21 responses were taken randomly and assigned as training data, and the remaining data were utilized for testing in the MLPNN and the number of epochs was set at the maximum of 1000, so as to compare the performance of the other ANN networks at this value. After trial and error, the number of neurons in the hidden layer was set as 8, the initial weighting as 0.5, the momentum constant at 0.6, and the learning rate as 0.4. Under these conditions, the network was run to calculate the MSE. The RBFN for the sisal glass hybrid composite was trained with the same number of nodes as that in the MLPNN, viz., 8 nodes in the first hidden layer. The same value of the learning rate and the momentum coefficient were taken. The predicted results for the thrust force and torque have been given in Tables 3 and 4, respectively. The ENN was trained with 8 nodes in the hidden layer. The learning rate values and the momentum coefficients were taken as 0.4 and 0.6 respectively.
VELUMANI et al.: DRILLING OF SISAL/GLASS-VINYL ESTER HYBRID COMPOSITE
Table 5 – Cutting conditions in confirmation tests Test No.
D (mm)
S (rev/min)
F (mm)
1 2 3 4 5 6 7 8
7 7 9 9 7 7 9 9
900 1500 800 1400 700 1700 1000 1100
0.1 0.3 0.2 0.2 0.3 0.1 0.1 0.3
Table 6 – Confirmation of experimental values and comparison with RSM, MLPNN, RBFN and ENN for thrust force (th) Test No.
Exp.
1 35 2 97 3 81 4 84 5 97 6 35 7 60 8 105 Av. abs. Error%
RSM
MLPNN
RBFN
ENN
36.44 92.29 79.3 81.84 90.68 38.72 57.7 102.97 4.57
32.94 95.85 79.71 83.55 98.65 33.16 60.35 106.04 2.22
34.53 95.5 81.59 86.39 95.48 38.57 57.53 102.8 3.05
37.59 94.39 84.15 89.22 94.83 40.93 53.96 102.37 6.49
The predicted results for the thrust force and torque have been given in Tables 3 and 4, respectively. Tables 3 and 4 indicate the values obtained from RSM, MLPNN, RBFN and ENN and it was found that the deviation was less than 8% in the RSM. The comparisons of the prediction by the RSM and experimental thrust force and torque are shown in Figs 2 and 3, respectively. On the other hand, Tables 3 and 4 show the values of the thrust force and torque obtained in the use of MLPNN, RBFN and ENN which are below 7% and 8%, respectively. From, Tables 3 and 4, the MLPNN is found to be more precise than the RSM. Confirmation tests
The cutting conditions randomly selected between the lower and upper bounds of parameters, and used in the confirmation tests are shown in Table 5. Experiments were conducted at the newly fixed parameter settings, and the measured values and the values calculated by the prediction models are given in Tables 6 and 7 for the thrust and torque, respectively. Table 6 shows the thrust force values predicted by RSM 4.57% Av.abs. error for the set of experiments when compared with experimental values. MLPNN,
297
Table 7 – Confirmation of experimental values and comparison with RSM, MLPNN, RBFN and ENN for torque (tq) Test No.
Expt.
RSM
MLPNN
RBFN
ENN
1 1.4 2 4.6 3 3.9 4 3.7 5 4.2 6 1.3 7 2 8 5.1 Av. abs. Error%
1.45 4.01 3.49 3.61 3.99 1.44 1.95 5.12 6.03
1.32 4.21 3.82 3.59 4.09 1.3 2.02 5.13 2.94
1.66 4.27 3.73 3.74 4.15 1.58 2.03 5.35 7.52
1.26 4.32 3.3 3.43 4.28 1.23 1.84 5.35 7.35
RBFN and ENN showed error values of 2.22%, 3.05% and 6.49%, respectively. Table 7 shows the torque values predicted by RSM 6.03% Av.abs. error for the set of experiments when compared with experimental values. MLPNN, RBFN and ENN showed error values of 2.94%, 7.52%and 7.35%, respectively. Conclusions An experimental approach for the evaluation of the thrust force and torque during the drilling the Sisal/E-glass-vinyl ester composite laminate was studied. Mathematical models for thrust force and torque were developed. Three process parameters, such as the drill diameter, speed and feed were considered for the model development. A study has been carried out to assess the comparative performances of four important techniques, namely, RSM, MLPNN, RBFN and ENN in the prediction of the responses, such as the thrust force and torque for the drilling operation of sisal glass hybrid vinyl ester resin composites. 27 runs of the experiment had been planned to generate the data for the training and testing of the neural networks technique. It was observed from Tables 6 and 7 that the conventional technique of RSM gives an average absolute error (4.57% for thrust force and 6.03% for torque). It is comparable with the error percentage of ANN techniques, such as MLPNN, RBFN and ENN, and also with in the ±5% limits. When the MLPNN, RBFN and ENN techniques are compared, both ENN and RBFN were found to give less accuracy than MLPNN in predicting the thrust force (6.49% and 3.05% for ENN and RBFN respectively) and torque (7.35% and 7.52% for ENN and RBFN respectively). The MLPNN technique is one of the very simple algorithms, and had given better results than all other
INDIAN J. ENG. MATER. SCI., AUGUST 2013
298
techniques taken here for comparison. It gives an error of 2.22% in predicting the thrust force and 2.94% in predicting the torque. Nomenclature MLPNN = multi level perceptron neural networks ANN = artificial neural networks RBFN = radial basis function networks ENN = Elman neural networks RSM = response surface methodology CNC = computer numerical control DOE = design of experiments DMA = di-methyl aniline MEKP = methyl ethyl ketone peroxide HSS = high speed steel HSM = high speed machining MSE = mean square error ErrSqd = square of error PC = personnel computer GFRP = glass fiber reinforced plastics CFRP = carbon fiber reinforced plastics Av. abs. Error = average absolute error Exp. = experimental th = thrust force (N) tq = torque (N-cm) d = drill bit diameter (mm) s = spindle speed (rpm) f = feed rate (mm/rev.) ε= error
References 1 2 3 4 5
Tsao C C & Hocheng H, J Mater Process Technol, 192 (2007) 37-40. Tsao C C & Hocheng H, J Mater Process Technol, 203(1-3) (2008) 342-348. Fontaine M, Devillez A & Dudzinski D, in 12th IFToMM World Congress, Besanon (France) (2007). Strenkowski J S, Hsieh C C & Shih A J, Int J Mach Tools Manuf, 44 (2004) 1413-1421m. Shatla M & Altan T, J Mater Process Technol, 98 (2000) 125-133.
6 7
8
9 10 11 12 13 14 15 16 17 18 19 20 21 22 23 24 25 26
Chandramohan R, Marimuthu & Ravikumar, Technol Today, 4 (2010) 5-20. Gaitonde V N, Karnik S R, Rubio J C, Correia A, Abrão A M & Davim J P, J Mater Process Technol, 203 (2008) 431-438. Durao L M P, Gonccalves D J S, da Silva Tavares J M R, de Albuquerque V H C & Marques A T, in COMATCOMP 2009-V Int Conf Science & Technology of Composite Materials, 2009. Singh R V S, Latha B & Senthilkumar V S, Int J Rec Trends Eng, 5 (2009) 66-70. Campos Rubio J, Abrao A M, Faria P E, Correia A & Davim J P, Int J Mach Tools Manuf, 48 (2008) 715-720. Abrao A M, Rubio J C, Faria P E & Davim J P, Mater Des, 29 (2008) 508-513. Ramji B, Murthy H & Krishna M, Int J Appl Eng Res, 1 (2010) 553-560. Davim J Paulo, Reis P & Conceição António C, J Mater Process Technol, 155 (2004) 1828-1833. Davim J P, Drilling of composite materials (Nova Science Pub Inc.), 2009. Babu G, Selladurai V & Shanmugam R, Arpn J Eng Appl Sci, 3 (2008) xx-xx. Davim J P, Rubio J C & Abrao A M, Comput Sci Technol, 67 (2007) 1939-1945. Jayabal S & Natarajan U, J Sci Ind Res, 69 (2010) 741-745. Zhang L B, Wang L J & Liu X Y, J Eng Manuf, 215 (2001) 135-146. Shetty R, Pai R B, Rao S S & Nayak R, J Braz Soc Mech Sci Eng, 31 (2009) 12-20. Jayabal S & Natarajan U, Int J Adv Manuf Technol, 51 (2010) 371-381. Naveen Sait A, Aravindan S & Noorul Haq A, Int J Adv Manuf Technol, 43 (2009) 581-589. Saurabh Garg, Surjya K Pal & Debabrata Chakraborty , Neural Comput Appl, 16 (2007) 407-417. Paulo D J, Machining composites materials, (John Wiley & Sons), 2009. Box G E P & Wilson K B, J Roy Stat Soc, 13 (1951) 1-45. Moody J & Darken C J, Neural Comput, 1 (1989) 281-294. Elman J L, Cogn Sci, 14 (1990) 179-211.