N/A), or over-expressed (denoted by 0 or 999), or quantifiable (represented as an expression ratio). If both PIMSs of the (L,H)-paired ions are unacceptable, ...
TR-IIS-08-004
MaXIC-Q: A Fully Automated Generic Tool Using Statistical and Computational Methods for Protein Quantitation Based on Stable Isotope Labeling and LC-MS Ethan Yin-Hao Tsui, Yi-Hwa Yian, Chih-Chiang Tsou, Paul Chuan-Yih Yu, Yi-Ju Chen, Ke-Shiuan Lynn, Wen-Chi Chou, Yu-Ju Chen, Ting-Yi Sung, and Wen-Lian Hsu
Apr. 9, 2008
||
Technical Report No. TR-IIS-08-004
http://www.iis.sinica.edu.tw/page/library/LIB/TechReport/tr2008/tr08.html
MaXIC-Q: A Fully Automated Generic Tool Using Statistical and Computational Methods for Protein Quantitation Based on Stable Isotope Labeling and LC-MS Ethan Yin-Hao Tsui1, Yi-Hwa Yian1, Chih-Chiang Tsou1, Paul Chuan-Yih Yu1, Yi-Ju Chen2, Ke-Shiuan Lynn1, Wen-Chi Chou1, Yu-Ju Chen2, Ting-Yi Sung1*, and Wen-Lian Hsu1* 1
Institute of Information Science, Academia Sinica, Taipei 11529, Taiwan.
2
Institute of Chemistry, Academia Sinica, Taipei 11529, Taiwan.
Running title: Generic tool for quantitation using stable isotope labeling
* Corresponding authors: Ting-Yi Sung, Wen-Lian Hsu Institute of Information Science, Academia Sinica, Taipei 11529, Taiwan Phone: 886-2-2788-3799 ext {1711, 1804}; Fax: 886-2-2782-4814 E-mail: {tsung, hsu}@iis.sinica.edu.tw
Abbreviations: 2-DE, two-dimensional gel electrophoresis 2D LC-MS/MS, two-dimensional liquid chromatography- tandem mass spectrometry cICAT, cleavable isotope-coded affinity tag CS, charge state Cys, Cysteine DMEM, Dulbecco’s Modified Eagle’s Medium EBI, European Bioinformatics Institute GOF, goodness-of-fit ICPL, isotope coded protein labels IP, isotope pattern IPI, International Protein Sequence LC-MS/MS, liquid chromatography-tandem mass spectrometry PIMS, projected ion mass spectrum S/N, signal-to-noise SILAC, stable isotope labeling with amino acids in cell culture SPC, Seattle Proteomic Center SSR, sum of squared residuals TPP, Trans-Proteomic Pipeline XIC, extracted ion chromatogram
2
SUMMARY Isotope labeling combined with LC-MS/MS provided a robust platform for analyzing differential protein expression in proteomics experiments. Many software tools have been developed to support quantitation analysis of large-scale mass spectral data. However, a tool that can accept input data in versatile formats, produce highly-accurate analysis results quickly, and present the results comprehensively is still lacking. In this paper, we present such an automated tool, called MaXIC-Q, for quantitation analysis of large-scale datasets generated in high-throughput proteomics experiments. It is designed as a generic tool that is suitable for quantitation using many differential isotope-labeling techniques, e.g., SILAC, ICAT and ICPL labelings, and user-developed labeling methods. The tool can also accommodate search results from SEQUEST and Mascot, as well as mzXML files converted from raw files produced by various mass spectrometers. MaXIC-Q contains a filtering module that allows users to filter out low-confidence search results. Statistical and computational methods are applied to construct two kinds of elution profiles for each ion, namely, PIMS (projected ion mass spectrum) and XIC (extracted ion chromatogram); the latter is used to quantify the ion ratio. To ensure that the data used for quantitation analysis is of high quality, MaXIC-Q defines validation criteria for PIMSs so that ions interfered with by co-eluting peptides or noise can be detected. The performance of MaXIC-Q was evaluated on two datasets generated from a mixture of nine standard proteins and a large-scale experiment on endothelial cells using cICAT. MaXIC-Q’s processing speed on the large-scale dataset is ten times faster than existing tools. Moreover, it can generate promising quantitation results, so manual validation efforts can be substantially reduced. MaXIC-Q also provides powerful visualization tools and comprehensive
3
reports in various formats. In summary, MaXIC-Q is a user-friendly, interactive, robust, generic tool for quantitation based on various stable isotope labeling techniques. MaXIC-Q can be downloaded from http://ms.iis.sinica.edu.tw/MaXIC-Q/.
4
INTRODUCTION In the post-genomic era, protein separation techniques, such as two-dimensional gel electrophoresis (2-DE) or liquid chromatography (LC), combined with mass spectrometry (MS) (1, 2) have opened up a new dimension in proteomics research. As a result, large numbers of proteins in a biological system or cells can now be identified. Compared with 2-DE, shotgun proteomics based on two-dimensional liquid chromatography-tandem mass spectrometry (2D LC-MS/MS) analysis is a large-scale, robust, and sensitive technology for protein profiling (3, 4). Recent advances in incorporating isotopic labeling strategies into MS-based proteomics have further facilitated quantitation studies of differently expressed levels of proteins in complex biological samples (5). Isotope labeling combined with shotgun profiling is one of the most widely adopted quantitative proteomic strategies. In these studies, experimental samples are separately labeled with isotopically distinct reagents (6). The labeled proteins are then digested, mixed, fractionationed, and subjected to LC-MS/MS. In contrast to protein identification by MS/MS data, protein quantitation based on MS signals falls into two categories: one determined by MS/MS data, and the other by MS survey data and corresponding extracted ion chromatograms (XICs). The quantitation results reveal differentially expressed proteins that are associated with disease progression, the translational effects of regulating cellular activities and functions, or responses to biological stimuli. A typical example of MS/MS-based quantitation is iTRAQ-labeling (7, 8, 9), which is based on a set of four isobaric reagents, each of which comprises three groups: reporter, balance, and reactive groups. After cell lysis and protein digestion, the peptides in four states are separately labeled on N-terminals and lysine residues by the reactive group of iTRAQ. The four versions of isotopic iTRAQ-labeled peptides generate reporter groups with signature ions at m/z
5
114, 115, 116, and 117 in an MS/MS spectrum. In addition to identifying proteins, the intensities of the four MS/MS signature ions represent the quantity of the corresponding peptide and are used for quantitation of protein expression levels. To compensate for the deficiencies of existing tools, such as ProQUANT (Applied Biosystems) and i-TRACKER (10) for iTRAQ-labeling quantitation, we recently presented an automated tool called, Multi-Q (11, 12), which is designed to accommodate various input data formats from different search engines and mass spectrometer manufacturers. To facilitate accurate quantitation, Multi-Q applies curve smoothing, background subtraction, and normalization of peptide ratios. Furthermore, Multi-Q only uses non-degenerate peptides with high identification confidence for protein ratio determination. Quantitation based on MS survey data can be divided into three major categories: chemical labeling, e.g., ICAT (13); enzymatic labeling, e.g.,
18
O-labeling (14); and metabolic
labeling, e.g., SILAC (15, 16, 17, 18). To calculate the relative peptide ratio, the corresponding XICs are constructed and the areas of the XICs are used to calculate peptide and protein ratios. However, compared to MS/MS quantitation based on signature ions, XIC has difficultly achieving systematic quantitation of complex peptide mixtures because problems, such as insufficient chromatographic separation and slow MS acquisition, usually complicate XIC construction and computation. Many tools have been developed for automatic quantitation analysis,
for
example,
XPRESS(19),
ASAPRatio
(20),
RelEx
(21),
MSQuant
(http://msquant.sourceforge.net/) and MFPaQ (22). The pioneering XPRESS tool utilizes signals of precursor ions to reconstruct XICs. ASAPRatio adopts several numerical and statistical methods, such as Savitzky-Golay smoothing filters (23) for smoothing XICs, Dixon’s test for detecting ratio outliers, and error analysis for assessing the quantitation results. In addition, ASAPRatio uses signal-to-noise (S/N) ratios to filter out unquantifiable XICs before ratio
6
determination. RelEx uses the least-squares regression technique to align paired XICs and determine quantifiable areas of the aligned XICs. The ion abundance ratio is determined by the regression slope, and the maximum correlation coefficient serves as a confidence measure of the quantitation results. MSQuant is another widely used quantitation tool. It is based on the Mascot search output and utilizes LC profiles to compute quantitation ratios. MFPaQ is also specifically designed for Mascot users and utilizes the parsed identification results to extract quantitation data. The program selects MS survey scans to construct the elution peaks of each pair of ions, and the elution profile intensities are used to compute the corresponding ratio. The above tools evaluate the validity of data for quantitation based on XICs, rather than MS survey spectral data, which is also an important indicator of data quality. However, in practical computations of MS survey spectral data from a complex peptide mixture, a pair of labeled peptides are often either co-eluted with other peptides or affected by noise. Thus, more attention should be paid to selecting appropriate signals for correct quantitation analysis. Sometimes, using constructed XICs alone is insufficient to ensure the validity of data for quantitation. Verification of MS survey spectral data, as well as confident identification, is often needed. Despite the advances brought by the above quantitation tools, extensive, time-consuming manual inspection is still necessary in most large-scale quantitative proteomics research projects. Automatic validation of mass spectral data used for quantitation is therefore imperative. A generic tool that can automatically process signals, remove noise, decide appropriate quantitation signals, and evaluate abundance ratios is urgently needed for high-throughput and accurate quantitation analysis. In this paper we present such an automated quantitation tool called MaXIC-Q, which utilizes XICs acquired from isotope labeling techniques for quantitation analysis. As a generic
7
computation platform for high-throughput quantitative proteomics, MaXIC-Q offers the following features: (1) It accepts the mzXML (24) spectral format, which can be converted from raw files of various mass spectrometers by existing tools, as well as search results from commonly used search engines, including Mascot and SEQUEST. (2) It allows user-defined isotope codes, which cover a very broad range of quantitation strategies for various in vivo and in vitro labeling techniques, and even user-developed labeling methods. To the best of our knowledge, MaXIC-Q is currently the only tool that defines stringent criteria for the validation of both XIC and mass spectra to achieve high accuracy in an unattended manner. Furthermore, MaXIC-Q provides graphic interfaces, Elution3D, an XIC viewer, and a PIMS viewer that allow flexible user-activated interactive modification based on simultaneous 3D visualization of the m/z, elution time and intensity. The performance of the tool was evaluated on two datasets generated from cICAT-labeling experiments. We first tested the platform with a model dataset of nine standard protein mixtures published by Moulder et al (25). To assess the quantitation accuracy, robustness and computation speed, we tested a large-scale dataset containing 60 SCX fractions from cICAT-labeled proteins of endothelial cells in response to nitric oxide stimulation. The computation results show that MaXIC-Q can efficiently generate accurate and reliable quantitation results. The false positive rate is substantially reduced; thus, conventional manual inspection efforts can be significantly reduced. MaXIC-Q is designed as a stand-alone program that
is
executable
on
the
Windows
platform.
http://ms.iis.sinica.edu.tw/MaXIC-Q/).
8
(It
can
be
downloaded
from
EXPERIMENTAL PROCEDURES Preparation of a mixture of standard proteins We used a mixture of nine standard proteins published by Moulder et al (25). Each protein was prepared at two concentration levels, which were labelled with a light and a heavy cICAT reagent, respectively. The expected protein ratios were determined by the assigned concentrations. The concentration levels from the nine proteins to be labeled with the same cICAT reagent were then mixed and labeled, resulting in two cICAT-labeled samples. The two samples were mixed, diluted, and digested with trypsin. Then, the digested peptides were analyzed by an LC-MS/MS system consisting of a nano-LC coupled with a QSTAR Pulsar ESI-hybrid quadrupole-TOF instrument. The AnalystQS program was used for data acquisition, and wiff files were created.
Preparation of the cICAT-labeled proteins in endothelial cells in response to nitric oxide stimulation (1) Cell culture and lysis EA.hy926 endothelial cells were cultured at 37°C, 5% CO2 in Dulbecco’s Modified Eagle’s Medium(DMEM) with low glucose (1000 mg/L) (HyClone, Logan, Utah, USA) supplemented with 10% heat-inactivated fetal bovine serum (FBS; GibcoBRL, Gaithersburg, MD, USA), and Antibiotic-Antimycotic (GibcoBRL) containing 100 U/ml of penicillin, 100 ȝg/ml streptomycin, and 0.25 ȝg/ml amphotericin B. The cells were treated with 1.2 mM of S-nitroso-N-acetyl-penicillamine (SNAP) with equal molar volumes of L-cysteine and incubated at 37°C for 24 hours. As a control group, we used cells treated with only L-cysteine for 24 hours. The cells in both groups were then harvested, centrifuged at 1000 x g for 1 min, and washed 3
9
times with ice-cold PBS. Total lysate was prepared by resuspending cells in a lysis buffer (50 mM Tris at pH 8.3, 0.1% (w/v) SDS, 0.02% (w/v) Triton X-100) and lysed with sonication. Cellular debris was removed by centrifugation at 16000 x g at 4°C for 15 min. Protein concentration was determined by BCA assay (Pierce) and adjusted to approximately 2 mg/mL. (2) Quantitative protein profiling by 2D LC-MS/MS Approximately 500 ȝg of total proteins extracted from NO-treated and non-treated endothelial cells were labeled with light and heavy isotope-labeling cICAT, respectively. The cICAT labeling reaction was performed following the manufacturer's protocol (Applied Biosystems, Framingham, MA). The labeled samples were combined and subjected to trypsin digestion, after which the digested samples were further fractionated using a 2.1 x 200 mm polysulfoethyl A strong cation exchange (SCX) column (Poly LC, Columbia, MD). The cICAT-labeled peptides of SCX fractions were isolated by avidin-affinity chromatography. The 33 fractions were analyzed by ȝLC-MS/MS analysis with the HP 1100 solvent delivery system (Hewlett-Packard, Palo Alto, CA) and quadrupole/time-of-flight mass spectrometer (QSTAR Pulsar i, Applied Biosystems, Foster City, CA). Peptide fragmentation by collision-induced dissociation was performed in an automated fashion using the information-dependent option.
Data processing In the first step of quantitation analysis, wiff files were converted into mzXML files using the mzStar program (http://tools.proteomecenter.org/mzStar.php). TurboSEQUEST v.27-rev.12 was used to search the mzXML files in the following two experiments. The first experiment is a standard protein mixture experiment on the NCBI non redundant database (NCBInr, 04/2004; 1,677,308 sequences). The SEQUEST search parameters were set as follows: precursor ion mass
10
tolerance: 0.3 Da; fragment ion mass tolerance: 0.2 Da; up to ten missed trypsin cleavages; a variable modification of +227.13 on cysteine for the light ICAT reagent; a variable modification of +9 on cysteine for the heavy ICAT reagent; and a variable modification for oxidation of methionine; The second experiment is an endothelial cell experiment on the European Bioinformatics Institute (EBI) International Protein Sequence (IPI) HUMAN database version 3.24 (66,921 sequences). The SEQUEST search parameters were set as follows: precursor ion mass tolerance: 0.5 Da; fragment ion mass tolerance: 0.3 Da; up to two missed trypsin cleavages; a variable modification of +227.13 on cysteine for the light ICAT reagent; a variable modification of +9 on cysteine for the heavy ICAT reagent; and a variable modification for oxidation of methionine. The SEQUEST search results were subsequently processed by PeptideProphet (26) and ProteinProphet (27) in Trans-Proteomic Pipeline (TPP, v3.2, Institute for Systems Biology), to generate pepXML and protXML files, respectively. Peptides with a PeptideProphet probability score of less than 0.7 and proteins with a ProteinProphet probability score of less than 0.6 were filtered out. The protein cut-off threshold is determined by a false-positive rate ofʳ Љ 5% calculated by ProteinProphet. (In the standard protein mixture experiment, our filtering methods were different to those described by Moulder et al (25).) The validated identification results were input to various quantitation tools, e.g., XPRESS, ASAPRatio, and MaXIC-Q.
RESULTS Workflow of MaXIC-Q Toward automatic quantitation with minimum manual inspection, MaXIC-Q is equipped with modules for reconstruction of unbiased mass spectra and XICs, stringent spectra feature
11
validation, and accurate ion, peptide and protein level calculation. As shown in Figure 1, the workflow of MaXIC-Q for protein quantitation is comprised of five steps. After conversion of the MS data and the search results into common formats, only unique, labeled and confidently identified peptides are input for subsequent analysis. In the ion level processing step, MS survey spectra are processed and used to construct XICs for filtered peptides. Compared with other quantitation tools, we specically construct a projected ion mass spectrum (PIMS) based on projection of indivial ion mass spectra from the temporal elution domain, so that interfernces from co-eluting peptides or background can be visualized and excluded. In the following validation step, the PIMSs are further stringently validated based on the signal-to-noise ratio, correct charge state, and isotope pattern to determine whether the corresponding peptides exist without interference from noise or co-eluting peptides. The purpose is to ensure the corresponding XICs are valid for accurate ion ratio determinination. Finally, the ion and peptide ratios are calculated; the ratios of non-degenerate peptides are normalized to eliminate systematic errors. The protein ratio is calculated based on the normalized peptide ratios. The steps are described in detail below. Step 1: Input data preparation and filtering To accommodate spectral data files generated by different mass spectrometers, MaXIC-Q adopts the generic mzXML format, a standard format developed by SPC, for data input. As shown in Figure 2, spectral data files from the major MS manufacturers are converted into the mzXML format by existing tools, such as mzStar for .wiff files from Applied Biosystems, ReAdW (http://tools.proteomecenter.org/ReAdW.php) for .raw files from Thermal Finnigan, and MassWolf (http://tools.proteomecenter.org/MassWolf.php) for .raw directories from Waters. The converted mzXML format incorporates all the necessary attributes, including MS and MS/MS
12
peak lists and the scan number index for subsequent quantitation. For input of search results, MaXIC-Q accepts search result files from the most commonly used database search engines, Mascot and SEQUEST. SEQUEST users can input pepXML and protXML files generated by PeptideProphet and ProteinProphet, respectively. For Mascot users, MaXIC-Q accepts the CSV and XML formats exported directly from the Mascot web interface. The .wiff file needs an additional mapping file (.table file) containing the scan number information in the mzXML format. MaXIC-Q provides a program, wiff2scan, to generate this file. To ensure accurate quantitation from confidently assigned peptides, MaXIC-Q only select confident search results as input for quantitation (26, 27). To filter out low-confidence identification hits from SEQUEST, statistical validation by PeptideProphet and ProteinProphet is usually used to evaluate the confidence of identified peptides and proteins. For Mascot users, MaXIC-Q uses Mascot output identification scores, based on “Standard scoring” or “MudPIT scoring”, as a filtering criterion. Alternatively, MaXIC-Q allows users to input their empirically defined thresholds to filter SEQUEST or Mascot search results. Step 2: Ion level processing After the data preparation and filtering step, MaXIC-Q constructs PIMSs (step 2.1) for isotope-labeled, confidently identified peptides and reconstructs the corresponding XIC from the elution profiles (step 2.2). Constructing ion mass spectra is typically performed by single MS scan at given elution time when the peptide ion is identified. However, the presence of other peptides and noises may co-elute during the elution period of the peptide ion and thus cause quantitation errors. Instetad, we construct a PIMS that covers MS scan data in a range of the elution time of the identified peptide. The purpose is to evaluate whether the given peptide ion has the correct mass spectrum for quantitation. Furthermore, in the presence of background or
13
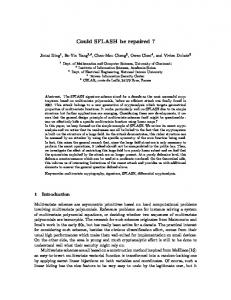
co-eluting peptides, proper selection of refined peak area from the PIMSs (step 2.3) can avoid above-mentioned interferences. (2.1) Constructing the PIMS Figure 3(A) shows the construction concept of a PIMS. MaXIC-Q retrieves every MS survey scan within 120 seconds of the elution time of the identified peptide ion. For each retrieved MS scan, all peaks located in the m/z range of the predicted ion isotope distribution, which can be automatically inferred from the identified sequence and its charge state, are extracted and projected to form the PIMS. The seven-point Savitzky-Golay smoothing algorithm is then applied to the PIMS to remove noise. Next, MaXIC-Q performs peak detection and then background subtraction on the smoothed spectrum. For background subtraction, the spectrum baseline, defined as the median of all peak intensities outside peaks, is removed from the smoothed spectrum. The PIMS will be further stringently evaluated for quantitation validity check in Step 3. (2.2) Reconstructing the extracted ion chromatogram (XIC) To reconstruct an XIC from the PIMS, we first determine the m/z range of the precursor ion in the PIMS. If the peak containing the precursor ion in the PIMS has a good signal-to-noise ratio (default: S/NЊ2.5), we use the width (m/z) of the peak to reconstruct the XIC; otherwise, the m/z range of the precursor within a predefined window (user-defined, default setting: r 0.5 m/z) is selected. It is noted that the selection of m/z window and elution time ranges depends on the LC and MS performance of different instrumnents. A raw XIC is constructed by summing all ion intensities after subtracting background in each MS scan within the selected m/z range and over the retention time of the peptide ion. Then the smoothed XIC is obtained by the B-spline smoothing algorithm (28), which has been widely used to fit a free-form curve in digital signal
14
processing and microarray analysis. (2.3) Evaluating the XICs of (L,H)-paired ions to reconstruct a refined XIC For complex analysis in the proteome scale, accurate quantitaiton for co-eluting peptides presents a great challenge. To ensure complete elution profile of individual peptide ion, XICs are constructed based on MS survey scans within 120 seconds (default value). The scan range is so broad that interfering intensities (e.g., co-eluting peptides) may be included in the analysis. To resolve this problem, MaXIC-Q automatically reconstructs XICs based on a refined scan range, i.e., overlapping peak area for both (L,H)-paired ions that is free of colution/background interfernce. To reconstruct (L,H)-paired refined XICs, after constructing the pair of primitive XICs, MaXIC-Q aligns the corresponding elution peaks by their highest points and extracts the scan range of the overlapping areas of the aligned peaks. By selection of overlapping peak areas for quantitation, over- or under-estimation on calculation of the ion ratio due to co-elution can be greatly reduced. Step 3: PIMS Validation Though quantitation is based on the area of XICs, the quality of PIMS critically affects the quantitation accuracy. In practice, noise or co-eluting ions usually cause either under- or over-estimated XICs and lead to erroneous quantitation results; however, it is difficult to identify such XICs by existing XIC-based methods. As shown in the validation procedure (Figure 4), MaXIC-Q adopts three criteria, the signal-to-noise ratio, the charge state, and the isotope pattern, to check the validity of PIMSs and determine whether the corresponding paired ions are quantifiable. MaXIC-Q first evaluates whether a PIMS is acceptable in terms of the signal-to-noise ratio
15
criterion (denoted by S/N in Figure 4A). The procedure checks whether there exists a valid peak, i.e., a peak with an S/N Њ 2.5, nearby the precursor m/z. If the spectrum fails this criterion, it is noisy or the peptide ion expression is low and the validation procedure stops. Note that, for peak validation by S/N, the default threshold of 2.5 only applies to the first monoisotopic peak in the isotope cluster of the identified ion, and the S/N criterion for the subsequent two peaks is adjusted in proportion to their theoretical intensities. If all three isotopic peaks are valid, the validation procedure proceeds to the next two criteria, which are applied to all the three peaks. The Charge State (CS) criterion is used to check whether the m/z space between two adjacent peaks in the isotopic cluster is consistent with the charge state, e.g., 0.5 for a charge state of +2. Thus, the CS criterion validation step evaluates (1) whether the isotopic pattern matches the mass of the identified peptide; and (2) whether there is co-elution of other peptides that would interfere with quantitation. The Isotope Pattern (IP) criterion is also used to detect co-elution interference. We compare the normalized intensities of the experimental and theoretical isotopic clusters and calculate the correlation score of the two clusters. If the score is greater than a specified threshold (default: 0.218), the spectrum fails in terms of this criterion (Figure 4F). The default value is pre-determined by applying a data mining tool, called C5.0, to our cICAT-labeling datasets. The validity of the criteria for detecting occurrences of co-elution is discussed further in the section entitled “Large-scale Quantitation for Comparative study of NO-treated Endothelial Cells by the cICAT strategy and 2D LC-MS/MS”. Step 4: Calculating ion and peptide ratios A PIMS that passes the three criteria is considered acceptable and labeled “Accepted”. Based on the validation results, MaXIC-Q classifies the quantitation results as unquantifiable (denoted by
16
N/A), or over-expressed (denoted by 0 or 999), or quantifiable (represented as an expression ratio). If both PIMSs of the (L,H)-paired ions are unacceptable, MaXIC-Q reports that they are unquantifiable. If one PIMS fails the S/N criterion and the other is acceptable, the ion pair is quantified as over-expressed. If one PIMS passes the S/N criterion but fails the CS or IP criteria and the other is acceptable, the ion pair is deemed unquantifiable. If both PIMSs are acceptable, the ion pair is quantified as quantifiable and MaXIC-Q calculates the ion ratio using the overlapping areas of (L,H)-paired ions. For the calculation of peptide ratios, the ratio of a peptide is the weighted average of all corresponding quantifiable ion ratios, where the weight of an ion ratio is determined by its area. If a peptide contains no quantifiable ions, the peptide is deemed unquantifiable. If a peptide contains at least one ion with over-expressed ratio, the peptide will probably be of interest to the user. Thus, MaXIC-Q reports both the number of over-expressed ions and the number of quantifiable ions. Step 5: Calculating protein ratios. MaXIC-Q performs the Central Tendency Normalization (30) based on ratios of non-degenerate peptides only. After normalizing the peptide ratios, protein ratios are calculated based on the weighted average of all corresponding non-degenerate peptide ratios.
User Interfaces and Powerful Visualization Tools for XICs, PIMSs and Elution Profiles MaXIC-Q provides user-friendly interfaces to facilitate easy access to input configuration parameters, visualization of raw spectra, and interactive manual revision of the quantitation results, as shown in a screenshot of the program (Figure 5). Apart from stringent validation requirements, which ensure data quality and efficient computation of a large-scale dataset, functions that facilitate efficient data access as well as the
17
inspection of raw data and quantitation results are important features in MaXIC-Q. It provides three convenient viewers for XICs, PIMSs, and three-dimensional elution profiles, respectively, to facilitate visualization and manual inspection of raw spectra. As shown in Figure 6, the first two viewers allow 1) quick visualization of XICs and PIMSs; and 2) verification of the validation results on the PIMS, as shown in Figure 6B, where the red and blue words indicate pass and fail, respectively. More importantly, the interactive interfaces allow users to modify the m/z range and elution time range to obtain new quantitation results instantly. Another powerful visualization module, Elution3D, which can be easily accessed by clicking the button shown in Figure 5B, is designed to show a 3D view of spectral elution profiles. In the interface, the x-axis and y-axis represent the elution time and m/z of ions, respectively. The intensity of an ion is indicated by its color. The tool can be used to determine whether a specific ion co-elutes with other ions, and to manually validate whether the corresponding XIC can be used to quantify the ion. Figure 6C shows two examples of 3D elution profiles. Although the left panel in Figure 6C indicates a well resolved L/H peptide pair, interference from the co-eluting peptides can be differentiated by Elution3D (right panel).
Output Interface and Comprehensive HTML Result Export Module After quantitation, MaXIC-Q reports the quantitation results in a frame-based output interface. The interface contains three frames that list the results of proteins, peptides and ions, as shown in Figures 5(E)-(G), respectively. The peptide and protein results are presented in tabular format so that users can sort the results by column, and copy/paste them easily. An ion’s output includes the ratio as well as related quantitation information, including the PIMSs and XICs. MaXIC-Q also allows users to export quantitation results as Excel files or in HTML
18
format by using the result export module (Figure 5H). The module provides an interface that allows users to select export parameters, e.g., the protein or peptide ratio range, to report results of interest. Like other quantitation tools, exported Excel files contain both protein and peptide information. More notably, HTML files exported by MaXIC-Q are portable and can be executed in most popular browsers, including Internet Explorer and Mozilla FireFox. The portability provides flexibility and facilitates manual inspection. More importantly, the HTML file contains a comprehensive export report, as shown in Figure 7. In the file, a protein’s quantitation results are presented first, followed by its peptide and ion quantitation information. Proteins can also be sorted by their accession number, ratio, and protein identification score. Useful figures, including PIMSs, XICs and Elution3D views of ions, are also presented to provide simultaneous inspection of data and quantitation results.. Users can select their preferred layout style for convenient viewing. Moreover, up-regulated, down-regulated, and unchanged expression ratios are labeled by different colors.
Application of MaXIC-Q in the standard protein mixture experiment To demonstrate the performance of MaXIC-Q, we first tested the data set (Q-Star Q-TOF MS) published in Moulder et al (25). The data set was derived from a protein mixture consisting of nine standard proteins. A total of eight proteins and 224 peptides were identified. Although Cytochrome C was not identified by SEQUEST, the identification result is consistent with the original report. Applying PeptideProphet and ProteinProphet to the SEQUEST identification results, six proteins and 124 peptides passed the filtering thresholds. GAPDH and Ribonuclease A yielded probability scores lower than 0.6 and were not quantified by XPRESS, ASAPRatio and
19
MaXIC-Q based on our parameter settings. Comparison of the protein ratios reported by XPRESS, ASAPRatio and MaXIC-Q, listed in Table 1, shows that MaXIC-Q quantified the highest number of proteins and had a relatively smaller standard deviation. Although ASAPRatio generated a single peptide ratio for Beta-lactoglobulin, the computed ratio (3.49) differed significantly from the expected ratio of 1.5. The inconsistency may be attributed to the low confidence in protein identification probability (0.69 by ProteinProphet). By applying MaXIC-Q’s stringent validation requirements, the same peptide failed in terms of the IP criterion and was not quantitated further. For the three proteins usually quantified by the three programs, we calculated the average error of protein ratios as follows:
¦
Average Error
i proteins
Calculated Ratioi � Expected Ratioi Expected Ratioi , Number Of Proteins
(1)
where Calculated Ratioi and Expected Ratioi are the calculated and corresponding theoretical ratios of protein i, respectively. For XPRESS, ASAPRatio and MaXIC-Q, the average errors of the three proteins were 0.675, 0.821 and 0.312, respectively; and the average errors of non-degenerate peptides were 0.765, 0.708 and 0.241, respectively. The average errors of non-degenerate peptides were also calculated by using Equation (1). Overall, the MaXIC-Q results are comparable to those of the other two programs. Moreover, they exhibit smaller average errors and smaller standard deviations, which demonstrates more stable and accurate computation capability.
Large-scale Quantitation for the Comparative Study of NO-treated Endothelial Cells by cICAT Strategy and 2D LC-MS/MS
20
To further evaluate the performance of MaXIC-Q on large-scale proteomic studies, we applied it to the large-scale quantitative proteomic dataset generated from the comparative study of NO-treated EA.hy926 endothelial cells. The control and NO-treated cells were labeled with light and heavy cICAT, respectively; and a total of 33 fractions were generated by SCX fractionation and analyzed by LC-MS/MS. The batch search results and 66 mzXML files (~6 GB) were input to MaXIC-Q. To process the input data, MaXIC-Q only took 55 minutes on Microsoft Windows Server 2003 R2 x64 edition service pack 2 with 64-bit AMD Opteron Processor 2210 CPU, 1.8GHz processors, 7200 rpm SATA hard disk 500 GB and 8G RAM (only 2G was used for this operation). In contrast, ASAPRatio took 10 hours and 33 minutes on the same computer. Thus, MaXIC-Q improved the performance of the conventional time-consuming quantitation process more than 10-fold. Using the SEQUEST search engine, the dataset generated 7,109 identified peptides and 1,259 corresponding proteins without restriction on the peptide and protein probability settings. After filtering low-confidence peptides and proteins, we obtained 5,488 non-degenerate peptides (peptide probability > 0.7) and 770 proteins (protein probability > 0.6). Partial output reports of the peptide and protein quantitation results are presented in Tables 2 and 3, respectively. Moreover, in this experiment, MaXIC-Q reported a mean peptide ratio of 0.945 ± 0.245 for 3,948 peptides (excluding peptides with ratios of 0 or 999). The result was reasonably accurate. The mean of the protein ratios was 0.956 ± 0.235 after peptide ratio normalization, and 0.924 ± 0.227 without peptide ratio normalization. The standard deviations for the mean peptide ratio and the mean protein ratio were approximately within the 20% range. We assume this can be attributed to the c-ICAT labeling method combined with mass spectrometry analysis (22). Handling co-elution of peptide ions
21
In large-scale experiments, noisy data presents the most challenging task for accurate quantification. Various levels of noise inevitably occur depending on the separation capability, resolution, and mass accuracy of LC-MS/MS. Data noise includes MS background noise and co-elution of multiple peptides, i.e., the signals of a target ion are affected by interference from co-eluting peptides. Most quantitation tools, including MaXIC-Q, handle background noise by background subtraction and normalization of peptide ratios (33). However, the co-elution problem cannot be resolved by simply examining the XIC or ion mass spectrum alone, although most quantification tools adopt this approach. In our experience, the co-elution problem is a critical factor that leads to quantification errors. For example, in Figure 8, validation based on XICs alone may lead to error-prone quantitation results because the (L,H)-paired ions have good bell-shaped XICs. However, when the PIMS of the heavy-labeled ion that failed the IP criterion is examined through the Elution3D viewer, the peptide profile clearly shows co-elution in the heavy-labeled ion. An example of failure in terms of the CS criterion is provided in Supplementary Figure 1. Note that the accuracy of MaXIC-Q verifies that quantitation inaccuracy can be reduced by applying the PIMS validation. Accuracy of MaXIC-Q quantitation To further evaluate the accuracy of MaXIC-Q, we also investigated the standard deviations of the calculated ratios in each peptide and each protein. First, we list all quantified ion ratios (excluding 999 or 0) for each protein, as well as peptides and proteins containing only one quantifiable ion ratio. Then, for each protein, we calculate the standard errors of the ion and peptide ratios. Figure 9 shows the cumulative percentage of proteins versus the standard error. We observe that 95.50% and 97.75% of proteins have standard errors of ion and peptide ratios
22
less than 0.225, respectively. If the CS and IP validation criteria are not applied, the results drop to 69.28% and 95.98% of proteins for ion and peptide ratios, respectively. The CS criterion detects interference from co-elution peaks and incorrectly identified peptides; thus, most unquantifiable ions are filtered out prior to the IP validation step. The small standard deviation and standard error within a peptide or protein demonstrate that MaXIC-Q provides stable and highly consistent quantitation results. We also manually validated the quantitation results. Of the 603 quantified proteins, 102 proteins (1,188 ions) are manually validated in the evaluation analysis. They are considered differentially expressed - defined as having down-regulated expression (ratio < 0.73) or up-regulated expression (ratio > 1.37), or containing a peptide ratio 999 or 0. The manual validation procedure for the 1,188 ions proceeds as follows. For each ion, we first use Elution3D to determine whether an ion co-elutes with other peptide ions or contains noise. If the ion is categorized as unquantifiable according to the ion validation criteria, we use the PIMS viewer to check whether another suitable peak can be selected for reconstructing XICs. If no suitable peak can be selected, the ion is deemed unquantifiable. If a suitable peak can be chosen, we reconstruct XICs and use the XIC viewer to select the elution time ranges to calculate ion ratios. The manually validated results of each ion are classified into four categories: unchanged, down-regulated (including the ratio of zero), up-regulated (including the ratio of infinity) and unquantifiable. For each ion, we compare the categories assigned by manual validation and MaXIC-Q. If they match, we regard the protein result as “Correct”; otherwise, we regard it as “Incorrect”. The incorrect cases are divided into four types: false positive (unquantifiable proteins falsely quantified by MaXIC-Q); false negative (quantifiable proteins incorrectly analyzed by MaXIC-Q as unquantifiable); serious errors (up-regulated proteins incorrectly
23
recognized by MaXIC-Q as down-regulated, or vice versa); and other errors (proteins with unchanged expressions incorrectly quantified by MaXIC-Q as having changed expressions, and vice versa). The accuracy and different error rates of MaXIC-Q for the dataset are detailed in Table 3. MaXIC-Q achieves an accuracy of 80.05% and yields a false positive rate of 5.05%. Thus, manual validation of MaXIC-Q quantitation results can be reduced substantially. The results demonstrate that MaXIC-Q is a highly accurate and robust quantitation tool.
DISCUSSION In contrast to many quantitation tools that can only process search results derived by Mascot, MaXIC-Q is a generic tool that can accept both SEQUEST and Mascot search results. It is also a user-friendly tool that provides various graphical modules for visualization of spectral data, including XICs, PIMSs, and three-dimensional elution profiles. In addition, MaXIC-Q provides interactive interfaces that guide the quantitation analysis process and allow users the flexibility to configure the process. After completing the analysis, users can customize their output reports through MaXIC-Q’s output module. Most importantly, to help users validate quantitation results easily, MaXIC-Q generates a very comprehensive HTML output that is portable and executable on most browsers. Since lack of accuracy is a serious problem in current quantitation tools, MaXIC-Q adopts several strategies to achieve better accuracy. First, MaXIC-Q contains a filtering module to filter out low-confidence proteins, as defined by users. Second, to the best of our knowledge, MaXIC-Q is currently the only tool that constructs PIMSs, and defines validation criteria for the ion mass spectra to automatically determine whether the corresponding XICs are valid for calculating the ion ratio. The stringent validation criteria ensure the detection of the inevitable co-elution that occurs in proteomics experiments, and thus increase the accuracy of the 24
quantitation results derived by MaXIC-Q. This is evidenced by MaXIC-Q’s results for the large-scale quantitation of the NO-treated EA.hy926 endothelial cells experiment, albeit at the cost of a higher false negative rate. However, in other experiments using high-resolution mass spectrometers, the stringent criteria may be advantageous. Another reason for the high accuracy of MaXIC-Q is that, in addition to using the Savitzky-Golay smoothing algorithm to construct PIMSs, it uses the B-spline smoothing algorithm to construct XICs. Since the number of points required to construct an XIC is small and the original sampled signals may be affected by co-eluting ions or noise, it is difficult to fit the sampled points into a specific function, e.g., a polynomial modified Gaussian function (34). However, the B-spline smoothing algorithm is a free-form fitting approach that is well-suited to XIC smoothing. We use the sum of squares of residuals (SSR) to compare the use of the B-spline smoothing algorithm with the Savitzky-Golay smoothing filter and the moving average method. The results, listed in Supplementary Table 1, show that the B-spline smoothing algorithm has much smaller SSR than the other two methods. In the large-scale quantitation of the NO-treated Endothelial Cells experiment, the accuracy rates were 80.05%, 75.08% and 73.48% for the B-spline smoothing algorithm, Savitzky-Golay smoothing filter, and the moving average method, respectively. Even though MaXIC-Q adopts a validation procedure and rigorous computational and statistical methods for quantitation analysis, its execution time is more than 10 times faster than ASAPRatio in the large-scale NO-treated endothelial cells experiment. Furthermore, when modifying the m/z range or elution time range in the PIMS viewer or the XIC viewer to rerun the program, MaXIC-Q can update the ion ratio and corresponding peptide and protein ratios instantly. Our results on the large-scale dataset show that MaXIC-Q performs well in terms of
25
computation speed and accuracy in quantitation analysis. Another important merit of MaXIC-Q is that it is designed to accommodate many different isotope-labeling methods, e.g., SILAC, ICPL (35), and user-defined modifications; however, the evaluation of MaXIC-Q’s performance was based primarily on datasets generated from cICAT-labeled proteomic studies. For example, as a user-defined modification, the static modification for light cICAT-labeled Cysteine (Cys) was set to +227.1, with a +9 differential modification for heavy cICAT-labeled Cys in the search parameters for cICAT analysis. Other quantitation strategies based on MS survey spectral data, including widely used SILAC,
18
O
labeling, can be chosen in MaXIC-Q with built-in static modification. Alternatively, other new strategies based on two differential isotope-paired ions from MS survey spectral data can be defined by users in the input interface. This flexibility indicates that MaXIC-Q is a comprehensive quantitation tool. Since MaXIC-Q adopts strict validation criteria to ensure better quantitation accuracy, it may filter out a number of less confident PIMSs and classify numerous ions as unquantifiable. This phenomenon is evidenced by the higher false negative rate compared to the false positive rate detailed in Table 4. Since researchers do not want to miss any protein that has a fold change in protein expression, MaXIC-Q provides an option for users to relax the CS and IP validation criteria to alleviate the high false-negative rate problem. When an ion fails in terms of the CS or IP criteria, the relaxed version of MaXIC-Q quantifies the ion by automatically selecting a suitable replacement peak from its PIMS to construct the XIC, which is then used to determine the ion ratio. A suitable replacement peak is chosen from isotopic peaks of the labeled ion whose elution time is closest to a peak of its counterpart ion; that is, the difference in the elution time of the paired XICs is the smallest. When this function was used in the endothelial cell experiment,
26
the false negative rate dropped significantly from 9.34% to 2.86%. Users can select the relaxed version of MaXIC-Q in the main user interface.
Acknowledgement We thank Dr. Robert Moulder for providing us their dataset published in Proteomics 2005. This work was supported in part by the thematic program of Academia Sinica under Grant AS94B003 and AS95ASIA02 and the National Science Council of Taiwan under Grant NSC 95-3114-P-002-005-Y.
REFERENCES 1.
Griffin, T. J., Goodlett, D. R., and Aebersold, R. (2001) Advances in proteome analysis by mass spectrometry. Curr. Opin. Biotechnol. 12, 607-612
2.
Domon, B., and Aebersold, R. (2006) Mass spectrometry and protein analysis. Science 312, 212-217
3.
Nesvizhskii, A. I., and Aebersold, R. (2005) Interpretation of shotgun proteomic data: the protein inference problem. Mol. Cell. Proteomics 4, 1419-1440
4.
Washburn, M. P., Wolters, D., and Yates, J. R., 3rd. (2001) Large-scale analysis of the yeast proteome by multidimensional protein identification technology. Nat. Biotechnol. 19, 242-247
5.
Tao, W. A., and Aebersold, R. (2003) Advances in quantitative proteomics via stable isotope tagging and mass spectrometry. Curr. Opin. Biotechnol. 14, 110-118
6.
Semmes, O. J., Malik, G., and Ward, M. (2006) Application of mass spectrometry to the discovery of biomarkers for detection of prostate cancer. J. Cell. Biochem. 98, 496-503
7.
Ong, S. E., and Mann, M. (2005) Mass spectrometry-based proteomics turns quantitative. Nat. Chem. Biol. 1, 252-262
8.
Islinger, M., Li, K. W., Loos, M., Lueers, G., and Voelkl, A. (2006) ITRAQ-quantification as an analytical tool to describe proteome changes in rat liver peroxisomes after bezafibrate treatment. Mol. Cell. Proteomics 5, S186-S186
9.
Jabs, W., Lubeck, M., Schweiger-Hufnagel, U., Suckau, D., and Hahner, S. (2006) A 27
comparative study of iTRAQ- and ICPL-based protein quantification. Mol. Cell. Proteomics 5, S248-S248 10. Shadforth, I. P., Dunkley, T. P., Lilley, K. S., and Bessant, C. (2005) i-Tracker: for quantitative proteomics using iTRAQ. BMC Genomics 6, 145 11. Lin, W. T., Hung, W. N., Yian, Y. H., Wu, K. P., Han, C. L., Chen, Y. R., Chen, Y. J., Sung, T. Y., and Hsu, W. L. (2006) Multi-Q: a fully automated tool for multiplexed protein quantitation. J. Proteome Res. 5, 2328-2338 12. Yu, C. Y., Tsui, Y. H., Yian, Y. H., Sung, T. Y., and Hsu, W. L. (2007) The Multi-Q web server for multiplexed protein quantitation. Nucleic Acids Res. 35, W707-712 13. Gygi, S. P., Rist, B., Gerber, S. A., Turecek, F., Gelb, M. H., and Aebersold, R. (1999) Quantitative analysis of complex protein mixtures using isotope-coded affinity tags. Nat. Biotechnol. 17, 994-999 14. Yao, X., Freas, A., Ramirez, J., Demirev, P. A., and Fenselau, C. (2001) Proteolytic 18O labeling for comparative proteomics: model studies with two serotypes of adenovirus. Anal. Chem. 73, 2836-2842 15. Ong, S. E., Blagoev, B., Kratchmarova, I., Kristensen, D. B., Steen, H., Pandey, A., and Mann, M. (2002) Stable isotope labeling by amino acids in cell culture, SILAC, as a simple and accurate approach to expression proteomics. Mol. Cell. Proteomics 1, 376-386 16. Ong, S. E., and Mann, M. (2006) A practical recipe for stable isotope labeling by amino acids in cell culture (SILAC). Nat. Protoc. 1, 2650-2660 17. Ong, S. E., Kratchmarova, I., and Mann, M. (2003) Properties of 13C-substituted arginine in stable isotope labeling by amino acids in cell culture (SILAC). J. Proteome Res. 2, 173-181 18. Ong, S. E., and Mann, M. (2007) Stable isotope labeling by amino acids in cell culture for quantitative proteomics. Methods Mol. Biol. 359, 37-52 19. Han, D. K., Eng, J., Zhou, H., and Aebersold, R. (2001) Quantitative profiling of differentiation-induced microsomal proteins using isotope-coded affinity tags and mass spectrometry. Nat. Biotechnol. 19, 946-951 20. Li, X. J., Zhang, H., Ranish, J. A., and Aebersold, R. (2003) Automated statistical analysis of protein abundance ratios from data generated by stable-isotope dilution and tandem mass spectrometry. Anal. Chem. 75, 6648-6657 21. MacCoss, M. J., Wu, C. C., Liu, H., Sadygov, R., and Yates, J. R., 3rd. (2003) A correlation algorithm for the automated quantitative analysis of shotgun proteomics data. Anal. Chem. 75, 6912-6921 22. Bouyssie, D., de Peredo, A. G., Mouton, E., Albigot, R., Roussel, L., Ortega, N., Cayrol, C., 28
Burlet-Schiltz, O., Girard, J. P., and Monsarrat, B. (2007) Mascot file parsing and quantification (MFPaQ), a new software to parse, validate, and quantify proteomics data generated by ICAT and SILAC mass spectrometric analyses: application to the proteomics study of membrane proteins from primary human endothelial cells. Mol. Cell. Proteomics 6, 1621-1637 23. A. Savitzky and Marcel J.E. Golay (1964) Smoothing and Differentiation of Data by Simplified Least Squares Procedures. Anal. Chem. 36, 1627-1639 24. Pedrioli, P. G., Eng, J. K., Hubley, R., Vogelzang, M., Deutsch, E. W., Raught, B., Pratt, B., Nilsson, E., Angeletti, R. H., Apweiler, R., Cheung, K., Costello, C. E., Hermjakob, H., Huang, S., Julian, R. K., Kapp, E., McComb, M. E., Oliver, S. G., Omenn, G., Paton, N. W., Simpson, R., Smith, R., Taylor, C. F., Zhu, W., and Aebersold, R. (2004) A common open representation of mass spectrometry data and its application to proteomics research. Nat. Biotechnol. 22, 1459-1466 25. Moulder, R., Filen, J. J., Salmi, J., Katajamaa, M., Nevalainen, O. S., Oresic, M., Aittokallio, T., Lahesmaa, R., and Nyman, T. A. (2005) A comparative evaluation of software for the analysis of liquid chromatography-tandem mass spectrometry data from isotope coded affinity tag experiments. Proteomics 5, 2748-2760 26. Keller, A., Nesvizhskii, A. I., Kolker, E., and Aebersold, R. (2002) Empirical statistical model to estimate the accuracy of peptide identifications made by MS/MS and database search. Anal. Chem. 74, 5383-5392 27. Nesvizhskii, A. I., Keller, A., Kolker, E., and Aebersold, R. (2003) A statistical model for identifying proteins by tandem mass spectrometry. Anal. Chem. 75, 4646-4658 28. De Boor, C. (1978) A Practical Guide to Splines, 1st Ed., pp. 114-115, Springer Verlag, NY 29. Kubinyi, H. (1991) Calculation of Isotope Distributions in Mass-Spectrometry - a Trivial Solution for a Nontrivial Problem. Anal. Chim. Acta 247, 107-119 30. Callister, S. J., Barry, R. C., Adkins, J. N., Johnson, E. T., Qian, W. J., Webb-Robertson, B. J. M., Smith, R. D., and Lipton, M. S. (2006) Normalization approaches for removing systematic biases associated with mass spectrometry and label-free proteomics. J. Proteome Res. 5, 277-286 31. Fernandez-De-Cossio, J., Gonzalez, L. J., Satomi, Y., Betancourt, L., Ramos, Y., Huerta, V., Amaro, A., Besada, V., Padron, G., Minamino, N., and Takao, T. (2004) Isotopica: a tool for the calculation and viewing of complex isotopic envelopes (vol 32, pg 2674, 2004). Nucleic Acids Res. 32, 3779-3779 32. Yergey, J. A. (1983) A General-Approach to Calculating Isotopic Distributions for Mass-Spectrometry. International Journal of Mass Spectrometry and Ion Processes 52, 337-349 33. Zhang, X., Asara, J. M., Adamec, J., Ouzzani, M., and Elmagarmid, A. K. (2005) Data 29
pre-processing in liquid chromatography-mass Bioinformatics 21, 4054-4059
spectrometry-based
proteomics.
34. Nikitas, P., Pappa-Louisi, A., and Papageorgiou, A. (2001) On the equations describing chromatographic peaks and the problem of the deconvolution of overlapped peaks. J. Chromatogr., A 912, 13-29 35. Schmidt, A., Kellermann, J., and Lottspeich, F. (2005) A novel strategy for quantitative proteomics using isotope-coded protein labels. Proteomics 5, 4-15
30
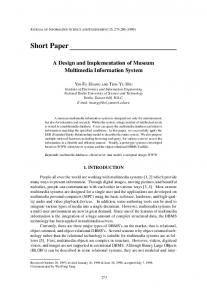
FIGURE LEGENDS Figure 1. Workflow of MaXIC-Q analysis After accepting input data, MaXIC-Q performs the following steps: (1) Filtering: it selects confident identification results by filtering out results whose scores are lower than the user-defined thresholds. (2) Ion level processing: it constructs the PIMS and XIC for each ion of the selected confident peptides and determines the range of the elution time for each pair of XICs. (3) Validation: it uses three validation criteria defined on PIMSs to determine whether the corresponding XICs are valid for quantitation. (4) Peptide level processing: it calculates the ratios of ions with validated PIMSs based on the areas of paired XICs. The peptide ratio is calculated as a weighted sum of the ion ratios. (5) Protein level processing: it normalizes peptide ratios and calculates the protein ratio as a weighted sum of the corresponding normalized peptide ratios.
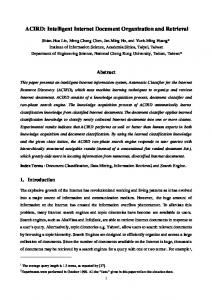
Figure 2. Input data preparation for MaXIC-Q quantitation. First, raw data files generated by various mass spectrometers need to be converted into mzXML files using existing converters, such as mzStar for .wiff files. The raw data files or mzXML files are then searched by either the Mascot or SEQUEST pipeline. The files can be searched directly by the Mascot server with a variety of tools. However, the mapping files (.table file), which associates Mascot search results with scan information in mzXML, must be required for quantitation. Currently, MaXIC-Q provides wiff2scan to generate .table files for .wiff spectral files. Users can also use SEQUEST servers to search mzXML files. The searched results need to be applied to PeptideProphet and ProteinProphet to generate pepXML files (referred to as interact_prot.xml) and protXML files (referred to as interact_pep.xml). The mzXML files and search results then serve as input for MaXIC-Q.
31
Figure 3. Construction of the PIMS and XIC. The MS survey scans are represented by a 3D model, in which the different shades of gray show the intensity of the peaks. A, Construction of PIMS: n MS survey scans are projected, and the maximal intensities of overlapping peaks are used to construct the PIMS. B, Construction of XIC: each point in an XIC represents the total intensity of signals within the selected m/z range of the MS survey scan.
Figure 4. MaXIC-Q validation procedure and examples. In a PIMS, the vertical gray line (a line connected to the top and bottom of the spectrum) indicates the precursor m/z. The vertical red lines represent theoretical isotopic peaks whose intensities are normalized according to the precursor ions. (A), (C) and (E) show examples of PIMSs that pass the S/N, CS and IP criteria, respectively; while (B), (D) and (F) show PIMSs that fail the S/N, CS and IP criteria, respectively. In (A), the PIMS passes the “S/N” criterion, since the S/N of all three isotopic peaks, including the one containing the precursor, is over 2.5. In (B), the S/N of the peak encompassing the precursor m/z is lower than the 2.5 threshold. In (D), the PIMS over the m/z ranging from 437.0 to 440.0 with the precursor m/z 437.75 includes the peptide ion with a +2 charge. The m/z distance between two experimental isotopic peaks is 0.5, not the expected 0.33 for the target ion with a +3 charge. (F) shows that the experimental and theoretical isotope patterns do not match; moreover, the experimental isotope pattern may be affected by other peptides or noise.
Figure 5. Main user interface of MaXIC-Q. Through the user interface, users can conveniently operate the following modules or access the following interfaces: (A) the configuration and filtering module; (B) Elution3D for viewing elution profiles; (C) the XIC viewer; (D) the PIMS
32
viewer; (E)-(G) protein, peptide and ion quantitation results output interfaces; and (H) output export module. Using the configuration and filtering module shown in (A), users can input optional user-defined thresholds for filtering low-confidence peptides and proteins (discussed in Step 1) and unchanged expressions of peptides or proteins.
Figure 6. XIC, PIMS and Elution3D viewers. Viewers for (A) XIC and (B) PIMS, which show the corresponding diagrams of the DKLPQPVQPDPVSHCK peptide ions (spec. no. = ICAT_EA_44.0919.0919.3) with a +3 charge that passes the validation criteria. In (A), the red line in the XIC indicates the retention time at which the peptide is identified. A pair of green lines represents the selected elution time range used for ion ratio calculation. In (B), since the PIMS passes the three validation criteria, it is marked “Accepted” in blue, whereas a failed spectrum would be marked “Not Accepted” in red. In the spectrum, the status of the three validation criteria, the signal-to-noise-ratio (SN), charge state, (CS) and isotope pattern (IP), are clearly shown in blue (pass) or red (fail). The observed m/z of the precursor ion is indicated by vertical iron-gray line in the spectrum; the m/z range used to construct XIC is indicated by a pair of green lines; and the background level is indicated by a horizontal purple line. For isotope pattern evaluation, the viewer shows the normalized theoretical intensities of three isotope peaks in red, followed by a number in purple, which represents the corresponding experimental intensities. The goodness-of-fit between the theoretical and experimental isotope peak intensities is calculated by Chi-Square Goodness-of-Fit Test score. After obtaining the quantitation results, the PIMS viewer allows users to modify the m/z range for XIC reconstruction, and the XIC viewer allows users to modify the elution time range for quantitation. Users can click the “Apply” button to apply the selected range and requantify the corresponding ion, peptide, and
33
protein ratio, or click the “Default” button to restore the original quantitation results. In (C), the Elution3D viewer shows the elution time and the corresponding m/z of the heavy and light cICAT-labeled peptide ions by the vertical red line and horizontal black lines, respectively. In the left panel, the light and heavy cICAT-labeled peptide ions VIGSGCNLDSAR with a +2 charge are clearly differentiated and form two clusters of isotopic peaks; the pair of ions do not co-elute with other ions. In right panel, the heavy cICAT-labeled peptide ion YAGLSTCFR with a +2 charge suffers serious interference from other ions. The Elution3D viewer allows easy visual inspection of large-scale datasets to facilitate confident and accurate quantification.
Figure 7. Screenshot of an HTML export file The screenshot of an export example captured when executing the program on the large-scale dataset. The file contains a comprehensive output report, including summary tables and visualization figures. Various layout styles are also provided. To view results of interest, users can click the buttons in the file to hide or show protein, peptide, or ion quantitation results. The up- and down-regulated ratios are shown in red and green, respectively.
Figure 8. An ion example that fails the IP criterion. (A) PIMSs, (B) Elution3D view, and (C) XICs
of
the
(L,H)-paired
ion
VTCPNHPDAILVEDYR
(spec.
no.
=
ICAT_EA_35_02.1722.1722.3). The co-elution of heavy cICAT-labeled peptides with other ions can be observed more clearly by using the Elution3D viewer than the XIC viewers. In (A), the PIMS of the heavy cICAT-labeled ion, which failed in terms of the IP criterion, shows that two peptide ions co-elute. Coelution can be recognized easily by the elution profile shown by Elution3D (as shown in (B)). In (B), the yellow and white ellipses represent isotopic peaks of the
34
target peptide ion and a coeluting ion, respectively. They show serious overlapping of the monoisotopic peaks of the two peptides (indicated by the white arrow). Using the overlapping precursor ion peak to construct the XIC for the heavy cICAT-labeled target ion, the resulting XIC will be over-represented compared to its light-labeled counterpart, as shown in (C). However, most quantitation tools that only examine XICs for the validity check would consider this ion quantifiable because the XIC curve has a good bell shape.
Figure 9. Cumulative distribution of proteins versus (A) the standard error of ion ratios; and (B) the standard error of peptide ratios in the comparative study of NO-treated endothelial cells. We calculate the respective standard errors of ion ratios and peptides ratios in each protein. Then, we sort the standard errors of all the proteins to draw these two diagrams. The solid circles represent the results of MaXIC-Q analysis, while the empty circles represent the results without applying the CS and IP validation criteria.
35
SUPPLEMENTARY!FIGURES Figure 1. A co-elution example that fails the CS criterion. (A) PIMSs, (B) Elution3D view, and (C) XICs of (L,H)-paired ion CIESLIAVFQK (spec. no. = ICAT_EA_26_02.2097.2097.2, +2). In the PIMS of the light cICAT-labeled peptide ion shown in (A), the first and third isotopic peaks are interfered by another co-eluting peptide with a +1 charge. Thus, the peptide ion is unquantifiable. This result can be viewed more clearly in the Elution3D viewer, shown in (B). It is not easy to detect by XIC viewers only.
36
Table 1. Summary of protein analysis results from the standard protein experiment
Protein
Protein Expected Probability protein ratio
TPP 3.2 XPRESS Ratio
TPP 3.2 ASAPRatio
SD
Ratio
SD
MaXIC-Q Ratio
SD
GAPDH
0.00
0.10
N/A
N/A
N/A
N/A
N/A
N/A
Alpha-lactalbumin
1.00
0.20
0.46
0.02
0.55
0.17
0.27
0.03
Glycogen phosphorylase
1.00
0.66
0.98
0.23
0.77
0.10
0.63
0.08
Lactoferrin
1.00
1.00
N/A
N/A
N/A
N/A
0.98
0.02
Beta-lactoglobulin
0.69
1.50
2.56
0.00
3.49
1.58
N/A
N/A
Lysozyme C
1.00
2.00
2.42
0.56
2.08
0.25
2.34
0.3
Beta-galactosidase
1.00
5.00
N/A
N/A
N/A
N/A
9.87
2.68
Ribonuclease A
0.56
0.50
N/A
N/A
N/A
N/A
N/A
N/A
37
Table 2. Partial results of the protein summary report for the NO-treated Endothelial Cells experiment using the cICAT strategy and 2D LC-MS/MS Accession number IPI00218733 IPI00000105 IPI00168554 IPI00017292 IPI00219025 IPI00216298 IPI00215743 IPI00021263 IPI00465439 IPI00418471 IPI00021805 IPI00219018 IPI00395887 IPI00219757 IPI00465436 IPI00007765 IPI00218845 IPI00029264 IPI00026958
Protein name SODC_HUMAN MVP_HUMAN SRXN1_HUMAN CTNB1_HUMAN GLRX1_HUMAN THIO_HUMAN RRBP1_HUMAN 1433Z_HUMAN ALDOA_HUMAN VIME_HUMAN MGST1_HUMAN G3P_HUMAN TXND1_HUMAN GSTP1_HUMAN CATA_HUMAN GRP75_HUMAN NOS3_HUMAN CY1_HUMAN ADRO_HUMAN
ID probability 1.0 1.0 1.0 1.0 1.0 1.0 1.0 1.0 1.0 1.0 1.0 1.0 1.0 1.0 1.0 1.0 1.0 1.0 1.0
Number of quantifiable peptides 7 2 5 2 3 23 4 16 37 35 3 61 6 6 9 1 5 6 5
Sequence coverage
Ratios (L/H)
Normalized ratio (L/H)
12.82% 2.69% 11.68% 3.71% 12.38% 8.65% 2.97% 11.43% 10.19% 20.22% 9.03% 18.56% 4.64% 4.78% 7.03% 7.81% 2.25% 6.15% 4.48%
2.21 1.37 1.27 1.12 1.08 1.07 1.02 1.01 1.01 1.00 1.00 0.98 0.95 0.91 0.90 0.88 0.85 0.54 0.49
2.29̈́0.16 1.42̈́0.08 1.31̈́0.13 1.16̈́0.02 1.12 1.10̈́0.09 1.06̈́0.14 1.04̈́0.09 1.04̈́0.09 1.03̈́0.21 1.03̈́0.05 1.01̈́0.13 0.98̈́0.09 0.94̈́0.09 0.94̈́0.12 0.91 0.88̈́0.08 0.56̈́0.15 0.50̈́0.07
Annotated spectra for those proteins are available in Supplemental Data 1 (word format) and Supplemental Data 2 (our html format).
Table 3. Partial results of the peptide summary report for the NO-treated Endothelial Cells experiment using the cICAT strategy and 2D LC-MS/MS. Accession number
Sequence
IPI00000105 HYCTVANPVSR LFSVPDFVGDACK IPI00744135 ELCHTQSSHASLR HMAAASAECQNYAK HMAAASAECQNYAK HMAAASAECQNYAK IPI00218845 CLGSLVFPR FCVFGLGSR CSQLDHLYR IPI00645907 AALQEELQLCK SFYGSTLFLCR LSIPTYGLQCTR GLKPSCTIIPLMK CPPGVVPACHNSK CTVFHGAQVEDAFR CTVFHGAQVEDAFR FCFTPHTEEGCLSER DGLLENQTPEFFQDVC KPK IPI00018206 VGAFTMVCK EYLPIGGLAEFCK NLDKEYLPIGGLAEFCK IPI00375015 IAQLICER IAQLICER IAQLICER TDIQIALPSGCYGR IPI00029264 DVCTFLR HLVGVCYTEDEAK
z
score
L/S/U
3 2 3 3 3 3 2 2 3 2 2 2 3 3 3 3 3 3
1.00 1.00 1.00 0.99 1.00 0.93 0.99 0.96 0.83 1.00 1.00 0.99 0.94 0.98 1.00 1.00 1.00 0.97
ښ/ښ/ڙ ښ/ښ/ښ ښ/ښ/ښ ښ/ښ/ښ ښ/ښ/ښ ښ/ښ/ښ ښ/ښ/ښ ښ/ښ/ښ ښ/ښ/ښ ښ/ښ/ښ ښ/ښ/ښ ښ/ښ/ښ ښ/ښ/ښ ښ/ښ/ښ ښ/ښ/ښ ښ/ښ/ښ ښ/ښ/ښ ښ/ښ/ڙ
䨀/䨀/䨀 䨀/䨀/䨀 䧿/䧿/䧿 䨀/䨀/䨀 䨀/䧿/䧿 䨀/䨀/䨀 䨀/䨀/䨀 䨀/䨀/䨀 䨀/䨀/䨀 䨀/䨀/䨀 䨀/䨀/䨀 䨀/䨀/䨀 䨀/䨀/䨀 䨀/䨀/䨀 䨀/䨀/䨀 䨀/䨀/䧿 -
䨀/䨀/䨀 䨀/䨀/䨀 䨀/䧿/䧿 䨀/䨀/䨀 䨀/䨀/䨀 䨀/䨀/䨀 䨀/䨀/䨀 䨀/䨀/䨀 䨀/䨀/䨀 䨀/䨀/䨀 䨀/䨀/䨀 䨀/䨀/䨀 䨀/䨀/䨀 䨀/䨀/䨀 䨀/䨀/䧿 䨀/䨀/䨀 -
Normalized peptide ratio (L/H) N/A 1.45 1.05 N/A 1.08 N/A 0.54 0.85 1.09 0.77 0.89 1.02 0.91 1.03 0.67 N/A N/A N/A
3 2 3 2 2 2 2 2 3
0.96 1.00 1.00 1.00 0.97 0.93 1.00 1.00 0.98
ښ/ښ/ښ ښ/ښ/ښ ښ/ښ/ښ ښ/ښ/ښ ښ/ښ/ښ ښ/ښ/ښ ښ/ښ/ښ ښ/ښ/ښ ښ/ښ/ښ
䨀/䨀/䨀 䨀/䨀/䨀 䨀/䨀/䨀 䨀/䨀/䧿 䨀/䨀/䨀 䨀/䨀/䨀 䨀/䨀/䨀 䨀/䨀/䨀 䨀/䨀/䨀
䨀/䨀/䨀 䨀/䨀/䨀 䨀/䨀/䨀 䨀/䨀/䨀 䨀/䨀/䧿 䨀/䨀/䨀 䨀/䨀/䨀 䨀/䧿/䧿 䨀/䨀/䨀
0.94 0.62 0.83 N/A N/A 0.95 0.93 N/A 0.85
Light Heavy S/N, CS, IP S/N, CS, IP
L: checked if the peptide is labeled with user-assigned light of heavy modification. S: checked if the peptide has high identification confidence (i.e., passes the identification score threshold). U: checked if the peptide is non-degenerate. A validation criterion is checked if the peptide passes the criterion.
39
Table 4. Accuracy of MaXIC-Q on 1188 ions selected from the NO-treated Endothelial Cells experiment dataset that has been manually validated. Performance Accuracy False Positive Rate False Negative Rate Serious Errors Other Errors
Rate 80.05% 5.05% 9.34% 0.17% 5.39%
SUPPLEMENTARY!TABLE Table 1. A. Performance comparison, in terms of squares of residuals (SSR), of using the Savitzky-Golay (S-G) smoothing filter, the moving average smoothing filter, and the B-spline smoothing algorithm for XIC curve fitting. The B-spline curve fitting algorithm has the smallest average SSR for the standard sample and the Endothelial Cells Experiment and can better fit the XIC curve.
Average SSR on XICs B-spline smoothing S-G smoothing Moving average
Standard Sample
Endothelial Cells Experiment
1,224,399.2 1,627,777.2 1,838,663.0
895,511.5 3,593,422.8 4,254,328.2
B. Another performance comparison of using the Savitzky-Golay (S-G) smoothing filter, the moving average smoothing filter, and the B-spline smoothing algorithm for XIC curve fitting in terms of accuracy on the manually validated dataset from the Endothelial Cells Experiment . The results show that the B-spline curve fitting algorithm substantially improves the accuracy rate.
B-spline smoothing
S-G smoothing
Moving average
Accuracy False positive
80.05% 5.05%
75.08% 2.95%
73.48% 3.03%
False negative
9.34%
16.84%
18.18%
Serious errors Other errors
0.17% 5.39%
0.17% 4.97%
0.17% 5.13%
41
Figure 1
42
Figure 2
43
Figure 3
B
A
44
Figure 4
Data File Input 624.3
m/z 697.3 S/N > 2.5
m/z 448.2
6
S/N < 2.5
2
Fail
5
0
9.
0.
45
0 9.
44
5 8.
44
0 8.
44
5 7.
m/z 577.5
57 0 7 5 7 .2 7 5 7 .4 7 5 7 .6 7 5 7 .8 8 5 7 .0 8. 57 2 8. 4
4+
9.
7.
Intensity
Fail
0
Isotope Pattern
25 20 15 10 5 0
57
69
Pass
69
8.
0 69
8.
5 7.
5
3+
0 7.
0.5
43
9.
m/z 697.3
69
Intensity
70 60 50 40 30 20 10 0 69
(D)
0.33
m /z
m /z
(E)
m/z 437.7 3+
7 4 3 .6 7. 43 8 8 4 3 .0 8 4 3 .2 8. 43 4 8 4 3 .6 8. 43 8 9. 0
Charge State
69
69
Pass
60 50 40 30 20 10 0
0
5 8.
0 69
8.
5 7.
7.
69
69
3+
Intensity
m/z 697.3 0.33
0
Intensity
70 60 50 40 30 20 10 0
44
44
m /z
m /z
(C)
(B)
4
0 9.
5 69
8.
0 69
8.
5 69
7.
7.
Signal to Noise
Fail
0
69
69
Pass
Intensity
8
70 60 50 40 30 20 10 0 0
Intensity
(A)
m /z
m /z
Data File Output
45
(F)
Figure 5
(A)
(E)
(B)
(H)
(F)
(C)
(G)
46
(D)
C
A
Figure 6
B
Figure 7
Figure 8
A
Light cICAT-labeled peptide ion
Heavy cICAT-labeled peptide ion
B
C Heavy cICAT-labeled peptide ion
Light cICAT-labeled peptide ion
49
Figure 9
A
Cumulative percentage of proteins
120
100
80
60
40 With CS and IP Without CS and IP 20
0 0.0
0.1
0.2
0.3
0.4
0.5
0.6
0.7
0.8
0.9
1.0
1.1
1.2
1.3
1.2
1.3
Standard error of ion ratios (in each protein)
B
Cumulative percentage of proteins
110
100
90
80
70 With CS and IP Without CS and IP 60
50 0.0
0.1
0.2
0.3
0.4
0.5
0.6
0.7
0.8
0.9
1.0
1.1
Standard error of peptide ratios (in each protein)
50
Supplementary Figure 1
A Light cICAT-labeled peptide ion
Heavy cICAT-labeled peptide ion
B
C
Light cICAT-labeled peptide ion
Heavy cICAT-labeled peptide ion
51