This article has been accepted for inclusion in a future issue of this journal. Content is final as presented, with the exception of pagination. IEEE/ACM TRANSACTIONS ON NETWORKING
1
Measurement-Driven Guidelines for 802.11 WLAN Design Ioannis Broustis, Member, IEEE, Konstantina Papagiannaki, Member, IEEE, Srikanth V. Krishnamurthy, Senior Member, IEEE, Michalis Faloutsos, Member, IEEE, and Vivek P. Mhatre
Abstract—Dense deployments of WLANs suffer from increased interference and, as a result, reduced capacity. There are three main functions used to improve the overall network capacity: 1) intelligent frequency allocation across access points (APs); 2) loadbalancing of user affiliations across APs; and 3) adaptive power control for each AP. Several algorithms have been proposed in each category, but so far, their evaluation has been limited to: a) each approach in isolation; and b) simulations or small-scale testbeds. In this paper, we ask the question: What is the best way to combine these different functions? Our focus is to fully explore the interdependencies between the three functions in order to understand when and how to deploy them on a network. We follow a measurement-driven study to quantify the effects of three previously proposed optimization schemes (one for each category) on a relatively large testbed and in many different scenarios. Surprisingly, we find that blindly applying all the three optimization schemes is not always preferable; it can sometimes degrade the performance by as much as 24% compared to using only two of the schemes. We discover that there are explicit conditions that are conducive for applying specific combinations of the optimization schemes. We capture these conditions within a comprehensive framework, which we call measurement-driven guidelines (MDG). While we derive such guidelines based on measurements on one experimental testbed, we test their applicability and efficacy on a second testbed in a different location. We show that our framework improves network capacity consistently across both testbeds, with improvements ranging from 22% to 142% with 802.11a, and 103% to 274% with 802.11g. Index Terms—Experimentation, frequency selection, IEEE 802.11 WLANs, measurement, power control, user association.
I. INTRODUCTION
T
HE emergence of highly dense wireless LANs is a consequence of: 1) the desire for ubiquitous coverage; 2) incremental and heuristic deployments; and 3) decreasing prices of access point (AP) hardware. The desire to ensure coverage with the best signal quality possible has led to environments with thousands of APs in urban areas and enterprises [1]. However, dense deployments can lead to high interference levels if resource sharing is not optimized.
Manuscript received April 29, 2008; approved by IEEE/ACM TRANSACTIONS NETWORKING Editor P. Barford. This work was supported in part by NSF CAREER Grant 0237920 and NSF NRT Grant 0335302. I. Broustis, S. V. Krishnamurthy, and M. Faloutsos are with the Department of Computer Science and Engineering, University of California Riverside, Riverside, CA 92507 USA (e-mail:
[email protected];
[email protected];
[email protected]). K. Papagiannaki is with Intel Labs, Pittsburgh, PA 15213 USA (e-mail: dina.
[email protected]). V. P. Mhatre is with Motorola Inc., Arlington Heights, IL 60004 USA (e-mail:
[email protected]). Digital Object Identifier 10.1109/TNET.2009.2031971
To mitigate the interference in such networks, we can optimize operations by means of three functions: 1) intelligent frequency allocation across APs; 2) load-balancing of user affiliations across APs; and 3) adaptive power control for each AP. There have been techniques proposed for each of the above operations [2]–[4]. However, most previous efforts consider the optimization along each dimension (frequency, user affiliation or power) in isolation. In addition, the performance of each proposed method is typically evaluated on a different, small testbed and/or through simulations. Theoretical models and simulation studies are good for capturing bounds and trends, but not as good for quantifying the performance one should expect in practice. The goal of this work is to explore the interdependencies between the three functions in order to maximize the benefits from their deployment. In particular, we want to: 1) understand the capabilities and benefits that one should expect from each optimization function; and 2) identify the conditions that are conducive for applying these functions in isolation or in combination. While all three functions manipulate the dense WLAN topology to maximize network capacity,1 the tuning of the topology by one function may “impede” the application of another function. For instance, if one attempts to balance the clients across the APs, some clients may affiliate with farther APs than they would not have otherwise. In that case, power control may not be able to reduce the power of the APs across the network, since such a power reduction would degrade the performance of these long AP–client links to unacceptable levels. Our primary contribution is a framework that provides a comprehensive set of guidelines for the optimization of dense WLANs; we call our framework Measurement Driven Guidelines (MDG). As the name suggests, the foundation of our framework is an extensive measurement study on a large-scale testbed, housed at the University of Cambridge, Cambridge, U.K. (Testbed A). We capture the topological conditions that render a WLAN amenable to optimization through appropriate combinations of the three functions.2 We observe that the use of MDG increases the network throughput by at least 22%, as compared to other design decisions. We show that the derived guidelines increase the network capacity in a second testbed, at the University of California, Riverside [5] (Testbed B), thus
ON
1Here, we use the term topology to refer to the network topology, as defined by links at the MAC layer. We also define the network capacity to be the aggregate network throughput under fully saturated traffic conditions and with the assumption that all clients of an AP receive the same long-term throughput. 2We use an experimental study with a large testbed to drive our guidelines since we believe that this can provide a more realistic assessment of conditions in practice unlike simulation studies, simplified analytical models, or observations on small scale testbeds.
1063-6692/$26.00 © 2009 IEEE Authorized licensed use limited to: Alcatel-Lucent. Downloaded on January 19, 2010 at 17:05 from IEEE Xplore. Restrictions apply.
This article has been accepted for inclusion in a future issue of this journal. Content is final as presented, with the exception of pagination. 2
IEEE/ACM TRANSACTIONS ON NETWORKING
demonstrating its effectiveness beyond our test environment. We highlight our main contributions below. 1) An in-depth understanding of the synergy of the optimization dimensions: We evaluate three existing algorithms, one for each dimension; the chosen schemes are among the best in their class. We implement and evaluate the algorithms, both in isolation and in all possible combinations, on Testbed A. We perform extensive measurements to study under what conditions a specific combination of the algorithms should be invoked to manipulate the topology of the deployment, in order to achieve optimal results. Our experiments demonstrate that in many cases, the use of one algorithm can often increase the efficacy with which another algorithm can be applied. Interestingly we find that, blindly applying all three algorithms can degrade performance. While each algorithm in isolation achieves its optimization objective, in some cases, applying all three algorithms can lead to suboptimal performance due to interdependencies. 2) Designing MDG, a comprehensive optimization framework: Based on our measurement studies, we derive the conditions under which the joint application of the algorithms is likely to yield significant performance benefits. In other words, we formulate a procedure that specifies guidelines on “which” of the algorithms should be invoked, in “what” order and “under what conditions.” Our framework can operate as a periodic reconfiguration process based on operational conditions, as we discuss later. 3) Validating the MDG framework: We validate MDG by applying it on a second WLAN (Testbed B). This network is completely different from our first testbed: It is deployed in another organization and under very different environmental conditions. We show that MDG provides the best observed performance on the testbed compared to any other combination of these optimization procedures. Our Work in Perspective: We envision that our framework will be applicable in the following cases. First, MDG could be applied on a single dense WLAN, and the decisions on the operations could be taken either centrally (perhaps by a network administrator) or by the APs in a distributed way. Note that the affiliation decisions are typically taken by the users in their WLAN. Second, MDG could be applied in the presence of multiple overlapping WLANs. Here, the WLANs may either work cooperatively (they all run MDG and they are willing to share information) or not. In the latter case, they will interfere with each other, but the application of MDG will result in improved network performance, given the constraints imposed by the uncooperative WLANs. In the former case, the cooperation is typically limited to frequency selection and power control, among the cooperative WLANs (see Section IV). Note that, as we discuss later, our framework considers and tries to work around external interference. The rest of the paper is organized as follows. In Section II, we provide the relevant background and briefly describe the three algorithms considered in this work. We describe our first set of experiments, the observations, and the interpretations thereof in Section III. MDG is derived in Section IV. We describe our validation process on the second WLAN deployment in Section V. Our conclusions form Section VI.
II. BACKGROUND AND RELATED WORK In this section, we describe the three algorithms that we choose for optimizing each dimension (discussed in the previous section). Finally, we provide some details on other relevant work. A. Our Choice of the Optimization Algorithms Previous work has shown that the three optimization procedures (for frequency selection, power control, and user association) can be cast under a unifying framework that relies on Gibbs sampling [2], [3]. The problem formulation relies on the definition of an optimization criterion that is derived from a potential function, which conforms to the Gibbs framework [8]. The authors demonstrate that such a criterion exists for all three optimization procedures and can be proven to converge to a global optimum through local optimization decisions, based on measurements that can be easily collected by APs and users. Optimality and Convergence: All three algorithms rely on Gibbs sampling, an iterative procedure that was proven to lead to the global optimum of their respective criterion. Given that the procedure is iterative in nature, each algorithm is invoked multiple times throughout the network until convergence has been reached (the topology no longer changes). This final state of the network is the topology evaluated throughout our experiments. Notice that the specific algorithms used in this work are potential optimization strategies that may be adopted by a network operator and that have been shown to work fairly well in real environments. The focus of the paper, however, is not the optimality of the individual algorithms, but a comprehensive framework that can combine them effectively. We choose the three algorithms given that they can all be implemented within the Gibbs’ sampling technique. However, note that our framework, MDG, could encompass other algorithms as well. In what follows, we outline the optimization criteria that drive each of the chosen algorithms. Frequency Selection Algorithm (FS): The Gibbs-based FS algorithm is described in detail in [3]. We denote the channel selected by AP as and the total thermal noise and interference from non-802.11 sources at AP as . The power of the signal received at AP from AP is denoted as . If two APs and select channels and , respectively, we capture their degree of orthogonality using function , which is equal to 1, when , and 0 otherwise.3 Based on the above notation, the minimization of total interference across the entire network can be formulated as the minimization of the energy function:
The optimization objective aims to allocate frequencies to APs such that: 1) the total noise across the entire network and 2) the amount of power sensed at each AP from its co-channel APs together, are minimized. Assuming symmetry in power and attenuation, the above equation can be simplified to
3This function can be a fraction between 0 and 1 for partially overlapped channels.
Authorized licensed use limited to: Alcatel-Lucent. Downloaded on January 19, 2010 at 17:05 from IEEE Xplore. Restrictions apply.
This article has been accepted for inclusion in a future issue of this journal. Content is final as presented, with the exception of pagination. BROUSTIS et al.: MDG FOR 802.11 WLAN DESIGN
3
Therefore, the global objective can be broken down into lois the ambient noise cally measurable objectives: The term around AP , and the term is the amount of power received by AP from all other neighbor APs, operating on the same frequency. Kauffmann et al. [3] showed that this optimization problem can be effectively solved using the Gibbs sampler; the solution is proven to converge to a global optimum. Given its simplicity, it forms the basic algorithm that we test in the frequency selection space. Implementation details are provided in Section III. User Association (UA) Algorithm: The UA algorithm is described in detail in [3]. This algorithm uses a philosophy that is similar to that in the previous case, but aims to achieve the state of minimal potential delay as defined in [9]. The algorithm is amenable to a fully distributed implementation using Gibbs sampling and can alleviate congestion by balancing the load across a larger set of APs. Within the user association formulation the objective aims to minimize the amount of time that a user needs to wait until the reception of a unit of information from its associated AP. Assuming fully saturated traffic conditions, i.e., each AP always has a packet to send to each one of its users, the long-term throughput obtained by each user associated with AP has been shown to be (1) where is the subset of users associated with AP (set denotes all the users in the network), and is the fraction of time AP is able to access the medium given its co-channel devices; sharing the medium with the co-channel devices will effectively limit its capacity to be a fraction of its nominal value. In addition, is the data unit transmission delay of user , and depends on the instantaneous transmission rate to user [3]. In fully saturated downlink conditions, the max-min fair allocation of bandwidth in the cell implies that each user will get the same throughput, which is inversely proportional to the “sum of transfor each user associated with the same AP mission delays as [determined through function ]. This latter metric is called Aggregated Transmission Delay (ATD) [3]. The minimization of the potential delay can then be formulated as the minimization of the following energy function: (2) where, is the long-term throughput of user as given by (1). Notice that there is a delicate difference between minimizing potential delay and maximizing capacity. Under our selected criterion solutions where individual user throughput tends to zero will be undesirable, this possibility cannot be eliminated if our optimization criterion was the maximization of the sum of throughputs across the network. In other words, our optimization criterion targets states of high capacity, while ensuring fairness. Kauffmann et al. [3] showed that this optimization criterion is equivalent to each user optimizing the following local energy function: (3)
denotes the number of users associated with AP . where is the additional potential delay that all the In (3), other clients of AP will experience, due to the association of user with AP , and is the delay that client will experience because of ’s existing users. This local energy only depends on the state of user and that of its neighbors. We assume here that for all , the AP channel access time is not a function of the state of the users, which is reasonable under our saturated downlink traffic assumption as long as each AP has at least one user. Power Control (PC) Algorithm: Power control has only recently attracted the interest of the 802.11 WLAN research community. Previous studies [2] and [4] have shown that power control in 802.11 WLANs needs to preserve symmetry in the contention domains. They also show that symmetry is preserved only when the product of transmission power and the Clear Channel Assessment (CCA) threshold4 for each AP is constant throughout the network. We employ the solution proposed in [2]; the proposed algorithm enables the exchange of appropriate information (by means of beacon frames) among APs to allow them to optimally tune the transmission power and the CCA thresholds, such that symmetry is preserved. The parameters are tuned by each AP so as to achieve the state of minimal potential delay. The solution has been shown to lead to up to three times improvement with respect to a case where no power control is employed, via experiments on a small scale testbed. For more details, please see [2]. Note here that no client-side information is needed for FS, UA, or PC. The APs measure all the channel gains and calculate delays and loads. The clients just need to apply the optimum settings determined by the AP, and this is readily done today. B. Other Relevant Work There have been various other frequency selection algorithms that have been previously proposed [6], [7]. With the Least Congested Channel Search (LCCS) scheme in [7], the AP chooses the least congested channel. The proposal in [6] is to hop between various channels to minimize co-channel interference. The operation of the FS algorithm is similar to that of LCCS. In [10], Mishra et al. propose a framework for client-based frequency allocation in WLANs; this combines the dimensions of frequency selection and user association into a unified framework. The work that is most related to our work is SMARTA [11], which considers the problem of joint channel allocation and power control in WLANs. SMARTA requires a central controller, which tries to optimize a utility function, using a set of measurements that are performed by the APs. The central controller constructs and periodically updates a conflict graph; the APs constitute the nodes of the graph. Based on the conflict graph, the controller jointly generates optimal channel assignments and power control levels for the APs. First, unlike SMARTA, our framework MDG can be implemented in a completely decentralized manner. Second, it includes the user-association component in addition to frequency selection and power control. Finally, MDG also provides detailed guidelines on “when” a specific combination of operations (FS, 4The CCA threshold defines the RSSI value below which receptions are ignored with regards to carrier sensing.
Authorized licensed use limited to: Alcatel-Lucent. Downloaded on January 19, 2010 at 17:05 from IEEE Xplore. Restrictions apply.
This article has been accepted for inclusion in a future issue of this journal. Content is final as presented, with the exception of pagination. 4
IEEE/ACM TRANSACTIONS ON NETWORKING
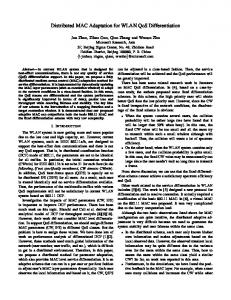
Fig. 1. Testbed A: (left) deployment on the second floor and (right) the third floor of a three-floor building. Clients are represented by circles, while APs by squares.
UA, and/or PC) is to be invoked in a “generic” dense WLAN deployment. III. DERIVING DEPLOYMENT GUIDELINES In this section, we describe the experiments that we perform on Testbed A to understand the interdependencies between the three optimization dimensions. We begin with a description of the testbed and subsequently discuss experiments with the three optimization algorithms (FS, UA, and PC from Section II) in isolation and in combination. A. Testbed Description and Deployment Strategy Testbed A consists of 21 APs and 30 clients and spans the upper two floors of the William Gates Building at the University of Cambridge. The deployment is depicted in Fig. 1. The walls in the building are wooden without any metallic support in between. The nodes are Soekris net4826 boxes [5] and run a Debian Linux distribution with kernel version 2.6.16.19. Nodes are equipped with the Intel 2915a/b/g wireless cards, which are controlled by a prototype version of the Intel ipw2200 driver and firmware. Each card is connected to two 5-dBi gain, external omnidirectional antennas. We use both the main and aux signal inputs of the Intel card for diversity. We have modified the ipw2200 driver and firmware to implement our three optimization algorithms. We provide implementation details later in this section. Choosing AP Locations: In Testbed A, 12 of the APs are installed in the building’s network closets following the existing WLAN deployment. These APs form a 2 3 grid topology in each of the two floors. The positions of the remaining nine APs were selected after a set of measurements and placed uniformly to ensure maximal coverage. Experimental Settings: Our goal is to perform extensive measurements with the three algorithms—FS, UA, and PC—and combinations thereof. Our experiments were performed late at night with both 802.11a and 802.11g; the time ensured that the contention and interference from colocated WLANs is limited.5 5The performance of the schemes in the presence of interference from colocated WLANs is examined in Section V-C.
All nodes by default set their transmission power to the maximum (20 dBm) and their CCA thresholds to 80 dBm. Each client receives fully saturated downlink UDP traffic for 2 h from its AP. We have selected only downlink traffic for our experiments, since traffic is predominantly downlink in most WLAN deployments. We use the iperf bandwidth measurement tool. During each experiment, a central testbed server periodically stores the following information: • the clients that are activated in the experiment, and the time at which each activation takes place; • the network topology specifying the clients that are affiliated with each AP at the sampled instance; • the channel, the transmission power, and the CCA of each AP. Note that each AP implements the Intel proprietary rate adaptation algorithm, adapting the transmission rate of the AP to each client according to the quality of the channel. This rate adaptation algorithm is threshold-based. In particular, a set of RSSI-rate tuples is maintained in the form of a table. If the RSSI is above a specific threshold, then the respective rate is used. In the presence of rate adaptation, it has been shown in [12] (and we have verified in our testbed) that all clients will receive the same long-term throughput under fully saturated traffic conditions. B. Frequency Selection We first evaluate and experiment with the FS algorithm. The objective of the FS algorithm is to assign frequency channels to the different APs such that the interference between the APs is minimized. In this section, we only consider the FS scheme in isolation, and we combine it with other algorithms later. The key observations from our experiments are the following: • Neighboring APs may interfere with each other, even when set to orthogonal channels in IEEE 802.11a. Thus, to eliminate interference, neighboring APs with a mutual dBm must choose frequencies that are separated by at least 40 MHz with 802.11a. • The use of the FS algorithm always improves (and never hurts) the performance compared to that achieved by default. • We observe that loss of beacon messages affects the channel selection decisions negatively. The beacons are lost either due to poor link quality, AP overload (when they may not even get sent out), or insufficient scanning times. We first present some implementation details specific to FS. Implementation Details: We activate all APs sequentially in random order. At start-up, each AP runs the FS algorithm, which is an iterative process, until the channel decisions do not change for a set of iterations. The clients are then activated sequentially and they choose their APs based on the strongest received signal (i.e., the UA algorithm is not activated). Note that in Testbed A, FS converges in two iterations (each iteration is scheduled at instances that are separated by exponentially distributed periods with an average value of 30 min). The FS algorithm is implemented in the AP driver and firmware. In particular, the following features were implemented: 1) Gathering information with regards to each channel: Each AP passively scans each channel to discover neighbor APs. On each channel, the AP measures the strength (RSSI) of the received signal from each neighboring AP.
Authorized licensed use limited to: Alcatel-Lucent. Downloaded on January 19, 2010 at 17:05 from IEEE Xplore. Restrictions apply.
This article has been accepted for inclusion in a future issue of this journal. Content is final as presented, with the exception of pagination. BROUSTIS et al.: MDG FOR 802.11 WLAN DESIGN
The RSSI values are then added to compute the total received power on the current channel. 2) Interference and colocated WLANs: The AP driver, by default, measures the strength of the received signals from all APs, irrespective of whether they belong to the same WLAN or not. We run the experiments at night to avoid interference from colocated WLANs. This has two advantages: Our results are easier to reproduce and interpret. Note that before initiating our experiments, we monitor the medium and verify that there is no data traffic from external WLANs. Hence, we have modified the AP driver to ignore the beacons from inactive APs of other WLANs in the channel selection process. Our experiments and observations are described next. a. The FS algorithm in isolation is always beneficial in a dense WLAN: We quantify the performance improvements with the FS algorithm. For comparison, we consider two different approaches: 1) all APs are on the same channel6; and 2) a channel selection algorithm, which we call Random Channel Selection (RCS) algorithm, where each AP randomly selects one of the orthogonal channels. In what follows, we will quantify performance using the sum of throughputs achieved by all clients across the network, a metric we will also call as the “network capacity.” Fig. 2 shows that, as one might expect, FS outperforms RCS; the improvements are 48% in 802.11a and 65% in 802.11g. b. Loss of beacon messages affects the decisions of the FS algorithm negatively: In many cases, we observed colocated APs with the same frequency, although such frequency overlaps could have been avoided. An AP follows a scanning process, where it listens for beacons from APs to choose its operating frequency. When an AP misses beacon messages from its neighbor APs, it can end up selecting a frequency already in use. Missing a beacon could be a consequence of: 1) poor link conditions; 2) small scanning duration (band dwell duration); and 3) lack of timely beacons from neighbors [13]. To improve the selection, the FS algorithm can base its decision on a sufficiently large scanning interval and on more than one scanning cycles (recall that each AP iterates the FS algorithm until convergence is reached). c. The FS algorithm and frequency utilization: Testbed A is fairly dense in terms of AP placement: The average AP degree is 5, and the maximum is 9, counting only AP-to-AP links. We observe that with FS, only six channels7 were used with 802.11a, and that was enough to isolate overlapping APs. Does the FS algorithm miss an opportunity to further improve its performance by not using the unused frequencies? The answer is no. We conducted additional experiments using the unused orthogonal channels. 6Here, we use channel 1 for 802.11g and channel 56 for 802.11a in our experiments. We have also experimented with other channels, and the experiments verified the reported results. 7There are eight nonoverlapping 802.11a channels for North America: 36, 40, 44, 48, 52, 56, 60, and 64.
5
Fig. 2. Comparison between FS in isolation, RCS, and single channel selection, for 802.11a as well as 802.11g.
In particular, we identified APs with the same frequency and set them to different frequencies chosen from this unused set. Our measurements indicate that the throughput improvement was minimal, approximately 0.06%. In contrast, with 802.11g, all three available orthogonal channels were used, and that was not enough to completely isolate the APs. Clearly, the density and the structure of the topology defines the number of necessary frequencies. d. APs may suffer interference from each other, even when set to orthogonal 802.11a frequencies: The FS algorithm may assign two consecutive orthogonal 802.11a channels to two neighbor APs under the assumption that they do not interfere with each other. As an example, in a certain experiment, AP47 selected frequency 5.26 GHz, and a close neighbor AP60 selected frequency 5.28 GHz. We observed that when AP60 sent traffic, the throughputs enjoyed by AP47’s clients dropped dramatically (Fig. 3). We repeated the same experiment with a set of Atheros-based WiFi cards (EMP-8602 6G) and observed the same behavior (thus, the behavior is not hardware-specific). We ensured that the observed drop in Fig. 3 was not due to interference from APs in colocated WLANs; AP47 was the only AP using frequency 5.26 GHz in the neighborhood. The spillage between consecutive orthogonal channels is approximately on the order of 38 dB [14]. When nodes on such consecutive channels are close, there is very little path loss, and thus, this leakage is strong enough to activate the carrier-sensing at the MAC layer. e. Going beyond orthogonality in selecting frequencies: Our experiments suggest that APs whose mutual RSSI is of the order of 40 dBm, should be assigned channels that are separated by at least 40 MHz (as an example, channels centered at 5.22 and 5.26 GHz). We observed that with this separation, even very closely located APs (RSSI higher than 35 dBm) never interfere with each other. We are interested in observing the difference in performance, if the selected (by the FS algorithm) set of 802.11a channels is rearranged among the APs, such that the above frequency separation is applied for closely located APs. For this, we first run the FS algorithm until convergence is reached. We then manually perform a channel reassignment such that APs that are in close proximity ensured to use distant frequencies. We
Authorized licensed use limited to: Alcatel-Lucent. Downloaded on January 19, 2010 at 17:05 from IEEE Xplore. Restrictions apply.
This article has been accepted for inclusion in a future issue of this journal. Content is final as presented, with the exception of pagination. 6
IEEE/ACM TRANSACTIONS ON NETWORKING
Fig. 3. Interference from AP 60 to the cell of AP 47. The X axis shows the progression in time, in units of 30 s.
also verify that APs that are likely to interfere are on different channels. We compare the performance of this refined assignment with that of the FS algorithm, and we observe an improvement of 24% in the network throughput on average. Note that this is also an indication of why experimenting with large-scale testbeds is beneficial. In a small-scale testbed, the few APs are more likely to select channels with frequency separation larger than 40 MHz, and thus, we would not have observed this phenomenon. C. User Association Here, we seek to evaluate the benefits of the UA algorithm. We compare this to a strategy where clients affiliate with the AP that provides the strongest signal, which is the default behavior as explained earlier. We consider the UA algorithm first in isolation and second in conjunction with the FS algorithm. The key observations based on these experiments are: • Load balancing of user affiliations is beneficial only when the inter-AP contention is limited. • The use of the UA algorithm improves throughput as compared to default behavior (strongest-signal based affiliation). • Poor AP-to-client link quality can negatively impact UA. Implementation Details: The activation procedure is the same as in the previous case, i.e., we first activate all the APs, and then activate the clients randomly, one every 100 s. Note that in testbed A, UA converges in five iterations on average (per client). The UA algorithm requires modifications in the AP driver and firmware, as well as in the client driver. 1) Computing the ATD metric: At the firmware level, we measure the time between queueing a packet at the MAC layer until an ACK (from the client to which the packet is destined) is received. The driver retrieves this duration from the firmware and calculates the average transmission delay to serve one round of users [3], [15]. 2) Assessing the channel access time: The channel access time is the fraction of time for which the AP has access to the medium; this depends on the level of contention in the neighborhood. At the firmware, we measure the number of slots that the AP is: a) transmitting or receiving; b) idle; and c) in the back-off state. The measurement period involves five transmission/reception events. These measurements are used by the driver to estimate the channel access time, i.e., the fraction of a reference period, during which the AP succeeds in gaining access to the medium, given its contenders.
3) Beacon modifications: We modify the beacon template to include the ATD of the AP, the number of clients associated with the particular AP, and the channel access time measured at that AP. 4) Client AP selection: The client driver is modified to recognize the additional beacon fields and use them in its association decision according to (3). We present our experiments and their interpretations. a. Inefficiencies in scanning for APs: In our experiments, we observed several cases wherein clients remained affiliated with an AP, while they should have associated with less-loaded neighbor APs. This is due to beacon losses during the scanning phase (due to small band dwell times and/or due to poor link qualities). Thus, the UA implementation should base its decision on more than one scanning cycle to avoid suboptimal affiliation decisions. b. In isolation, UA is beneficial only for 802.11a and not for 802.11g in a dense WLAN: First, we consider the use of a single frequency channel with the UA algorithm. There are two factors that affect the throughput that a client can receive from an AP: 1) the load of the AP; and 2) the contention among the neighboring APs. By associating with a lightly loaded AP, a client can expect an improvement in performance. However, if the newly selected AP has to contend with many other neighbor APs, the change may not improve the performance for that client. With 802.11g, cells are larger, while with 802.11a, the cell size is smaller. Due to this, with 802.11a, UA provides about a 34% improvement with respect to the strongest signal affiliation decision, while with 802.11g, the improvement is only about 1%, as shown in Fig. 4. Without the UA algorithm, a client associates with the AP that offers the best RSSI value. This, however, results in overloading some APs, while other APs are underutilized and in some cases remain unused. With the UA algorithm, each client associates with the AP that provides the minimum long-term delay as per (3), which considers the load of an AP in addition to the signal quality from the AP. We observed that without UA, four APs had to serve five clients each out of the 30 clients, while eight of the 21 APs had no clients at all! With UA, each APs had to serve two clients on average, while at most three clients were associated with an AP. c. When both FS and UA are applied, the overall network throughput becomes much higher than if one were to add the throughputs in the isolated cases: Results from an indicative experiment are shown in Fig. 5; the CDF of the client throughputs based on all performed experiments is shown in Fig. 6. The observed boost in the throughput is due to the fact that UA is able to exploit the significant reduction in the interference experienced by the clients and the contention for the medium between APs, due to FS. Since 802.11a supports a large number of orthogonal channels (as compared to 802.11g), the improvements are more dramatic in this case.
D. Power Control Next, we consider the power control algorithm, PC, which was outlined earlier. We evaluate PC in isolation as well as in
Authorized licensed use limited to: Alcatel-Lucent. Downloaded on January 19, 2010 at 17:05 from IEEE Xplore. Restrictions apply.
This article has been accepted for inclusion in a future issue of this journal. Content is final as presented, with the exception of pagination. BROUSTIS et al.: MDG FOR 802.11 WLAN DESIGN
Fig. 4. Comparison between UA in isolation and strongest-signal affiliation for both 802.11a and 802.11g.
Fig. 5. UA provides higher benefits when contention and interference are low.
Fig. 6. Empirical CDF of client throughputs, with and without the UA, for the case of FS in 802.11a.
conjunction with the other two algorithms. Our key observations are summarized here. • Power control is only beneficial if intelligent frequency selection is first applied on the network. • The benefits are minimal in 802.11a since frequency selection resolves most of the contention for the considered density of deployment; the benefits are more pronounced with 802.11g. • Blindly applying the three algorithms might hurt performance; the choice of what to apply should be carefully assessed. Implementation Details: We perform modifications to the driver to allow APs to exchange information through their beacon frames in order to identify optimal transmission power and CCA values (as per the PC algorithm [2]). The clients use the same transmission power and CCA as their AP. Note that PC converges in 200 iterations in Testbed A (each iteration taking place at the beacon time granularity, i.e., 100 ms). We present our experiments and observations. a. Understanding when PC can shrink and isolate cells: The intent of the PC algorithm is to tune the transmission power and CCA settings in order to balance the reduction in interference to other co-channel APs, and the
7
reduction in signal quality to the weakest client, while ensuring symmetry in the contention domains across the network [2]. Our first set of experiments determines the conditions under which PC can improve performance. Our observations lead to classifying the relationship in terms of signal strength between AP–client and AP–AP links into five cases. In the first two cases, PC is able to tune its power/CCA levels to improve the network capacity. In the other three cases, its application cannot provide any improvement. In other words, the optimal strategy is to apply the default8 power/CCA settings. To simplify the following descriptions for each case, we consider two neighboring APs with one client each. Note that we will refer to the cases below when we discuss the PC algorithm in the rest of this paper. Case (a): The AP–client link is strong dBm , and the AP–AP link is weaker by dBm ( to 20 dBm for our cards) [Fig. 8(a)]. In this case, the APs manage to shrink their cells to the extent that they transmit concurrently. Since the inter-AP links are much weaker than the AP-to-client links, each AP can reduce its transmission power without degrading the performance to its clients. In our experiments, we observe that the difference in the link quality between the AP–client link and the AP–AP link ought to be on the order of 15 dBm with our cards; if this difference is lower, then we observe that the links conform to case (e). Case (b): Both AP–AP and AP–client links are strong dBm . In this case, a complete isolation between cells is impossible with a reduction in power [Fig. 8(b)]; thus, the APs transmit with maximum power. However, we observe that the APs can increase their CCA thresholds to a high value and thereby ignore each other’s signals, i.e., carrier sensing is ignored. Upon closer inspection, we determine that the clients were able to receive a throughput that was higher than what they would have received if the two APs were operating in mutual exclusion (due to carrier sensing). This setting (where APs increase their CCAs only) has also been shown to enhance performance in [16]. Case (c): The AP–AP link is stronger than the AP–client link, irrespective of the absolute RSSI values. Here, the PC algorithm cannot shrink the cells [Fig. 8(c)], and hence, the default power settings are again applied. Furthermore, since increasing the CCA threshold to isolate the neighbor AP would result in the isolation of some of its own clients, the AP does not do so. Case (d): The AP–client link is weak dBm , and the AP–AP link is even weaker dBm . In this case, the [Fig. 8(d)] by dBm AP–client link cannot sustain a high rate if the power is reduced; it is essentially isolated from the network if the CCA is increased beyond its default setting. Case (e): The AP–client link is stronger by dBm than the AP–AP link, where dBm). If the 8The default power is the maximum permissible power by the WiFi cards. In our system, the default CCA threshold is 80 dBm.
Authorized licensed use limited to: Alcatel-Lucent. Downloaded on January 19, 2010 at 17:05 from IEEE Xplore. Restrictions apply.
0
This article has been accepted for inclusion in a future issue of this journal. Content is final as presented, with the exception of pagination. 8
IEEE/ACM TRANSACTIONS ON NETWORKING
Fig. 7. Since contention and interference are high in 802.11g, power control provides higher benefits. TABLE I LINK GAINS AND POWER/CCA SETTINGS IN dBm
AP–AP link is comparable to the AP–client link (say 12 dBm difference), then by either reducing the transmission power or by increasing the CCA threshold, an AP cannot effectively isolate the two cells [Fig. 8(e)]. Thus, PC sets default settings in this case. We mainly observe cases (a), (c), and (e) in our testbed; the cases pertaining to (b) and (d) are rarely observed and only for short time periods. Power Control Provides Benefits Even When Cells Overlap: Recall that PC assumes that typically the RSSI of a client at its AP is stronger than the AP–AP RSSI from a neighbor AP [2]. Even though this is generally common in wireless deployments nowadays, in some dense indoor scenarios, this may not be the case. As an example, consider the scenario where UA has already been applied, potentially creating long AP–client links. In such a case, it is possible that the RSSI from a client to its AP is weaker than the AP–AP RSSI from a neighbor co-channel AP. This creates many case (c) topologies, thus “restricting” PC from shrinking co-channel cells (as we explain later in detail). Note, however, that in some specific cases, even if the PC algorithm is unable to isolate cells, it yields capacity benefits. We present an experiment wherein only the four co-channel access points 25, 60, 47, and 43 are active. All four access points contend for the medium when using the default power and CCA. The AP–AP and AP–client link gains and the power and CCA settings with PC are tabulated in Table I. Our measurements indicate that PC only isolates AP43 and AP25; it is unable to completely isolate AP47 and AP60. In particular, when AP47 transmits, the throughput of AP60 is significantly reduced from its nominal value. This effect is depicted in Fig. 9. The reduction in throughput of AP60 occurs while AP47 transmits. When AP47 stops transmitting, all the other three APs return to achieving higher performance. Thus, in this case, even though applying the power control improves the overall throughput, it does not provide perfect isolation between APs. Note here that our attempts to completely isolate the four APs using a trial-and-error process to tune the settings proved to be unsuccessful! These cases are not apparent if one were to do limited experimentation with small testbeds. With such testbeds, the possibility that the APs are far apart with few clients in their close proximity is high. This would suggest that irrespective of
whether or not FS is used, the links always conform to case (a), and thereby it would seem that PC is always beneficial. b. PC may not provide benefits without FS: First, we consider PC with a single frequency channel and user association as per the strongest received signal. We observe that without FS, links that fall under cases (c) and (e) (described above) always exist. Thus, PC is not able to shrink the co-channel cells. Since the algorithm mandates that APs that belong to the same connected network must have the same product of power and CCA to avoid starvation effects [2], all the APs will use the default power and CCA settings in this case. This observation holds for both 802.11g and 802.11a. c. Without FS, PC may not provide benefits even in conjunction with UA: In our experiments, with the UA algorithm, the AP–client links could become worse than before since now some of the clients choose APs with lighter loads even if the signal quality is poorer. Hence, even more links that fall under cases (c) and (e) may be created. This makes it even harder for PC to shrink overlapping cells. d. Frequency selection aids PC: Recall that frequency selection assigns different channels to neighboring cells so that APs with the same frequency are farther away and the interference (signal strength) is reduced. This provides an opportunity for PC to further reduce contention since links now conform to the conditions of case (a). The application of PC after FS can successfully yield smaller cells and, thus, eliminate or reduce overlaps between cells. In particular, since the FS algorithm may not completely isolate cells, overlaps do exist. The use of PC helps significantly since many of these links conform to the conditions of case (a). These benefits are more pronounced with 802.11g, where given the long range and small number of orthogonal channels, FS cannot completely isolate cells by itself. Although the benefits are less pronounced with 802.11a, given that it has a larger number of orthogonal channels and shorter links, they are significant. We observe that with 802.11a, there were only two pairs of interfering APs that shared the same channel; PC is applied on these co-channel cells only. Fig. 7 depicts the observed performance benefits from PC with FS for the different 802.11 modes of operation. We wish to point out that PC was unable to shrink co-channel cells when administered in conjunction with RCS (10 different random channel settings were considered). We observed that in all 10 topologies, cases (c) and mostly (e) were present. We expect, however, that there exist random channel allocations where PC is likely to yield benefits. This once again points to the importance of using large-scale testbeds. With a small-scale testbed, one cannot quantify the extent to which partial overlap among cells exists after PC. e. Blindly applying all three algorithms is not a “good idea”: Due to the interdependencies of the algorithms, we need to carefully select which algorithms to apply to maximize the performance. For example, the PC algorithm provides improvements only in cases (a) and (b). However, the application of UA might create links that conform to cases (c) and/or (e), and this causes the PC al-
Authorized licensed use limited to: Alcatel-Lucent. Downloaded on January 19, 2010 at 17:05 from IEEE Xplore. Restrictions apply.
This article has been accepted for inclusion in a future issue of this journal. Content is final as presented, with the exception of pagination. BROUSTIS et al.: MDG FOR 802.11 WLAN DESIGN
>0
9
k
Fig. 8. Case (a): AP–client link is strong ( 55 dBm), and AP–AP link is weaker by at least dBm. Case (b): AP–client and AP–AP links are strong ( 55 dBm); they only increase their CCA. Case (c): AP–client link weaker than AP–AP link; PC cannot shrink cells. Case (d): AP–client links are quite poor; no reduction in power or increment in CCA is possible. Case (e): AP–client links not much stronger than AP–AP links; isolation is impossible.
>0
Fig. 9. Power control does not provide perfect isolation at all times. In the depicted scenario, AP25 and AP43 operate in isolation after PC. However, the clients of AP60 are still affected.
Fig. 10. Blindly applying all algorithms may degrade the performance.
gorithm to provide default power/CCA settings. The results with such a scenario are depicted in Fig. 10 for 802.11g; by applying all three algorithms, the achieved network capacity is 24% lower than if we apply FS and PC only. Note, however, that such an effect may not always occur. Our measurements indicate that the UA algorithm, in some cases, results in a few relatively strong AP–client links. This is due to the fact that the clients with weak links are likely to migrate to neighbor APs that are typically on a different channel. Thus, their old APs will be left with fewer, stronger AP–client links. In fact, by repeating the same experiment on a different day, we observed that the combination of the three algorithms boosted the network capacity by 274% with respect to the default case (and 22% as compared to the next best combination) for 802.11g and 142% for 802.11a. IV. A FORMAL METHOD FOR ENABLING THE ALGORITHMS In this section, we formulate our comprehensive network configuration framework, MDG, which is based on our observations from the previous section. MDG can be thought of as a decision framework, which takes a small set of measurements as input and decides which algorithms to apply and in what order. The goal of MDG is to apply algorithms only if specific conditions are met, which suggest that the algorithms will provide performance benefits, are met. FS is considered first since the channel allocation determines the channel access time for each AP (considered by UA) as well as the AP–AP link strengths (considered
by PC). MDG is represented as a flow diagram in Fig. 11 and is described in detail here. Inputs to MDG: MDG requires the following measurementbased information to make its decisions: 1) whether overlapping cells using the same channel exist so as to apply FS; 2) whether overloaded APs exist so as to run UA; 3) whether or not AP–client and AP–AP links fall under cases (a) and (b), (Section III-E) so as to apply PC. Note here that if MDG is jointly applied by collocated cooperative WLANs, UA only permits clients to affiliate with the APs of their WLAN. For clarity, we do not account for this case in our flow diagram. MDG Decision States: We describe the decision states in more detail. Checking if FS, PC, and UA are beneficial: Steps (1) and (2). These steps are based on the following observations: a) if no AP contention exists, FS and PC are unnecessary; and 2) if the load in the network is perfectly balanced among the APs, UA is unnecessary. Step (1) is related to the first observation, and Step (2) to the second. Note that our criterion for invoking UA assumes uniform demands across users and tests if an AP has at least two more clients than any other AP. (Note that if the user demands for service vary, we could define the load of an AP to reflect the bandwidth requirements instead of the number of clients). Choosing between PC and UA: Steps (3) and (4). If the FS algorithm resolves any remaining contention (Step (3) in the flow chart), then PC is not needed; we only need to check if UA is required as per Step (2). If there is still contention on any channel (due to the existence of co-channel devices), then the further steps depend on whether the network employs 802.11a or 802.11g at Step (4). For the case of 802.11a, we proceed to Step (6a), while for the case of 802.11g, we proceed to Step (5a). The justification behind such a choice is provided. The case for 802.11a: Steps (6a) and (6c). These steps are based on a few key observations from Section III. First, we recall the following two observations: 1) applying FS with 802.11a resolves almost all contention and interference given the large number of orthogonal channels; and 2) in scenarios where con-
Authorized licensed use limited to: Alcatel-Lucent. Downloaded on January 19, 2010 at 17:05 from IEEE Xplore. Restrictions apply.
This article has been accepted for inclusion in a future issue of this journal. Content is final as presented, with the exception of pagination. 10
IEEE/ACM TRANSACTIONS ON NETWORKING
Fig. 11. The MDG framework: design guidelines for both 802.11a and 802.11g. The shaded part corresponds to 802.11a, while the dashed one to 802.11g.
tention and interference are limited, it is preferrable to apply the UA algorithm rather than the PC algorithm. The two observations together suggest that UA is to be applied in this case if overloaded APs exist; this corresponds to Step (6a). If the loads are perfectly balanced, we directly try to apply the PC algorithm and proceed to Step (6b). If UA is applied, it is possible that PC can be subsequently applied; at Step (6c), we check to see if all the links conform to either case (a) or case (b) (as discussed in Section III), and if this is the case, we apply PC. The case for 802.11g: Steps (5b), (5c), and (5d). The key observations that drive the states in this part of the flow chart are: 1) due to the limited number of orthogonal channels in the 2.4-GHz band, FS is not expected to eliminate contention and interference in high-density deployments with 802.11g; and 2) the use of PC subsequent to FS helps in significantly improving performance with 802.11g. Based on these observations, we apply PC (in lieu of UA) right after FS. However, since contention and interference are at high levels even after the use of FS in 802.11g, we first have to determine if the co-channel APs can shrink their cells, i.e., if PC will provide nondefault power/CCA settings (step (5b) in the flow chart). Note that PC may not be able to shrink the cells for every channel. Thus, we apply the PC algorithm only on those channels where PC can be beneficial. If PC is not expected to provide any benefits on any channel, we proceed to consider the UA algorithm at step (5c). If there is an imbalance in the user associations across APs and UA is applied, the topology changes and may now become conducive for PC. Thus, we check if PC can be applied, again, at step 5(d). Accounting for the presence of other WLANs: Steps (5a) and (6b). So far, we have assumed that all the WLANs in the deployment apply MDG. However, in a real environment, we expect the existence of WLANs that do not follow MDG or are not willing to cooperate. The interference from these collocated WLANs will influence the decision process. In this case, the algorithms will operate as follows: • FS: Each AP will take into account the signal strength received from all co-channel APs (not only the APs belonging to the considered network). • UA: The clients belonging to our network associate with APs of a certain ESSID. Hence, they will not affiliate with other networks. If there exist other co-channel WLANs, then the medium access time available to an AP is lower
than what can be achieved in the absence of these WLANs. This affects the metric that each client computes for its neighbor APs. • PC: If other WLANs are not running PC, then invoking power control in our network could affect both networks. This is due to possible reduction in the transmission power and/or the increase in the CCA threshold in our network. The reduction in power could hurt the clients in our network; with an increase in the CCA threshold, the APs in our network could potentially ignore transmissions from the other network and cause user starvation. Thus, the application of PC is precluded if other uncontrolled WLANs exist in the vicinity. This is accounted for in Steps (5a) and (6b). V. VALIDATING OUR GUIDELINES Our next step is to validate our design guidelines on a completely different network (which we refer to as Testbed B). The primary purpose of our validation process is to determine if our design recommendations allow a different wireless network (arbitrary except for identical hardware and software configurations) to operate at high performance levels using an automated procedure, such as MDG. We first describe Testbed B and subsequently describe our validation process. A. Description of the Second Experimental Network Testbed B is deployed on the third floor of the Engineering Building 2 at the University of California, Riverside. The deployment is depicted in Fig. 12. While Testbed B has the same hardware and software configuration as that of Testbed A, it is considerably different in terms of the network layout and the topology; the environmental conditions are also significantly different. In particular, Testbed B differs from Testbed A in the following aspects: 1) Network scale: It consists of eight APs and 20 clients; the network is deployed in the third floor of a different building and in a different organization. 2) Environmental conditions: The climatic conditions differ; the temperature is higher and the humidity is much lower. This affects the channel quality [17]. 3) Building materials: The walls in the second building are supported by thick metallic skeletons, and many of them
Authorized licensed use limited to: Alcatel-Lucent. Downloaded on January 19, 2010 at 17:05 from IEEE Xplore. Restrictions apply.
This article has been accepted for inclusion in a future issue of this journal. Content is final as presented, with the exception of pagination. BROUSTIS et al.: MDG FOR 802.11 WLAN DESIGN
11
Fig. 13. Comparison between the decision of the flow chart and all other possible paths for 802.11a.
Fig. 12. Deployment of Testbed B. The circles represent the clients, while the squares are the APs.
are made of brick. This degrades the signal strength on a subset of the links where no direct line of sight exists. 4) Node locations: Unlike Testbed A, the eight APs are not placed inside network closets given that access was prohibited to many of the building’s facilities. The AP placement strategy, however, ensures coverage to the 20 clients. B. Validation Methodology We apply the MDG framework on Testbed B in the following way. • Calibration: We provide MDG with a set of input parameters based on a limited set of measurements. • Application: We follow the guidelines from the framework with regard to which algorithms to enable. • Evaluation: We measure the network capacity. For comparison, we try all other possible paths through the flowchart and compare their performance against what is achieved by following the guidelines from MDG. In these experiments, we first assume fully saturated UDP downlink traffic. Furthermore, we test the efficiency of MDG with both uplink and TCP traffic. In addition, we repeat the validation during different hours of the day and on different days. Overall, our studies demonstrate that using MDG provides the best network performance. C. Evaluating MDG With Downlink UDP Traffic We first examine the network performance with MDG for both 802.11a and 802.11g and for the case of fully saturated UDP traffic from the APs to their clients. 1) The Case for 802.11a: From our initial measurements on the network (used to calibrate and apply our guidelines), we observe that: a) there exists a pair of contending APs that share the same channel (AP50 and AP31 are on channel 64); b) AP50 has two more clients than AP31, and AP42 has two more clients than AP44. Given these observations, we follow the flow diagram in Fig. 11 to determine and apply the right choice of algorithms. Since there are contending APs on at least one channel, we run the FS algorithm, as per step (1), and we proceed to step (3) in the flow diagram. We observe that FS has isolated all cells using a set of five orthogonal channels. Hence, we go to step (2), as per the flow diagram. Since AP50 has two more clients than AP31,
we further apply the UA algorithm. Consequently, the path that . we follow in the flow chart is: Fig. 13 depicts the observed performance in terms of overall network throughput. We compare the results with all other paths through the flow chart (each possibility is represented by the steps that are followed in the flow diagram) and observe that the use of the guidelines yields the best results. Since the channel conditions may vary with time, the above procedure must be repeated. The frequency of repetition depends on the extent to which the environment is static. We would expect that the MDG input measurements could be collected at frequent intervals. Reconfiguration should, however, balance the incremental gains against the associated overhead. We repeated the above procedure (initial measurements for calibration) on a different day and we observed that FS did not completely isolate cells as before. In particular, we observed that: a) after the convergence of the FS algorithm, the access points AP31 and AP48 (which are in close proximity) selected the same channel (5.32 GHz); b) AP50 had two more clients than AP31; c) AP48 had four clients, and the RSSI from its farthest client, 40–48, was at 69 dBm, while the RSSI for the AP–AP link 48–31 was at 70 dBm. With this, the flow diagram suggests that we first follow the path: . At step (6b), after running the UA algorithm, we observed that the client 41 decided to associate with AP45, and that now AP48 was left with three clients; the RSSI from the farthest of these clients was at 44 dBm. As a result, we further proceeded with applying the PC algorithm, as per step (6c). Consequently in this case, the path that we followed in the flow diagram was: . Fig. 14 depicts the performance enhancements in terms of overall network throughput. As in the previous case, the set of steps followed by MDG (the top stripe) yields the best performance (as compared to any other possible sequence of actions). 2) The Case for 802.11g: As in the case of 802.11a, we begin with a set of preliminary measurements that are used to drive the flow diagram. This set of measurements indicates that: a) there are many co-channel APs; b) AP50, AP48, and AP42 have two more clients than all other APs; 3) AP50 and AP48 each have a very poor link with one of their clients, and the links fall under case (c). By following our guidelines, we start at step (1) in the flow diagram and proceed to step (3), wherein we observe that there are four interfering APs on channel 1 (APs 42, 44, 46, and 48), two on channel 6 (APs 50 and 31), and two noninterfering APs on channel 11 (APs 36 and 45). Thus, we further go to step (4) of the flow diagram; since we use 802.11g, we visit step (5a).
Authorized licensed use limited to: Alcatel-Lucent. Downloaded on January 19, 2010 at 17:05 from IEEE Xplore. Restrictions apply.
This article has been accepted for inclusion in a future issue of this journal. Content is final as presented, with the exception of pagination. 12
IEEE/ACM TRANSACTIONS ON NETWORKING
Fig. 14. Predominance of flow chart’s decision for the case wherein the FS algorithm does not isolate all cells in 802.11a.
Fig. 15. Comparison between the flow chart’s decision against any other potential sequence of actions for the case of 802.11g.
Since AP48 and AP50 maintain client links that fall under case (c), we do not run the PC algorithm, but proceed to step (5c). Since some APs have two more clients than others, we run the UA algorithm and further go to step (5d). Here, we observe that after the UA convergence, all AP–AP links are much weaker than all AP–client links, on channel 1. However, on channel 11, this is not the case. Hence, we apply the PC algorithm only on channel 1. Note that in this case, we make different decisions for the different channels. For channel 1, the path that we follow is: . The paths followed for the other two channels are similar to the first; however, we stop after applying the UA algorithm. Fig. 15 plots the network performance with the steps recommended by our guidelines (the top stripe); it also depicts the performance when following any other decision path. We conclude that our method outperforms any other potential order with different combinations specifying which algorithms to apply and when. In Testbed B, in the case of 802.11g, the performance improvement with MDG, as compared to the default case, is 103%. In this case, due to the limited number of orthogonal channels, the performance with the default case is really poor. In 802.11a, the improvement with MDG is only 24%; this is because RCS (default case) yields significant benefits since the number of APs is smaller than the available channels. D. Experiments With Uplink UDP Traffic The purpose of these experiments is to examine whether our guidelines are beneficial when the traffic direction is from the clients to their APs. Recall that the optimization algorithms that are applied this study assume fully saturated downlink traffic. We consider scenarios with both 802.11a and 802.11g, wherein the clients (only) send data to their APs. In particular, this set of experiments consists of two steps: 1) We employ only downlink traffic until the convergence states
of the algorithms are reached. 2) The downlink traffic is then stopped and the clients transmit fully saturated traffic to their APs; the clients initiate their traffic sessions at random points in time, as before. We measure the total network throughput in the same way as before. Fig. 16 depicts the results for both 802.11a and 802.11g. We observe that the guidelines suggested by MDG outperform any other possible combination of the algorithms, demonstrating its applicability in uplink scenarios. 1) Downlink Versus Uplink: Comparing the Performance: A cross examination of Figs. 14–16 shows that the total network throughput is lower in uplink traffic scenarios in all cases. This is somewhat expected, given the design philosophies of the FS, UA, and PC described in Section II. The design of each of the three algorithms assumes that the direction of the traffic is from the APs to their clients, i.e., the APs are always the transmitters and their clients are the receivers of data packets. Hence, when uplink traffic is considered, the following “effects” appear in the network: • FS: Each AP scans the medium for other APs and selects the channel with the minimum received power from all potentially interfering neighbor APs. However, this does not capture the actual interference on a channel since the transmissions of clients are ignored; note also that typically the number of clients (in total) is much higher than the number of APs (as in our testbeds). In other words, with FS each AP does not gather complete information on each channel in uplink scenarios. Note, however, that the channel assignment itself still offers advantages since many potentially interfering clients (transmitters) are still set to different channels. The impact is evident if one looks at the path in Figs. 14 and 16 (for 802.11a); FS provides a downlink throughput of 85 Mbps, whereas it only provides 68 Mbps in the opposite direction. • UA: As described in section Section II, the metric used to guide the user associations does not only incorporate interference from neighboring co-channel APs, but all transmissions that reduce the access probability of the AP that carries out the measurements. As a result, UA can capture the impact of uplink transmissions that may interfere and may be in partially overlapping channels. However, such a workload needs to be introduced in the training phase of the algorithm. If downlink traffic is used for training, then, as seen in Figs. 14–16, UA alone or combinations of UA with other algorithms provide lower throughput benefits for uplink traffic! • PC: PC tries to minimize the interference from neighbor cells, by shrinking the cells of APs. However, PC uses the assumption that the interference around the client is the same as that around the AP. This assumption, however, may not be accurate in real deployments and thus, interference due to uplink traffic may not be entirely captured by the PC algorithm operations. E. Experiments With TCP Traffic In order to examine the network behavior with different types of traffic, we perform experiments with TCP uplink and downlink flows as well. To begin with, our measurements indicate that as long as the per-link data traffic is fully saturated downlink, the topology at the convergence state of the algorithms is
Authorized licensed use limited to: Alcatel-Lucent. Downloaded on January 19, 2010 at 17:05 from IEEE Xplore. Restrictions apply.
This article has been accepted for inclusion in a future issue of this journal. Content is final as presented, with the exception of pagination. BROUSTIS et al.: MDG FOR 802.11 WLAN DESIGN
Fig. 16. MDG provides the best network performance with uplink UDP traffic conditions for both (left) 802.11a and (right) 802.11g.
Fig. 17. MDG suggests the most efficient combination in scenarios with downlink TCP traffic for both (left) 802.11a and (right) 802.11g.
Fig. 18. The network throughput is the highest with MDG in scenarios with uplink TCP traffic for both (left) 802.11a and (right) 802.11g.
independent of whether TCP or UDP is adopted. We perform aggregate throughput measurements, as done previously. We observe that, even though TCP generally reduces the throughput (as compared to UDP) due to the adaptation of the TCP congestion window in response to losses, the MDG framework still seems to guide us to the best combination of the optimization approaches. Figs. 17 and 18 depict the results for downlink and uplink, respectively, for both 802.11a and 802.11g. Notice in Figs. 16 and 18 that when UA is applied in isolation, it degrades the network performance for 802.11g. As explained, the reasons for this behavior are due to the downlink traffic assumptions of UA in conjunction with the high level of contention in the network. F. Evaluating MDG in the Presence of External Interference In the last set of our experiments, we have two objectives. First, we wish to study the performance of MDG in the presence of external interferers. Second, we seek to determine how good the performance of the MDG-derived network configuration is compared to any other possible network configuration (in terms of frequency, power, and user associations). Toward our first objective, we perform a new series of experiments with 802.11g on testbed B during regular business hours. To fulfil our second goal, we consider 40 randomly perturbed network configurations with regard to our three dimensions i.e., frequency,
13
Fig. 19. The proper combination of the three algorithms FS, UA, and PC provides the highest benefit, as compared to the 10 best (out of the 40) network configurations.
user association space, and power. Specifically, we set up each experiment as follows: • Each AP randomly selects an orthogonal channel. • Each client randomly affiliates with a neighbor AP. • Each AP randomly sets its transmission power and CCA threshold while verifying that the connectivity to its clients is maintained and that the product of CCA and power remains constant across the network. This is because we want to ensure that there are no starvation effects due to asymmetry [2]. • Each client uses the same values of transmission power and CCA as its affiliated AP. This set of experiments involves fully saturated downlink UDP traffic; the experiments are performed in the same way, as described in Section III. Fig. 19 presents the performance with MDG and with the 10 best random network configurations. To begin with, we observe that external interference was present during our experiments. The network capacity with MDG is reduced by 11%, as compared to the capacity achieved with MDG during overnight experiments. Second, we observe that MDG outperforms all other tested network configurations by at least 43%. Although this may be far from an exhaustive search of all possible network configurations, the results suggest that MDG is likely to provide a configuration that yields high performance. In [18], we also provide discussions with regard to the independence of MDG from the specific algorithms, convergence issues, overheads, and frequency of invocation, as well as a potential integrated optimization approach. VI. CONCLUSION We design, implement, and evaluate a measurement-driven framework, MDG, which maximizes the synergy between three interdependent optimization dimensions: frequency selection, user association, and power control. In our study, we use three previously designed algorithms for interference mitigation in each dimension and two distinct wireless testbeds: a learning testbed and a validation testbed. First, we develop insight into the interdependencies of the optimization algorithms and identify useful thresholds and conditions of when each algorithm should be applied. This leads us to the MDG framework, which combines the three approaches such that they provide the highest possible benefits compared to any other possible combination. MDG can be a useful tool for wireless network management in production WLANs. It can operate in an adaptive and distributed way at each AP or in a centralized fashion. Note that MDG can be executed by APs that may not belong to the same network, as long as the APs from all networks cooperate.
Authorized licensed use limited to: Alcatel-Lucent. Downloaded on January 19, 2010 at 17:05 from IEEE Xplore. Restrictions apply.
This article has been accepted for inclusion in a future issue of this journal. Content is final as presented, with the exception of pagination. 14
IEEE/ACM TRANSACTIONS ON NETWORKING
REFERENCES [1] A. Akella, G. Judd, S. Seshan, and P. Steenkiste, “Self-management in chaotic wireless deployments,” in Proc. ACM MobiCom, 2005, pp. 185–199. [2] V. Mhatre, K. Papagiannaki, and F. Baccelli, “Interference mitigation through power control in high density 802.11 WLANs,” in Proc. IEEE INFOCOM, 2007, pp. 535–543. [3] B. Kauffmann, F. Baccelli, A. Chainteau, V. Mhatre, K. Papagiannaki, and C. Diot, “Measurement-based self organization of interfering 802.11 wireless access networks,” in Proc. IEEE INFOCOM, 2007, pp. 1451–1459. [4] J. Fuemmeler, N. Vaidya, and V. V. Veeravalli, “Selecting transmit powers and carrier sense thresholds for CSMA protocols,” Tech. Rep. Univ. Illinois at Urbana-Champaign, Oct. 2004. [5] I. Broustis, J. Eriksson, S. V. Krishnamurthy, and M. Faloutsos, “A blueprint for a manageable and affordable wireless testbed: Design, pitfalls and lessons learned,” in Proc. IEEE TridentCom, 2007, pp. 1–6. [6] A. Mishra, V. Shrivastava, D. Agarwal, and S. Banerjee, “Distributed channel management in uncoordinated wireless environments,” in Proc. ACM MobiCom, 2006, pp. 170–181. [7] J. Geier, “Assigning 802.11b access point channels,” in Proc. WiFi Planet, 2002 [Online]. Available: http://www.wi-fiplanet.com/tutorials/article.php/972261 [8] P. Bremaud, Markov Chains, Gibbs Field, Monte Carlo Simulation and Queues. New York: Springer-Verlag, 1999. [9] L. Massoulié and J. Roberts, “Bandwidth sharing: Objectives and algorithms,” IEEE/ACM Trans. Netw., vol. 10, no. 3, pp. 320–328, Jun. 2002. [10] A. Mishra, V. Brik, S. Banerjee, A. Srinivasan, and W. Arbaugh, “A client-driven approach for channel management in wireless LANs,” in Proc. IEEE INFOCOM, 2006, pp. 1–12. [11] N. Ahmed and S. Keshav, “SMARTA: A self-managing architecture for thin access points,” in Proc. ACM CoNEXT, 2006, Article no. 9. [12] M. Heusse, F. Rousseau, G. Berger-Sabbatel, and A. Duda, “Performance anomaly of 802.11b,” in Proc. IEEE INFOCOM, 2003, vol. 2, pp. 836–843. [13] S. Vasudevan, K. Papagiannaki, C. Diot, J. Kurose, and D. Towsley, “Facilitating access point selection in IEEE 802.11 wireless networks,” in Proc. ACM IMC, 2005, p. 26. [14] J. Yee and H. P-Esfahani, “Understanding wireless LAN performance tradeoffs,” 2002 [Online]. Available: http://www.commsdesign.com [15] K. Sundaresan and K. Papagiannaki, “The need for cross-layer information in access point selection algorithms,” in Proc. ACM IMC, 2006, pp. 257–262. [16] V. Mhatre and K. Papagiannaki, “Optimal design of high-density 802.11 WLANs,” in Proc. ACM CoNEXT, 2006, Article no. 8. [17] B. Krishnamachari, Networking Wireless Sensors. Cambridge, U.K.: Cambridge Univ. Press, 2005. [18] I. Broustis, K. Papagiannaki, S. V. Krishnamurthy, M. Faloutsos, and V. Mhatre, “MDG: Measurement-driven guidelines for 802.11 WLAN design,” in Proc. ACM MobiCom, 2007, pp. 254–265.
Ioannis Broustis (M’08) received the M.Sc. and Ph.D. degrees in computer science and engineering from the University of California, Riverside, and the Diploma in electronics and computer engineering from the Technical University of Crete, Chania, Greece. During 2008, he was a Researcher with the Center for Research and Technology Hellas, Thessaloniki, Greece, as well as an Adjunct Assistant Professor with the University of Thessaly, Volos, Greece. During 2006, he was an intern with Intel Research in Cambridge, U.K., while during 2005, he was an intern with Nokia R&D, Boston, MA. His research interests include cross-layer network protocol design, development, and testbed experimentation for wireless networks.
Konstantina Papagiannaki (M’03) received the first degree in electrical and computer engineering from the National Technical University of Athens (NTUA), Athens, Greece, in October 1998, and the Ph.D. degree from the Computer Science Department, University College London (UCL), London, U.K., in March 2003, receiving the Distinguished Dissertations Award 2003. She has been a Researcher with Intel Labs since January 2004: from 2004 until the end of 2006 in Cambridge, U.K., and since 2007 in Pittsburgh, PA. From the beginning of 2000 through 2003, she was a member of the IP Group at Sprint Advanced Technology Labs. She currently holds an adjunct faculty position with the Computer Science Department, Carnegie Mellon University, Pittsburgh, PA. Dr. Papagiannaki received the ACM SIGCOMM Rising Star Award in 2008.
Srikanth V. Krishnamurthy (SM’07) received the Ph.D. degree in electrical and computer engineering from the University of California at San Diego in 1997. From 1998 to 2000, he was a Research Staff Scientist with the Information Sciences Laboratory, HRL Laboratories, LLC, Malibu, CA. Currently, he is a Professor of Computer Science with the University of California, Riverside. His research interests are primarily in wireless networks, network security, and Internet technologies. He co-edited the book Ad Hoc Networks: Technologies and Protocols (New York: Springer Verlag, 2005). Dr. Krishnamurthy was the recipient of the NSF CAREER Award from ANI in 2003. He is the Associate Editor-in-Chief for ACM MC2RE.
Michalis Faloutsos (M’09) received the Bachelor’s degree from the National Technical University of Athens, Athens, Greece, and the M.Sc. and Ph.D. degrees from the University of Toronto, Toronto, ON, Canada. He is a faculty member with the Computer Science Department, University of California, Riverside. His interests include Internet protocols and measurements, network security, and routing in ad hoc networks. With his two brothers, he co-authored the paper “On powerlaws of the Internet topology” (SIGCOMM ’99), which is in the top 20 Most Cited Papers of 1999. Recently, he has been authoring the popular column “You must be joking. . .” in the ACM SIGCOMM Computer Communication Review. Dr. Faloutsos’ work has been supported by several NSF and DARPA grants, including the prestigious NSF CAREER Award. He is actively involved in the community as a reviewer and a Technical Program Committee member in many conferences and journals.
Vivek P. Mhatre received the B.Tech. degree in electrical engineering from the Indian Institute of Technology, Bombay, India, in August 2000, and the Ph.D. degree in electrical engineering from the School of Electrical and Computer Engineering, Purdue University, West Lafayette, IN, in May 2005. He is a Principal Staff Engineer with Motorola Inc., Arlington Heights, IL. In the past, he has worked at Intel Research, Cambridge, U.K.; Thomson Research, Paris, France; and Alcatel-Lucent’s Bell Labs, Bangalore, India. His research interests include wireline as well as wireless networks with special emphasis on networking protocols and cross-layer optimizations.
Authorized licensed use limited to: Alcatel-Lucent. Downloaded on January 19, 2010 at 17:05 from IEEE Xplore. Restrictions apply.