Vol.7 (2017) No. 3 ISSN: 2088-5334
Merging of Depth Image Between Stereo Camera and Structure Sensor on Robot “FloW” Vision Dadet Pramadihanto#*, Ardiansyah Alfarouq* , Suryo Aji Waskitho*, Sritrusta Sukaridhoto* #
Department of Information and Computer Engineering * EEPIS Robotics Research Center (ER2C) Electronic Engineering Polytechnic Institute of Surabaya, Indonesia E-mail:
[email protected],
[email protected],
[email protected],
[email protected]
Abstract— Human eyes can recognize an object just by looking at the environment; this capability is very useful for designing the reference of a humanoid robot with the ability for adapting to its environment. By knowing the field conditions that exist in such environments, the robot can understand the obstacles or anything that can be passed. To do that, robot’s vision needs to has the knowledge to understand an obstacle that exists around it. Because of these problems, this paper shows a method for reducing the error rate of vacant space in the data depth by combining a stereo camera and structure sensor. Merging the stereo camera and structure sensor can extract depth information becomes dense. The proposed method has been successfully running the whole algorithm that already built and has a density of depth with an average error rate of vacant space is 18.10%. Keywords— humanoid robot; robot vision; RGB-D sensor; depth calibration; computer vision
the structure sensor have a distinct weakness. The stereo vision has a weakness in getting the depth data when a source image in which there is an object that looks great with the same color on the object. This causes the density of the results of the depth image looks tenuous. While the structure sensor has a weakness at some point that does not get a shot laser or may not reflect lasers have been fired, so the data at that point depth data could not be obtained. Because of that problem, by combining the stereo camera and structure sensor can compensate the weakness to get a better depth image. So our main contribution is a method of a system that we built that must be run on the detailed depth image. Many algorithms for matching stereo had been published [1]. Although the algorithm just focused on the accuracy or computation time. Depth data obtained from their process that already proposed but it is still unsatisfied. The defocus cue is the most exciting one. By using it, Pentland initiated depth from defocus (DfD) [2], which then becomes a popular passive depth estimation method. In DfD, depth’s estimation can be done with identify the degree of blur, which is characterized by the extent of point spread function (PSF), throughout the image. In order to overcome the ill-posed of the problem, usually two or more defocused images are captured from the same view with but different known camera settings, so the same object is blurred to different degrees. The resulting different measurements, together with known camera parameters, are sufficient to
I. INTRODUCTION The development of humanoid robots has been growing. In building humanoid robots required a wide variety of sensors that resemble the human senses. Some sensors are a stereo camera or structure sensor. Stereo camera and sensor are a kind of structure sensor that mimics the model of the human visual sense to recognize the surrounding environment. The basis of the built environment on each of these sensors is the depth image. Despite that, the stereo camera and structure sensor have models of different mechanisms and processes in obtaining the depth image. The stereo camera consists two cameras (left camera and right camera) and has some kind of process before that to build depth image. One of the processes is matching pixels that have the same color characteristics between the left camera image and right camera image. Whereas the structure sensor consists of a kind of distance sensors. On the sensor, there are two devices, namely a device for firing, a kind of laser that can not be seen by the human eye and devices to receive results from the reflection of the laser has been fired before. The laser is not only one point, but a lot of points that were fired simultaneously to form the same pixels as the output of a standard camera. Every point has a different time of the reception frequency laser that has been fired before. Acceptance of difference frequency of the laser, the structure of the sensor can get depth images. The stereo camera and
1014
determine the amount of blur throughout the image and the corresponding depth [3]. In computer vision, it also has been utilized for different purposes such as light field capture [4] and blurring [5]. Here, we emphasize its application in depth estimation. Depth perception from a variety of depth cues. This is typically classified into binocular cues, that are based on receipt of sensory information in three dimensions from both eyes and the monocular cues that can be represented in just two dimensions and observed with just one eye [6], [7], to improve depth estimation. Research about computer vision developments in the field of humanoid robot insufficiently developed in building a system that can approach human capabilities. From building a mechanical humanoid robot and intelligence systems, one huge problem is how to build the system that can recognize environment quickly. The system is able to determine whether the environment can have full information on what it sees because the robot can move autonomously. The ability to simultaneously localize a robot and accurately map its environment are considered by many to be a key prerequisite of truly autonomous robots [8], [9].
The method will produce a process that can be run in real time because it has an efficient algorithm. Besides being able to run in the real time, the algorithm of this method has an average error rate of small pixels. II. MATERIALS AND METHOD The depth image is an image that contains information relating to the distance of the surfaces of scene objects from a viewpoint. Therefore, to get the depth image it requires stereo correspondence process and depth estimation.
(a)
Fig. 1 Mechanics of the robot head
Fig. 1 shows a mechanical model of the head and the location of the stereo camera and structure sensor that used in the proposed method. Stereo cameras used two cameras Microsoft LifeCam HD Cinema. The object of research in the proposed method is to build a system on a robot for mapping the surrounding environment. The proposed system is using a stereo camera, structure sensor, and mechanical robot head as his gaze orientation and can be run in real time. The stereo camera is used for a robot that can generate a depth map and used to estimate the distance of the object in the robot. The calculation of the distance used is the distance of the camera to the object, not the object distance of the robot as a whole. This research conducted by EEPIS Robotic Research Center (ER2C), previous build mechanical head with the corners of the degrees of freedom humanoid [10]. The problems in this proposed method are the quality of data depth formed. Increasing the depth of data is exactly the reason this method used is merging depth of stereo camera and structure sensor.
1015
(b) Fig. 2 Stereo image dataset from middlebury dataset:(a) left image, (b) right image
Stereo correspondence has been traditionally and continues to be, one of the most heavily investigated topics in computer vision. However, sometimes it is hard to gauge progress in the field, as most researchers only report qualitative results on the performance of their algorithms [1]. Additionally, according to a survey on the stereo method was long overdue, based on the last full survey on dating back about a decade. [11], [12], [13]. Depth estimation is one of the most fundamental and challenging problems in computer vision. For decades, it is important for many advanced applications, such as 3D reconstruction [14], robotic navigation [15], object recognition [16] and free viewpoint television [17]. Approaches for obtaining 3D depth estimation can be distinguished into two categories: passive and active. The goal of passive methods like stereo matching is to estimate a high-resolution dense disparity map by finding corresponding pixels in image sequences [18].
affected. In addition, more important, coded aperture can provide complementary information to the stereo in some cases. This observation makes the proposed setup attractive for depth estimation problem.
Fig. 2 shows one of stereo test image on the Middlebury dataset. The name of (e.g. Fig. 2) is newkuba image.
B. System Design
Fig. 3 Mechanics of the robot head
Fig. 3 shows an example of depth image generated from the image dataset (e.g. Fig. 2) using stereo matching modeling. (e.g. Fig. 3) is the image model of the basic hue color. The hue color started with red and blue ended. Red is the largest depth value, while blue is the smallest depth value. If depth value is the largest, then the distance of the object is nearby, whereas if the smaller of the depth value then the object is the farthest. A. Related Works Based on the motivation merger Stereo Camera and Structure Sensor to improve the performance of depth estimation, here in this paper discuss three different camera settings that employ masks Levin, as in Fig. 4 (a), and a pair Zhou complementary mask, as in Fig. 4 (b) and Fig. 4 (c). Please note that we chose to utilize the mask Levin and Zhou couples mask for discrimination ability of their extraordinary depth. Two questions led us to come up with the first two setups shown in Fig. 4 (a) and Fig. 4 (b).
(a)
Fig. 5 Diagrams of the FloW head vision
Mechanical arrangement formed by the flow of the head of vision stereo camera and structure sensor combines both the sensor could be a sensor depth to obtain an enhanced depth image. Fig. 5 is the system block in our approach to problem-solving. There is a data merging process RGBDepth received input from two other blocks processes. Two blocks of this process are derived from the stereo camera and structure sensor. Two blocks of this process have the same depth of the resulting data. Stereo camera in depth of data obtained through the process of calibrating the camera left and right. The results of the calibration are to make the yaxis on the left, and the right camera becomes misaligned. The manufacturing process becomes parallel to the y-axis is the remapping. Then do the process to get the depth of data by looking for the points that have the same characteristics on the x-axis. While the structure of the sensor block to get, depth data is simpler without a lengthy process because the output is already in the form of depth. Only need to calibrate for a merger between the sensor and the structure of the stereo camera.
(b)
(c) Fig. 4 Three camera setups. (a) two cameras with masks, e.g. the Levin’s mask, in stereo setup; (b) two cameras with one of Zhou’s mask pair (denoted as Zhou 1) in stereo setup, one more camera with other mask of Zhou’s pair (denoted as Zhou 2) is used to capture one more image on the right view; (c) two cameras with Zhou’s mask pair in stereo setup
1) Stereo Calibration
One is whether to use a mask aperture in stereo camera seriously affect the performance of ordinary stereo matching; the other is whether the structure sensor can provide useful information on where the matching stereo fail. Experiment results, presented in Section III, shows that if the stereo images taken captured by the camera is equipped with the same mask, ordinary stereo matching performance is not
1016
The stereo camera needs to be calibration first before we get the depth image. Calibration using chessboard pattern is recommended a method to get correspondence image pairs. At first, it needs to define the size of chessboard pattern so it can find correspondence points in the each corner of chessboard pattern at both image pairs.
2) Disparity We should get the disparity (d), the disparity is a difference between left (xl) and right (xr) camera. =
5x 4
−
(1)
Before we get depth image, we should know focal length, baseline (B) (distance between cameras), and disparity. Focal length (f) is obtained from real distance (Zreal) per 1 + , where =
Fig. 6 Defined size of chessboard pattern
Each corner is defined rotation and translation variables in order to match the correspondence points at both image pairs.
=
(2)
3) Depth Depth value (Z) contains distance between cameras into an object in frame plane. There are using focal length, baseline and disparity for the depth value parameters. !=
Fig. 7 Find correspondence points at image pairs
"# $
(3)
4) Depth Data
After finding the correspondence points shown in (e.g. Fig. 7), we can find the match point between both images. Finding correspondence points is related to the condition when we rotate the lens of a camera. Focus on an object, then take the position of this object at the same time using both cameras.
This section is combination depth from each sensor, in this paper using Stereo camera and Structure Sensor. When depth image from Structure Sensor (SS) contains ≤0 value, then attempt it into condition at temporary matrix (T). 1; -. ( , /) ≤ 0 %(',)) = + 0;
(4)
In order to depth image from Stereo Camera (Sc) knows the condition of Structure Sensor described in T, it needs to make a multiply into a condition matrix C. 2 = - .%
Fig. 8 Rotation chessboard pattern in frame plane
Both images where contains chessboard pattern needs to be rotated in order to reach the matching state. This state required the correspondence points that we have done before.
- . % - . %5 - . %5 - . %55 2= 4 ⋮ ⋮ - . %) - . %)5
⋯ - .% ' ⋯ - . %5' : ⋮ ⋱ … - . %')
(5)
After depth image from both sensors knows the condition between each other, we stored it into new matrix combination from both sensor (SSC)
--2 = 2 + --
(6)
Our method is an attempt to merging depth data from both sensors to get an enhancement of depth image into a new depth data (SSC). Fig. 9 Rotated frame following another frame
5) Coordinate Extraction At least of stereo matching, we can acquire tilt data of rotation object (chessboard pattern) and stored it into calibration data of stereo camera.
Extracting coordinates from frame to real is a phase for combining depth image and orientation of the camera. This combination has a result of 3D Vector that will be used for building 3D Mapping. For extracting, we have to find maximum camera angle by frame orientation (Kh,Kv).
1017
;ℎ,= = >?@A>B C
DE,ℎF
?> G/2 J !
condition. The scope of our research must be done in the closed room, at least in an indoor environment. In this environment, there are few things to determine the distance of the object to sensors. Fig. 11-17 are the result of an image taken from the camera. Then, from the image is converted into a data form depth. In this experiment, the point of the robot was taken by turning from left to right. The data were taken sequentially. Then, the data depth of the stereo camera and structure sensor combined. The results of data depth from the stereo camera are not perfect because the process of the stereo camera should be able to achieve real-time. It is because the algorithm used to use the primitive stereo matching. So although simple, but still has the result that can achieve realtime.
(7)
Actual distance (ZS) of each object can be known from real measurement compared to equation (3). To get the actual distance, the system needs to find the distance for calibrating. The data needs to be compared to range scaled distance (ZCn) which has a constant value in each distance measurement, and then reduce it with real distance (zr). ! =K
(
LM N
L )∗( N
( LN
L)
L)
+ !PQ ;
0;
!@Q > , ! > !@Q
(8)
After that finds real width (Sh) and height (Sv) maximum in actual distance (ZS). -ℎ,= = A>B D;ℎ,= F!S
(9)
Then transform depth image into 3D model,
where : x, ydn x, yc w h
, /.Q = 2-T,U (
',)VL N',)W X,T
)
(10)
= pixel in the depth image = pixel center in the depth image = width frame = height frame III. RESULTS AND DISCUSSION
This section discusses the percentage error rate of vacant space of data pixel depth of Stereo Camera, Structure Sensor, methods of merging both camera and the performance of a system built to verify the efficiency of detail and accuracy of real-time.
(a)
A. The Percentage Error Rate of Vacant Space of Data Pixel Methods used to determine the error rate of vacant space by calculating total pixels that do not contain the depth value (0) divided by the size of the frame on each sequential rotation in yaw orientation. The viewpoint of image rotation used in 0 degrees to 126 degrees defines in Fig. 10 below.
(b)
Fig. 10 Range of image object in panorama view
In Fig. 10, we describe the range of viewpoints that can be reached by both sensors. We got the depth data from few things in front of each sensor, so we put in this Table 1 below, Fig. 11-17 contain some depth images taken by all sensors. These images captured from 0 degrees to 126 degrees orientation with static lighting environment
1018
(c)
(b)
(d) Fig. 11 (a) Images captured from 0 degrees ; (b) Stereo camera; (c) Structure sensor; (d) Combination image from stereo camera and structure sensor
(c)
Fig. 11 (b) shows the result of a stereo camera. The results of the process on the stereo camera have an error rate of vacant space is 68.91%. Fig. 11 (c) is the result of structure sensor. The results of the process of the structure sensor have an error rate of vacant space 22.05%. While Fig. 11 (d) is the result of the merging of stereo cameras and structure sensors. The result of the merger of the stereo camera and structure sensor is to have an error rate of vacant space 15.80%. (d) Fig. 12 (a) Images captured from 21 degrees; (b) Stereo camera; (c) Structure sensor; (d) Combination image from stereo camera and structure sensor
Fig. 12 (b) is the result of a stereo camera. The results of the process on the stereo camera have an error rate of vacant space is 66.10%. Fig. 12 (c) is the result of structure sensor. The results of the process of the structure sensor have an error rate of vacant space 20.02%. While Fig. 12 (d) is the result of the merging of stereo cameras and structure sensors. The result of the merger of the stereo camera and structure sensor has an error rate of vacant space 14.67%. (a)
(a)
1019
(b)
(a)
(c) (b)
(c)
(d) Fig. 13 (a) Images captured from 42 degrees; (b) Stereo camera; (c) Structure sensor; (d) Combination image from stereo camera and structure sensor
Fig. 13 (b) is the result of a stereo camera. The results of the process on the stereo camera have error rate of vacant space is 59.80%. Fig. 13 (c) is the result of structure sensor. The results of the process of the structure sensor have error rate of vacant space 27.33%. While Fig. 13 (d) is the result of the merging of stereo cameras and structure sensors. The result of the merger of the stereo camera and structure sensor has an error rate of vacant space 17.98%.
(d) Fig. 14 (a) images captured from 63 degrees; (b) Stereo Camera; (c) Structure Sensor; (d) Combination Image both cameras
1020
Fig. 14 (b) is the result of a stereo camera. The results of the process on the stereo camera have an error rate of vacant space is 63.55%. Fig. 14 (c) is the result of structure sensor. The results of the process of the structure sensor have an error rate of vacant space 31.97%. While Fig. 14 (d) is the result of the merging of stereo cameras and structure sensors. The result of the merger of the stereo camera and structure sensor has an error rate of vacant space 19.19%.
(d) Fig. 15 (a) Images captured from 84 degrees; (b) Stereo camera; (c) Structure Sensor; (d) Combination Image from Stereo Camera and Structure Sensor
Fig. 15(b) is the result of a stereo camera. The results of the process on the stereo camera have an error rate of vacant space is 75.40%. Fig. 15 (c) is the result of structure sensor. The results of the process of the structure sensor have an error rate of vacant space 28.17%. While Fig. 15 (d) is the result of the merging of stereo cameras and structure sensors. The result of the merger of the stereo camera and structure sensor has an error rate of vacant space 21.66%.
(a)
(b)
(a)
(c)
(b)
1021
(c) (b)
(d) Fig. 16. (a) Images captured from 105 degrees; (b) Stereo camera; (c) Structure sensor; (d) Combination image from stereo camera and structure sensor
(c)
Fig. 16 (b) is the result of a stereo camera. The results of the process on the stereo camera have an error rate of vacant space is 63.10%. Fig. 16 (c) is the result of structure sensor. The results of the process of the structure sensor have an error rate of vacant space 30.06%. While Fig. 16 (d) is the result of the merging of stereo cameras and structure sensors. The result of the merger of the stereo camera and structure sensor has an error rate of vacant space 16.85%.
(d) Fig. 17 (a) Images captured from126 degrees; (b) Stereo camera; (c) Structure sensor; (d) Combination image from stereo camera and structure sensor
Fig. 17 (b) is the result of a stereo camera. The results of the process on the stereo camera have an error rate of vacant space is 54.39%. Fig. 17 (c) is the result of structure sensor. The results of the process of the structure sensor have error rate of vacant space 19.64%. While Fig. 17 (d) is the result of the merging of stereo cameras and structure sensors. The result of the merger of the stereo camera and structure sensor has an error rate of vacant space 10.47%. (a)
1022
Pixel error rate of vacant space measurement defined in the equation below: [ \' $ \ T]^ Y??Z? = (11) [
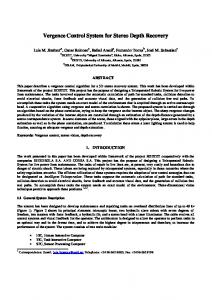
In Fig. 18, we can see that our approach to merging the depth data from Stereo RGB Camera combine with Structure Sensor has a little error rate of vacant space than each sensor. In this paper, we make an addition to building 3D map into our experiment to represent the RGB-Depth image.
\'
We defined error rate of vacant space measurement based on pixels in each depth images. The correctness of observation depth shown as an image, it also can be seen by raw depth data measurement in each sensor. We approach depth value of Stereo Camera with equation (3) and Structure Sensor with OpenNI library. But, we observe the depth data by the error rate of vacant space pixel measurement, so we put in Table 1 below. In the Table 1, prove that error rate of vacant space of pixel data depth in method of system merge between Stereo Camera and Structure Sensor that are built has an average error rate of vacant space is smaller at 18.10%, compared with a stereo camera that has an average error rate of vacant space 64.50% and structure sensor has average error rate of vacant space 26.72%. These data can be shown as chart view in Fig. 18.
B. The Performance of a System In this experiment is to calculate the percentage of pixels of depth error rate of vacant space method that we developed and compared with another merger method. The methods are Jaesik et al. [19,20] and Jing et al. [21]. On their paper described of the used stereo cameras and Kinect. Because of the distance sensor are used differently and the data they use for their own experiments. So in this experiment, the proposed of the method still uses structure sensor and stereo cameras. while for their method, using a system of their method to establish the depth image with the Kinect and stereo cameras. Methods used to determine the error rate of vacant space is to calculate the total pixel that does not have the depth value divided by the size of the frame on each sequential real time that has been specified. Sequential time used is for 15 seconds, and at that time the head of the robot rotates the Y axis of 0 degrees to 126 degrees. In Table 2, there is an error rate of vacant space that has a value of error rate of vacant space 100%. This was due to at the time sequence of the method could not complete algorithm to built the depth on the whole pixels so it could not convert it into 3D Transformation Map. This can be seen in Fig. 19.
TABLE I PERCENTAGE ERROR RATE OF VACANT SPACE PIXELS OF EACH PHASE
Orientation (yaw) 0 9 18 27 36 45 54 63 72 81 90 99 108 117 126 Average:
Stereo Camera 68.91 66.10 62.85 62.12 59.80 59.08 61.77 63.55 67.13 75.40 73.84 69.13 63.10 60.40 54.39 64.50
Structure Sensor 22.05 20.02 24.47 24.46 27.33 32.30 32.15 31.97 28.73 28.17 22.61 31.22 30.06 25.74 19.64 26.72
Methods of Merging 15.80 14.67 18.42 17.86 17.98 21.35 19.41 19.19 17.58 21.66 20.55 24.26 16.85 15.55 10.47 18.10
Error Rate of Vacant Space Pixels of Each Phase
80 70 60 50 40 30 20 10 0 1
2
3
4
5
6
Stereo Camera
7
8
9 101112131415 Structure Sensor
Merge of both sensor
Fig. 18 Error rate of vacant space pixels of each phase
(a) (b) Fig. 19 (a) Our method; (b) Jaesik et al [19], [20] method; (c) Jing et al [21] method
1023
(c)
Fig. 19 is a form of transformation 3D mapping from the top view. Fig. 19 in each row is oriented views sequentially from 0 degrees to 126 degrees which run for 15 seconds. Fig. 10 shows the differences in detail or information density of each data obtained. Information obtained from our method which has an average error rate of vacant space of 29.02%. It shows that more detailed information than the methods used by jaesik et al. [19], [20] with an average error rate of vacant space of 67.012% and Jing et al. [21] with an average error rate of vacant space of 83.55%.
renew the map when their methods are finished running. So when it’s at a certain angle of the methods, they have not updated the map. It is considered failed and rated error rate of vacant space 100%. TABLE II PERCENTAGE ERROR RATE OF VACANT SPACE PIXELS OF EACH METHOD
(a)
Time (second)
Orientation (Yaw)
Our Method
1 2 3 4 5 6 7 8 9 10 11 12 13 14 15 Average:
0 9 18 27 36 45 54 63 72 81 90 99 108 117 126
15.57 14.41 15.93 16.27 19.31 21.77 19.21 100 100 21.52 24.23 21.21 15.26 16.26 14.35 29.02
Jaesik et al. [19,20] 100 100 100 16.11 100 100 18.79 100 100 19.05 100 25.65 100 14.03 11.55 67.012
Jing et al. [21] 100 100 100 100 19.21 100 100 100 20.04 100 14.08 100 100 100 100 83.55533
IV. CONCLUSION The system we proposed with the incorporation of models combination Stereo camera and Structure Sensor at the 'FLoW' Humanoid Robot has been able to demonstrate detailed depth information and depth data density. The novelty of getting depth data by combining RGB-depth sensor, we approach to get depth data shown in equation Section III-D. We put the condition of each sensor into a new matrix. Besides the system can obtain detailed information, our main contribution is a method of a system that we built must be running in the detailed depth image. The system also should be running in real time, because to build a system of intelligence in the humanoid robotic system should at least approach the human ability to think quickly to find out the mapping environment. This was proven with an average error rate of vacant space of 18.10% were obtained by sequential orientation has been determined. In the future, we will develop this research to add orientation to the movement of 'Flow' Head Humanoid more dynamic, in order to identify the overall environment system more detail and faster. We also transform at the system CPU usage models that system is not very high at the run time.
(b)
(c) Fig. 20 (a) First person view from our method; (b) First person view from Jaesik et al. [19], [20] method; (c) First person view from Jing et al. [18] method
REFERENCES [1]
The results of two other methods were more tenuous than the proposed method from how experimental has conducted. This is because their methods wake up just focus on the result of the small error rate of vacant space without regard to runtime. While the system on humanoid robot must approach the human speed in processing what is seen. Therefore, when the system is running for 15 seconds, their method cannot produce depth images every second. Whereas in every corner has a different image. So their methods will
[2] [3]
[4]
1024
D. Scharstein and R. Szeliski, “A taxonomy and evaluation of dense two-frame stereo correspondence algorithms,” International Journal of Computer Vision, vol. 47, no. 1-3, pp. 7–42, May 2002. A. P. Pentland, “A new sense for depth of field,” IEEE Trans. Pattern Anal. Mach. Intell., vol. 9, no. 4, pp. 523–531, Jul. 1987. S. Chaudhuri and A. Rajagopalan, Depth From Defocus: A Real Aperture Imaging Approach. New York, USA: Springer New York, 1999. A. Veeraraghavan, R. Raskar, A. Agrawal, A. Mohan, and J. Tumblin, “Dappled photography: Mask enhanced cameras for heterodyned light fields and coded aperture refocusing,” in ACM SIGGRAPH’07. New York, NY, USA: ACM, 2007.
[5]
C. Zhou and S. Nayar, “What are good apertures for defocus deblurring?” in Computational Photography (ICCP), 2009 IEEE International Conference on, Apr. 2009, pp. 1–8. [6] A. Saxena, J. Schulte, and A. Ng, “Depth estimation using monocular and stereo cues,” in Proc. of the 20th Int. Joint Conf. Artifical Intelligence, 2007, pp. 2197–2203. [7] A. Rajagopalan, S. Chaudhuri, and U. Mudenagudi, “Depth estimation and image restoration using defocused stereo pairs,” IEEE Trans. Pattern Anal. Mach. Intell., vol. 26, no. 11, pp. 1521–1525, Nov. 2004. [8] G. Dissanayake, P. Newman, S. Clark, H.F. DurrantWhyte, and M. Csorba.,” A solution to the simultaneous localisation and map building (SLAM) problem”, IEEE Transactions of Robotics and Automation,(2001). [9] M. Michael, T. Sebastian, K. Daphne, W. Ben., “FastSLAM: A Factored Solution to the Simultaneous Localization and Mapping Problem”, In Proceedings of the AAAI National Conference on Artificial Intelligence, (2002). [10] Bayu Setiawan, Oxsy Giandi, Dadet Pramadihanto, Raden Sanggar, Dewanto, Sritrusta Sukaridhoto, and Ahmad Subhan Khaillulah., “Flow head: 7 dof mechanism for flow humanoid”,In Control, Electronics, Renewable Energy and Communications (ICCEREC), International Conference on, pages 98–102. IEEE, (2015). [11] S. T. Barnard and M. A. Fischler. Computational stereo. ACM Comp. Surveys, 14(4):553–572, 1982. [12] J. Udensi and P. U. Akor, “An Assessment of Record Management System in Establishment Division of Two Universities in Nigeria,” International Letters of Social and Humanistic Sciences, vol. 13, pp. 97-109, 2014.
[13] J. H. Wu, W. S. Shen, L. M. Lin, R. A. Greenes and D. W. Bates, “Testing the technology acceptance model for evaluating healthcare professionals' intention to use an adverse event reporting system,” International Journal for Quality in Health Care, vol. 20, pp. 123-129, 2008. [14] Díaz-Vilariño, L.; Khoshelham, K.; Martínez-Sánchez, J.; Arias, P. 3D modeling of building indoor spaces and closed doors from imagery and point clouds. Sensors 2015, 15, 3491–3512. [15] Pan, S.; Shi, L.; Guo, S. A kinect-based real-time compressive tracking prototype system for amphibious spherical robots. Sensors 2015, 15, 8232–8252. [16] Yebes, J.J.; Bergasa, L.M.; García-Garrido, M. Visual object recognition with 3D-aware features in KITTI urban scenes. Sensors 2015, 15, 9228–9250. [17] Tanimoto, M.; Tehrani, M.P.; Fujii, T.; Yendo, T. Free-viewpoint TV. IEEE Signal Process. Mag. 2011, 28, 67–76. [18] Liu, J.; Li, C.; Mei, F.; Wang, Z. 3D entity-based stereo matching with ground control points and joint second-order smoothness prior. Vis. Comput. 2014, 31, 1–17. [19] Jaesik Park, Hyeongwoo Kim, Yu-Wing Tai, Michael S Brown, and In So Kweon. “High-quality depth map upsampling and completion for rgb-d cameras”. IEEE Transactions on Image Processing, 23(12):5559–5572, (2014). [20] Jaesik Park, Hyeongwoo Kim, Yu-Wing Tai, Michael S Brown, and Inso Kweon. “High quality depth map upsampling for 3d-tof cameras”. In 2011 International Conference on Computer Vision, pages 1623–1630. IEEE, (2011). [21] Jing Liu, Chunpeng Li, Xuefeng Fan, and Zhaoqi Wang. “Reliable fusion of stereo matching and depth sensor for high quality dense depth maps”. Sensors, 15(8):20894–20924, (2015).
1025