KEGG pathway: collection of pathway maps representing reaction and molecular ... First, relevant metabolic and signaling KEGG pathways are parsed using the ...
MetaboSignal, a network-based approach to overlay metabolic and signaling pathways to study metabolic phenotypes Andrea Rodriguez-Martinez1, Rafael Ayala1, Joram M. Posma1, Ana L. Neves1, Dominique Gauguier1,2, Jeremy K. Nicholson1 and Marc-Emmanuel Dumas1* 1
Computational and Systems Medicine, Department of Surgery and Cancer, Faculty of Medicine, Imperial College London, SW7 2AZ, London, United Kingdom. 2
Sorbonne Universities, University Pierre & Marie Curie, University Paris Descartes, Sorbonne Paris Cité, INSERMUMR_S 1138, Cordeliers Research Centre, 75006 Paris, France.
Supplementary material In this document, we provide the following information: •
High-resolution version of the figure shown in the main paper.
•
Glossary and reference information for MetaboSignal.
•
Instructions for how to install and get started with MetaboSignal.
•
Description of all the functionalities of MetaboSignal, with illustrative examples.
•
Common workflow for how MetaboSignal can be used.
•
Basic guidelines about how to import, visualize and customize MetaboSignal networks in cytoscape.
1
Main paper figure
A C myo-Inositol-3P
SHIP2
INPP4
PIP3
myo-Inositol
D-Glucose
IMPAD1
GLA
G6PC
B D
SHIP2 PPP2R5 PIP3
AKT D-Glucose
SLC2A4
G6PC
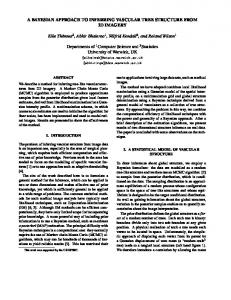
Fig. 1. Example of interconnection between the genome and metabolome using a rat adiposetissue dataset. (A, B) Histograms of shortest path lengths from 38 metabolic-genes to 19 metabolites in (A) the metabolic network and in (B) the MetaboSignal network. (C, D) Comparison of shortest paths from G6pc3 (G6PC) or Ship2 (SHIP2) to D-glucose in (C) the metabolic network and in (D) the MetaboSignal network. Panel D also shows the shortest path from Ppp2r5b (PPP2R5) to D-glucose. Node color represents: metabolic-genes (blue), signaling-genes (green) and metabolites (red).
2
Glossary terms and reference information KEGG pathway: collection of pathway maps representing reaction and molecular interaction networks (http://www.genome.jp/kegg/pathway.html). Metabolic pathway: KEGG pathway map included in the category “Metabolism”. Signaling pathway: KEGG pathway map included in one of the following categories: “Environmental Information Processing”, “Cellular Processes”, “Organism Systems”, “Human Diseases”. KEGG Orthology (KO) database: KEGG database where molecular-level functions are associated in ortholog groups (http://www.genome.jp/kegg/ko.html). Clustering genes into orthology groups enables comparing networks from different organisms. It also allows reducing network dimensionality without loosing functional information. MetaboSignal network: network generated by merging metabolic and signaling KEGG pathways. This network is generated using the function “MetaboSignal_matrix( )”, which involves the main following steps: • First, relevant metabolic and signaling KEGG pathways are parsed using the KEGGgraph package (http://bioconductor.org/packages/release/bioc/html/KEGGgraph.html). • Parsed pathways are then used to build directed metabolic and signaling networks formalized as 2-column matrices, each row of the matrix representing an edge between two nodes. • The original metabolic network has two types of nodes: reactions and metabolites. Reactions are linked to enzymes, and then to genes using the KEGG API (http://www.genome.jp/kegg/rest/keggapi.html). • Optionally, the genes from the signaling network can be filtered based on tissue-expression using information from the Human Protein Atlas database (http://www.proteinatlas.org/). • Finally, the metabolic and signaling networks are merged (i.e. “rbind()” of the 2 matrices) to build the MetaboSignal network. Node types: MetaboSignal networks are composed by 4 different types of nodes: • Metabolic genes: genes encoding enzymes that catalyze metabolic reactions. • Signaling genes: genes encoding regulatory proteins involved in signaling pathways (e.g. kinases, phosphatases, receptors). • Metabolites (http://rest.kegg.jp/list/compound). • Non-enzymatic reactions: spontaneous reactions that are not catalyzed by enzymes (e.g. “rn:R07420” involving the cyclization of creatine into creatinine) or reactions that cannot be linked to enzymes in the KEGG API (http://rest.kegg.jp/link/rn/ec) (e.g. “rn:R10507”). Node betweenness: measurement of node centrality defined as the number of shortest paths going through a given node of the network (http://igraph.org/c/doc/igraph-docs.pdf). Shortest path: path connecting two nodes with the least number of edges. Shortest paths are calculated using the breadth-first algorithm (http://igraph.org/c/doc/igraph-docs.pdf). 3
Installation instructions To use MetaboSignal, R (version >= 3.3) must be correctly installed. Here, we strongly recommend using RStudio. MetaboSignal is currently available from the devel version of Bioconductor. For details, check: https://bioconductor.org/packages/MetaboSignal/ To install MetaboSignal, start R (or RStudio) and follow the instructions shown below: # 1) Install BiocInstaller and BiocGenerics source("https://bioconductor.org/biocLite.R") biocLite(c("BiocInstaller", "BiocGenerics"), ask = FALSE) # 2) Install MetaboSignal source("https://bioconductor.org/biocLite.R") BiocInstaller::useDevel() biocLite("MetaboSignal", ask=FALSE) # Important note: MetaboSignal depends on hpar version > = 1.15.3. # If prompted with the message: “Do you want to install from sources packages which need compilation?”, choose no. # 3) Remove package To remove the package use: remove.packages("MetaboSignal") and restart R.
Get started # Under R, and after having installed MetaboSignal, load the package using: library(MetaboSignal) # To see the vignette of the package use: browseVignettes("MetaboSignal") # To get help with any function (e.g. MetaboSignal_matrix) use: help("MetaboSignal_matrix")
4
MetaboSignal core functions ##### MetaboSignal_matrix #### Description This function generates a directed network-table (i.e. two-column matrix), where each row represents an edge connecting two nodes (from node in column 1 to node in column 2). Nodes represent four different molecular entities: metabolic-genes (i.e. genes encoding enzymes that catalyze metabolic reactions), signaling-genes (e.g. kinases), reactions or metabolites. It is possible to build a tissue-specific network-table that excludes signaling genes that are not expressed in a given tissue. Tissue expression data is obtained using the hpar package, which is based on the The Human Protein Atlas database. The genes "non detected" in the target tissue (reliability = supportive) are neglected. The network-table generated with this function can be customized based on several criteria. For instance, undesired nodes can be removed or replaced using the functions "MS_RemoveNode( )" or "MS_ReplaceNode( )" respectively. Also, the network can be filtered according to different topological parameters (e.g. node betweenness) using the function "MS_FilterNetwork( )". Usage MetaboSignal_matrix(metabo_paths, signaling_paths, organism_name, tissue = "all", expand_genes = FALSE) Arguments # metabo_paths: character vector containing the KEGG IDs of the metabolic pathways of interest
(organism-specific).
For
example,
the
KEGG
ID
for
the
pathway
"glycolysis/gluconeogenesis" in the rat is "rno00010". See the function "MS_FindKEGG( )". # signaling_paths: character vector containing the KEGG IDs for the signaling pathways of interest (organism-specific). For example, the KEGG ID for the pathway "insulin signaling pathway" in the rat is "rno04910". # organism_name: character vector containing the common name of the organism of interest (e.g. "rat", "mouse", "human", "zebrafish") or taxonomy id. For more details, check: http://docs.mygene.info/en/latest/doc/data.html#species. This argument is only required when filtering genes by tissue expression. # tissue: character vector containing the name(s) of the target tissue(s). By default, tissue = "all" indicating that signaling gene nodes will not be filtered by tissue expression. Otherwise, possible
tissues
are
those
included
in
the
dataset
hpaNormalTissue
(see
levels(hpaNormalTissue$Tissue). # expand_genes: logical scalar indicating whether the gene nodes will represent orthology IDs (FALSE) or organim-specific gene IDs (TRUE). By default, expand_genes = FALSE.
5
Value A two-column matrix where each row represents an edge between two nodes. Note Reaction directionality reported in KEGG has been cross-validated with published literature. For more details, check the dataset directionality_reactions. Examples # MetaboSignal_table with organism-specific gene nodes MetaboSignal_tableIsoforms