MATHEMATICAL THEORY OF PATTERN RECOGNITION
Methods of Recognition Based on the Function of Rival Similarity N. G. Zagoruiko, I. A. Borisova, V. V. Dyubanov, and O. A. Kutnenko Sobolev Institute of Mathematics, Sibirean Division, Russian Academy of Sciences, pr. Koptyuga 4, Novosibirsk, 630090 Russia e-mail:
[email protected] Abstract—A unified approach to the development of pattern recognition methods is proposed. The approach is based on the employment of the function of rival similarity (FRiS-function), which adequately represents human methods of evaluation of similarity and difference. Methods of recognition based on this approach are briefly described. Examples of solution of actual and benchmark problems using FRiS-function are given. DOI: 10.1134/S105466180801001X
1. INTRODUCTION Attempts to construct the ontology of the application area “Data Mining,” which mainly deals with Pattern Recognition (PR) [1], suggest the following picture. There are thousands of algorithms and programs used for the solution of applied problems in various fields of human activity which have already been developed (or are still under elaboration). This growing abundance indicates that recognition methods are in great demand. On the other hand, it points to the fact that there is no unified approach to the solution of various recognition problems. Moreover, similar problems are solved by different methods, which are rarely substantiated. The large variety of algorithms is much due to the fact that many tasks are ill-conditioned; in these tasks, the number of attributes exceeds the number of objects to observe. While developing a unified basis for recognition methods, we need to note that there already exists an example of a system that can perfectly solve all problems of PR. This system is a human being: he continuously and permanently classifies, recognizes, selects important attributes, forecasts and so on. In most cases, while solving these different and, usually, ill-conditioned problems, a person uses some universal psychophysiological function which is responsible for orientation in the space. This paper is based on two hypotheses: 1. When a person solves problems of classification, recognition, choice of features, forecasting, etc., the main function that he uses is determination of similarities and differences. 2. Similarity is not an absolute category, but a relative one.
Received June 15, 2007
We hope to show that a measure that imitates the human mechanism of evaluation of the relative (rival) similarity of objects allows for solving various PR problems using uniform algorithms that are invariant to peculiarities of tasks such as the strength of casualty and the type of distribution of objects in the space of characteristics. 2. FUNCTION OF RIVAL SIMILARITY While solving pattern recognition problems, we often use a decision rule based on comparing the degree of similarity between the control object and the standards of rival patterns. Dozens of different measures of similarity are described in the literature [2]. As a rule, in these measures, the similarity of the control object Z with all pattern standards is of absolute nature and depends only on the distance to these standards. However, it can be easily demonstrated that the human perception of similarity is of relative nature. To answer questions of the types “Is it close or far?” and “Is it similar or not?” we need to know what should we compare with. In some PR algorithms, e.g., in the nearest neighbor rule (kNN), object Z is decided to be similar to the first pattern not in the case where the distance r1 to this pattern is “small,” but if it is less than the distance r2 to the rival pattern S2. Consequently, to estimate the similarity between object Z and the first pattern, we have to know the distance from object Z both to the first pattern and to the nearest competitor S2. Then these distances should be compared in the scale of order. If we need the measure of rival similarity in the scale of relations, we can use the following value: F = ( r2 – r1 )/ ( r2 + r1 ).
(1)
Henceforth, this quantity is called the function or rival similarity or FRiS-function. This function is of relative nature and it is in good agreement with the mechanism of human perception of similarity and difference. The
ISSN 1054-6618, Pattern Recognition and Image Analysis, 2008, Vol. 18, No. 1, pp. 1–6. © Pleiades Publishing, Ltd., 2008.
2
ZAGORUIKO et al.
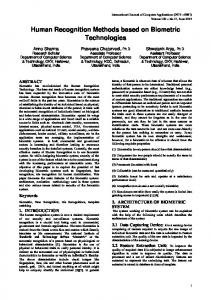
Fig. 1. Recognition of the belonging of object Z to one of the two patterns divided into clusters.
function of rival similarity F takes values in the range between –1 and +1. If the control object Z coincides with the first pattern, then r1 = 0 and F = 1. The equality r1 = r2 yields F = 0, which is indicative of the border between the patterns: at points of the border, the object is equally similar (or not similar) to these rival patterns. Operational experience suggests that FRiS-function can be used as a base element for the solution of various PR problems. If the variances di and dj of distributions of the rival patterns can be estimated, then, while solving a recognition problem, we need to use the normalized distances Ri = ri/di and Rj = rj/dj to the pattern standards. As a result, the normalized function of rival similarity takes the form Fi = ( Rj – Ri )/ ( Ri + Rj ).
(2)
Let us consider some ways to use FRiS-functions while solving some problems of Data Mining. 3. CONSTRUCTING DECISION FUNCTIONS (FRIS-STOLP ALGORITHM) To solve the problem of pattern recognition, we need to choose standard objects which control objects will be compared with. We can select standards (stolps) for every pattern with the help of the FRiS-Stolp algorithm. Assume that we solve the recognition task “the first pattern versus all other patters.” We consider the situation where the first randomly selected object ai is the only stolp of pattern S1, whereas all other patterns have all their objects as stolps. 1. For all objects aj ≠ ai of pattern S1, we find the distance r( ji ) to stolp ai and the distance r( jt) to the nearest object of other patterns. Using these distances,
we evaluate the similarity Fi of objects aj with their stolp. Then we find mi objects of the first pattern such that the values of their similarity function Fi exceed a given threshold F*, for example, F* = 0. We calculate the sum Fi of the values of similarity of all mi objects with the stolp ai. The value of F for the stolp object ai itself is equal to 1. 2. This procedure is performed for all M1 objects of the first pattern. 3. Then we find object ai with the maximum value of Fi and set it to be the first stolp A11 of the first cluster C11 of the first pattern S1. 4. We eliminate mi objects that enter in the first cluster from the first pattern. Then, repeating steps 1–3 for other objects of the first pattern, we find the next stolp. The process is terminated as soon as all objects of the first pattern are included in their clusters. 5. We reestablish all objects of pattern S1 and repeat steps 1–4 for all other patterns. 6. The stolps were chosen under the conditions that they were opposed by all objects of the rival patterns. Now patterns are represented only by their stolps. To specify the content of the clusters, we recognize the belonging of all objects to clusters in the conditions where function F is determined by the distances to the nearest friend stolp and the nearest foe stolp. The content of the clusters can be changed. 7. Finally, we have to find the average value Fs of the similarity functions for all objects and their stolps. The quantity Fs characterizes the quality of the system training and is closely connected with the errors that occur during the recognition of the control objects. The output of the FRiS-Stolp algorithm is the decision rule that consists of a list of standards (stolps) that describe each pattern, a list of objects belonging to each cluster, the values of internal distances for each cluster, and the average value Fs of the similarity functions. First, algorithm FRiS-Stolp selects stolps that are situated at local accumulation centers and protect with given reliability as many objects as possible. For this reason, in the case of normal distributions, the algorithm primarily selects stolps that are situated at the points of statistical expectation. In the case of multimodal distributions and linearly inseparable patterns, the stolps are situated at the centers of the modes. With growing distribution complexity the number k of stolps increases. The recognition process based on stolps is very simple: it consists in evaluation of the normalized functions of rival similarity of the control object Z with every stolp and selection of the pattern that corresponds to the stolp with the maximum value of F (see Fig. 1). Another important advantage of this decision rule is that we can use values of function F to estimate the reliability of the decision while recognizing a particular object. Figure 2 shows the results of recognition of
PATTERN RECOGNITION AND IMAGE ANALYSIS
Vol. 18
No. 1
2008
METHODS OF RECOGNITION BASED ON THE FUNCTION OF RIVAL SIMILARITY Err 0.6 0.5
1.05 1.00 0.95 0.90 0.85 0.80 0.75 0.70 0.65 0.60
P
0.4 0.3 0.2 0.1 0
0.05 0.10 0.15 0.20 0.25 0.30 0.35 F
U Q Q
U 0.05
0.10
0.15
0.20
0.25
0.30
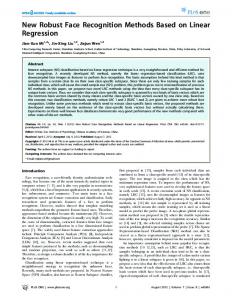
Fig. 3. Results of training and recognition using criteria U and Q against various levels of noise. Fine lines illustrate training; solid lines are used for the control.
Fig. 2. The misrecognition probability P versus the value of the similarity function F.
objects of a test sample which have different values of the similarity function F. As could be expected, if the values of function F are close to zero, the probability misrecognition is close to 50%. As the value of the similarity function F increases, the error probability P rapidly decreases. 4. SELECTION OF INFORMATIVE ATTRIBUTES (FRIS-GRAD ALGORITHM) To solve the problem of selecting a subset of the most informative attributes from a large initial set, we can use an arbitrary directional searching algorithm, e.g., the GRAD algorithm [3, 4]. This algorithm automatically determines both the content and the best quantity of characteristics. Here, we notice that this algorithm involves a new criterion of informativeness based on using FRiS-functions. Criterion of informativeness [5]. The informativeness of attributes or their combinations is usually estimated using the criterion that consists in the number U of misrecognitions for a training sample under the conditions of sliding examination. The main disadvantage of this criterion is that it disregards the recognition reliability for objects that are correctly recognized and the crudity of the misrecognition error for incorrectly recognized objects. We have demonstrated that these characteristics can be taken into account by using the normalized similarity function Fs of objects to their pattern standards. As the dimension of the subspace of attributes selected by GRAD algorithm gradually increases, the classification quality first increases, then attains its maximum, and after that begins to decrease. The point with the maximum value of Q corresponds to the best subset of attributes. The advantages of the informativeness criterion Q described above over the criterion U of errors in a training sample can be illustrated with the results of their experimental comparison. The initial data includes PATTERN RECOGNITION AND IMAGE ANALYSIS
3
200 objects belonging to two patterns (100 objects for each pattern) in the 100-dimensional space. Attributes are generated in such a way that they have different informativeness. As a result, about 30 attributes are more or less informative, whereas other attributes are generated by a random number generator and are certainly spurious. In addition, the table is distorted by noises of different intensity. At every noise level (from 0.05 to 0.3), the most informative n-dimensional subsystems (between 1 and 22) are selected. For every pattern, 35 randomly chosen objects are selected for training. Other 130 objects form the control sample. The results of the comparison of criteria Q and U are presented in Fig. 3. The results of the control show that criterion Q has significantly better prognostic properties and noise immunity as compared with criterion U. Estimation of the suitability of attributes (A.N. Kolmogorov’s problem). In 1933, A.N. Kolmogorov published paper [6], in which he considered the case where the number of potential predictors is comparable to or exceeds the number of observable objects. He noticed that, when constructing regression equations, selection of the subset of informative predictors presents some difficulties. The point is that of frequent occurrence are problems in which a major part of characteristics behave like a random noise. The greater the number of such characteristics, the higher the probability of finding a “pseudoinformative” set of noise predictors. Kolmogorov’s question of how a “suitable” system of attributes can be distinguished from an unfit one is still burning. We suggest one approach to the solution of Kolmogorov’s problem. To compare the results of the experiments described above with purely random results, we change the initial table as follows. The values of every attribute are saved, but their positions are randomly changed. So, all links between the objects and the values of their attributes are broken. In such a way, we generate 10 variants of random tables. For each table, we
Vol. 18
No. 1
2008
4
ZAGORUIKO et al.
select the best n-dimensional attribute subspace and evaluate criterion Fs. It turns out that the values of Fs fall into the “random corridor” that ranges from 0.61 to 0.67. For the subsystem obtained by the initial table, the value of Fs is far beyond this corridor (>0.85), and, hence, it may be considered nonrandom. The results presented above suggest the following practical recommendation. The training table N × M is used to determine the value of Fs for the best subsystem of n* attributes. Then a family of random tables is formed as described above and criterion Fs is evaluated for the “best” subsystems of the same dimension n*. The distance between the value of criterion Fs for the subsystem selected in the real table and the maximum value of criterion Fs for the family of random tables can be used to estimate the suitability of the selected subsystems. 5. CONSTRUCTION OF CLASSIFICATIONS (FRIS-TAX ALGORITHM) [7] Automated classification of objects in the form of a hierarchy of classes or a list of classes of the same hierarchical level can be perfomed using FRiS-Tax algorithm. It runs in two stages. At the first stage, FRiSCluster algorithm is used to select objects situated at local accumulation centers. Such objects become standards (stolps) of clusters. At the second stage, FRiSClass algorithm is used to consolidate clusters into classes (taxons) by means of combining some adjacent clusters into one class. This allows us to form classes of arbitrary shape, which need not be linearly separable. Clusterization. Conditions of applicability of the similarity function in the problem of classification construction differ in that it is not known whether sample objects belong to one or another class (as if all objects belong to the same pattern S). For this reason, at the first stage, a virtual rival pattern is introduced in such a way that the nearest stolp of this rival pattern is at a fixed distance r2* from each object of the sample. So, we use a modified similarity function such that, for any object ai, it is equal to Fi = (r2* – r1)/(r2* + r1). The user specifies the maximum number K of clusters for the best variant of clusterization to select from. The algorithm seeks the solution to the clusterization problem successively for all values k = 1, …, K by executing the following steps. 1. Firstly, all M objects are one by one considered as a standard of the only cluster. For each of them, in competition with the virtual stolp, the algorithm calculates the sum of the similarity functions to all other objects. The object that has the greatest sum is set to be the stolp A1 of the first cluster C1. 2. Then, for k = 2, the algorithm finds the object to become the second best stolp. For this purpose, all (M – 1) objects that do not coincide with the first stolp are one by one tested for the role of the second stolp.
Now the presence of two real stolps and a virtual one allows us to relate every object to either the first or the second real cluster. The second stolp A2 is taken to be the object that, in combination with the first stolp A1, provides a maximum sum of the similarity functions of all objects to their stolps. Objects that are associated with each stolp A1 and A2 form clusters C1 and C2, respectively. 3. For k = 1, the first cluster C1 includes all M objects, whereas, in the case k = 2, part of objects pass to the new cluster C2. For this reason, a new stolp is selected for the new content of cluster C1: it is the object of the first cluster which has the greatest sum of values of similarity function for all objects in C1. 4. In a similar manner, the list of stolps is extended further. For every new value k of the number of taxons, we redefine stolps for the clusters that were changed at the k-th step as it is described in the previous item. Finally, we obtain best variants of classification for all k = 1, 2, …, K. This is the end of the first stage of clusterization. Construction of the classification (FRiS-Class algorithm). It is not necessarily that a class of a complicated structure consist of a single cluster. In view of this fact, the algorithm provides the following mechanism of uniting several clusters into a single class. 5. Each pair Ci and Cj of clusters is checked for the presence of controversial objects situated near the interface between these clusters. Object a is considered to be in the rival zone of stolps Ai and Aj if these stolps are closest to the object and the absolute value of its similarity to its friend stolp is below a certain threshold value |Fa| < F*. 6. The distance Dij between clusters Ci and Cj is the minimal distance between two objects belonging to different clusters and situated in their rival zone. For objects a in Ci and b in Cj that are situated in the rival zone and provide a minimum to F, the distances Da and Db from each of them to its nearest neighbor are determined. 7. Clusters Ci and Cj are united if the values of Dij, Da, and Db are slightly different from each other. An important advantage of this algorithm is that it can automatically choose a locally optimal number of clusters. This can be done using the values of clusterization quality Fs for different numbers of clusters. The local maxima of Fs correspond to the best variants of clusterization. Examples of operation of the FRiS-Tax algorithm in the two-dimensional case are presented in Fig. 4. In the case of high-dimensional spaces, the efficiency of the algorithm suggested was compared with that of the existing algorithms of taxonomy on applied problems. In one of them, the training sample consisted of X-ray spectra of 160 specimens separated into 5 groups by their chemical composition. Every spectrum was
PATTERN RECOGNITION AND IMAGE ANALYSIS
Vol. 18
No. 1
2008
METHODS OF RECOGNITION BASED ON THE FUNCTION OF RIVAL SIMILARITY
(4)
5
(2) (8)
(2)
(3) (1)
(1)
(3) (5)
(7)
(7) (2)
(4)
(3) (7)
(1)
(3)
(9)
(9) (5)
(1) (5)
(8)
(10)
(6) (8)
(6)
(2)
(4)
(10)
Fig. 4. Example of the output of the FRiS-Tax algorithm.
represented as a 1024-dimensional vector. The training sample was divided into classes (the number of classes varied from 2 to 18) in the space of spectral attributes with the help of some well-known algorithms of taxonomy. The same problem was solved using algorithms FRiS-Cluster and FRiS-Tax. The efficiency of the algorithms was measured by the degree of homogeneity of the resulting taxons in terms of the chemical composition of the objects included in the taxons. Experiments involved three algorithms which operate with the concept of the taxon center and provide the user with both a partition and a set of standard patterns (stolps). These are the following algorithms: —the k-means algorithm [8, 9], which is most popular in the west; —the Forel algorithm, which “rolls out” the set of investigated objects on taxons with spherical shape [10];
0.9
PRiS-Tax Kmeans Forel
0.8 0.7 0.6 0.5 0.4 0.3
2 3 4 5 6 7 8 9 10 11 1213 14 15 k
Fig. 5. Comparison of the quality of three algorithms for taxonomy. PATTERN RECOGNITION AND IMAGE ANALYSIS
—the FRis-Tax algorithm, which unites several clusters obtained by the FRiS-Cluster algorithm into one taxon of an arbitrary shape. The taxonomy quality (the measure of homogeneity of taxons) of these three algorithms for different numbers k of taxons is shown in Fig. 5. It is clear that the FRiS-Tax algorithm outperforms the existing analogs. Moreover, using the FRiS-function, we can determine the preferable variant of taxonomy and the number of taxons to decide on. The locally maximum value of the clusterization quality (Fs = 0.776) was achieved on 8 clusters, which were later united into 5 classes. The analysis of their content demonstrated that they are maximally homogeneous in chemical composition. CONCLUSIONS The suggested function of rival similarity can be used as a universal kernel for algorithms that solve all basic problems of pattern recognition. Algorithms based on FRiS-function are applicable for solving problems with arbitrary strength of casualty and any character of distribution of objects to be analyzed in the attribute space. FRiS-function, which imitates human methods of estimation of similarity, allows easy interpretation of the results. Using FRiS-functions as an informativeness criterion increases the accuracy of estimation of the probability of correct recognition for the control sample. With the help of FRiS-functions, one can solve new problems such as estimation of the suitability of the attribute space (Kolmogorov’s problem) and automated detection of the number of clusters. For well-known problems of Pattern Recognition, the quality of their solutions obtained with the help of FRiS-
Vol. 18
No. 1
2008
6
ZAGORUIKO et al.
functions is highly competitive with that of the solutions obtained by the existing methods. ACKNOWLEDGMENTS The work was supported by the Russian Foundation for Basic Research, project no. 05-01-00241. REFERENCES
8. M. I. Schlesinger, “Spontaneous Pattern Recognition,” in Reading Automates and Pattern Recognition (Naukova Dumka, Kiev, 1965), pp. 46–61. 9. J. MacQueen, “Some Methods for Classification and Analysis of Multivariate Observations,” in Proc. 5th Berkley Symposium on Mathematical Statistics and Probability, Vol. 1 (University of California, 1967), pp. 281–297. 10. N. G. Zagoruiko, Applied Methods of Data and Knowledge Mining, (IM SO RAN, Novosibirsk, 1999) [in Russian].
1. N. G. Zagoruiko, S. E. Gulyaevskii, and B. Ya. Kovalerchuk, “Ontology of the Data Mining Subject Domain,” Int. J. Pattern Recognit. Image Anal. 17 (3), 349–356 (2007). 2. Yu. A. Voronin, Principles of Similarity Theory (VC SO AN SSSR, Novosibirsk, 1989) [in Russian]. 3. N. G. Zagoruiko and O. A. Kutnenko, “Recognition Methods Based on the AdDel Algorithm,” Int. J. Pattern Recognit. Image Anal. 14 (2), 198–204 (2004). 4. N. G. Zagoruiko, O. A. Kutnenko, and A. A. Ptitsyn, “Algorithm GRAD for Selection of Informative Genetic Features,” in Proc. Int. Moscow Conf. on Computational Molecular Biology, Moscow, Russia, 2005 (Moscow, 2005), pp. 8–9. 5. N. G. Zagoruiko and O. A. Kutnenko, “Algorithm GRAD for Selection of Attributes,” in Proc. 8th Int. Conf. on Application of Multivariate Statistic Analysis in Economics and Quality Rating, Moscow, Russia, 2006 (MESI, Moscow, 2006), pp 81–89. 6. A. N. Kolmogorov, “On the Suitability of Statistically Obtained Forecast Formulas,” Zavodskaya Laboratoriya, No. 1, 164–167 (1933). 7. I. A. Borisova, “Clusterization Using the Function of Rival Similarity,” Nauchnye Trudy NGTU (Novosibirsk, 2007) (in press).
Vladimir Vladimirovich Dyubanov. Born 1981. Graduated from the Krasnoyarsk State University in 2002. Currently is a postgraduate at the Novosibirsk State University. Scientific interests: data mining and pattern recognition and prognosis. Author of eight papers.
Nikolai Grigor’evich Zagoruiko finished a secondary school in Novosibirsk oblast. Graduated from the Electroengineering Department of the Leningrad Institute of Motion-picture Engineers in 1953. Since 1960 has been working at the Institute of Mathematics of the Siberian Branch of the Russian Academy of Sciences. Received candidate’s degree in 1962 and doctoral degree in Pattern Recognition in 1969. Since 1973 to 1982 had been working as a vice-rector of the Novosibirsk State University. In 1988–1990 had been heading a project in the International Laboratory of Artificial Intelligence in Bratislava (Slovakia). Scientific interests: pattern recognition and prediction. Author of 219 publications, including 13 monographs.
Irina Artemovna Borisova. Born 1978. Graduated from the Novosibirsk State University in 2002. Currently is a chief programmer at the Institute of Mathematics, Siberian Division, Russian Academy of Sciences. Scientific interests: pattern recognition. Author of nine papers.
Ol’ga Andreevna Kutnenko. Born 1958. Graduated from the Novosibirsk State University in 1980. Received candidate’s degree in 2000. Scientific interests: data analysis, determination of empirical principles, pattern recognition. Author of 13 papers.
PATTERN RECOGNITION AND IMAGE ANALYSIS
Vol. 18
No. 1
2008