1 Computer Information Systems Department, University of Jordan. Amman, 11942 ... ISSN (Print): 1694-0814 | ISSN (Online): 1694-0784 www.IJCSI.org. 203 ..... Omar Y. Adwan received his BSc in computer science from. Eastern Michigan ...
IJCSI International Journal of Computer Science Issues, Vol. 10, Issue 6, No 2, November 2013 ISSN (Print): 1694-0814 | ISSN (Online): 1694-0784 www.IJCSI.org
203
Microarray Gene Expression Extraction and Archiving Based on Local Spot Locations Omar Adwan1, Amjad Hudaib2, Hussam Nawwaf Fakhouri3 and Loai M. Alnemer 4 1
Computer Information Systems Department, University of Jordan Amman, 11942, Jordan
2
Computer Information Systems Department, University of Jordan Amman, 11942, Jordan
3
Computer Information Systems Department, University of Jordan Amman, 11942, Jordan
4
Computer Information Systems Department, University of Jordan Amman, 11942, Jordan
Abstract Gene expression profiling and complementary DNA ( cDNA ) microarray analysis has enabled the measurement of thousands of genes in a single RNA sequence, Scientists use cDNA microarrays to measure the expression levels of large number of genes or to genotype multiple regions of a genome. cDNA microarray Image analysis aims to measure the intensity of each gene presented in the microarray, Move to introduction. In this paper, we present an enhanced algorithm to automate genome Gene expression profiling that is taken from microarray images. The algorithm uses multi-dimensional array based method by classifying genes into multi-dimensional array where each spot has its location in the array and each location in the array contains the gene expression level of that gene so further study, analysis and comparison of the two microarray samples can be conducted easily. The proposed algorithm is fully automated and gives fast result for the gene analysis. Keywords: cDNA, Microarray, Image Processing, Microarray Archiving, Gene Expression Extraction.
1. Introduction Gene expression is the process of coding genes to synthesize proteins and Ribonucleic Acid (RNA) Sequences such as Ribosomal ribonucleic acid (rRNA), Transfer RNA (tRNA), messenger RNA (mRNA) inside cells , The process of gene expression is used in all known life - eukaryotes and prokaryotes, the analysis of these genes gives an important information about proteins and the development of cells . Gene expression levels are best
analyzed with microarray chip where most target sequences are likely to be very different in sequence. [2] Microarray chip contains a set of short Expressed Sequences made from cDNA library. a huge amount of information about the cell can be expressed by determining the gene expressing level The scanning of the microarray chip produces images that contain colored spots, each spot intensity represents the amount of the expression level of genes[3]. Because of the fact that gene locations are predefined and fixed in the microarray we propose a new method for archiving the microarray results by mapping the gene locations into an array in the computer that depend on the location of the microarray of the genes and use this method for the archiving of the genes. 2. The Process of Analyzing analyzing microarray includes many steps, the first step consist of extracting the gene spot from the microarray image, and include foreground and background separation, intensity extraction [4]. And there are many algorithms has been proposed to extract the spot and determining its position previous method were not fully automated and required human interaction as Stefano Lonardi and Yu Luo from Department of Computer Science and Engineering in University of California tested in their paper [3] they wrote : Several methods have been proposed and software tools have been developed.
Copyright (c) 2013 International Journal of Computer Science Issues. All Rights Reserved.
IJCSI International Journal of Computer Science Issues, Vol. 10, Issue 6, No 2, November 2013 ISSN (Print): 1694-0814 | ISSN (Online): 1694-0784 www.IJCSI.org
However, all the software systems they tested require human intervention. At the minimum, these software require the user to specify the geometry of the array, such as the number of grids, number of rows and columns, etc. (see, for example, SPOT from UCSF[5], IMAGENE from BioDiscover [6] and APPLE from University of Washington [7] ). What we study is the real microarray image that is scanned for a real human genome data not the ideal microarray image and there is a big difference between the ideal microarray image and the real image, the ideal microarray image has the following features [8]: the background has no noise , the spots has the same shape , the column are ideal in size and shape and the location of the spots fixed . but in the real microarray there is at least all or one of them is not found in the real microarray image and there is variations on the spot position, irregularities on the spot shape and size [4 ], our improved algorithm solve some of the problems found in the real microarray image to get the results of the gene analysis , archive and storing the results for further researchers study . In this paper we provide improved algorithm to classify the gene profiling in multi-dimensional array, gridding it and assigning a location for each gene spot based on the multi- dimensional array that is assigned to the microarray image and this will be for best segmentation of the spot , archiving the genes and will give the researcher easy method to refer to each gene for comparison , analysis and study of the microarray
204
papers is Kerr et al. [9, 10]. Their group, the Jackson laboratory, has a series of papers to discuss and apply this model (Kerr et al. [10, 11, 12] and Churchill [1], Oleksiak et al. [13], Wu et al. [14]) which are vital reference materials for biologists who are interested in gene expression microarrays. Their main ideas are to use classical ANOVA model to describe data and some incomplete block design theory (Raghavarao [15]) to derive their optimal criterion, Wun-Yi Shu, Yang-Chao Wang In there paper, proposed the optimal criterion, and derive the theoretical upper bound. Then, they introduce the graphical representation of designs, provide some computational results of common use optimal designs and supply the method to construct efficient designs for large numbers of varieties.
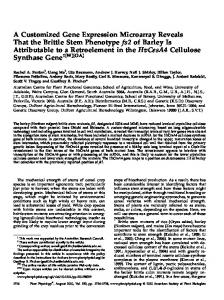
4. Material and Method Microarray gene chip figure [1] that has cDNA, gene fragments, corresponding to portions of known genes figure 1. For Implementation of the algorithm we used Matlab, Matlab Image Processing Toolbox is a collection of functions that extend the capability of the Matlab numeric computing environment. [16].
3. Related Work Only Few researchers have described the microarray data archiving process, Alvis Brzma , Pascal Hingamp and other’s established a standard for recording and reporting microarray-based gene expression data, which will in turn facilitate the establishment of databases and public repositories and enable the development of data analysis tools [7] . M. KATHLEEN KERR and GARY A. CHURCHILL studied the Statistical design and the analysis of gene expression microarray data they relate certain features of microarrays to other kinds of experimental data and argue that classical statistical techniques are appropriate and useful. And they advocate greater attention to experimental design issues and a more prominent role for the ideas of statistical inference in microarray studies [8] . Although recently, there are many papers have been published, discussing the issues of how to model the microarray data to describe the gene expression level and propose a proper criterion to evaluate the design of experiment. One of the most representative
Figure 1: Microarray image
5. Proposed Algorithm Discussion and Results We discuss here the proposed algorithm for cDNA microarray analysis, gene spot classification according to
Copyright (c) 2013 International Journal of Computer Science Issues. All Rights Reserved.
IJCSI International Journal of Computer Science Issues, Vol. 10, Issue 6, No 2, November 2013 ISSN (Print): 1694-0814 | ISSN (Online): 1694-0784 www.IJCSI.org
the position of the gene in the microarray, in the proposed algorithm we used a virtual multi-dimensional array that is applied to the image after determining the location of each gene for the enhanced image. Steps of the proposed algorithm: The first step will be cropping the microarray image into sub microarrays each of these sub microarray consist of fixed number of genes as shown in figure [2]. Since the microarray image is colored and each pixel's in the microarray have 8 bits for every color, and this make a combination of 16 million colors and make it hard to locate the spot position; so we converted it to gray scale image figure [3] . And this will make the microarray image taken more reliable for determining the spot positions and for determining the array coordinate.
205
we have apply index layer and this custom color maps make visualization more affordable. As shown in figure [4-1, 4-2] we can notice that that green and red spot shapes are not the same in both images because the intensity of gene expression is different in both of them. We store the resulted red plane image that is separated, the green plane image and the grayscale image and we will use them to determine the gene location in the next steps of the algorithm.
Figure [4-1] green spot
Figure [2] sub microarray image
Figure [4-2] red spot
Figure [3] gray scale sub microarray image
Since the image was stored in RGB format. And our study focusing for determining the gene expression level will deepened on red and green color of the image after determining the position of the spot we in have extracted the red plane and the green plane figure [4, 5 ] so that we apply the locations further after we determine the array locations and gene positions . For the green and red plane
after turning the image to gray scale now in the second step we need to enhance the image and remove the noise from the images and between the spots and this will be done so that we can determine the dimension of the array that will be applied and the number of columns and rows and the position of the line of the column and the position of the line of the row. For image enhancement we used a single threshold level to the whole image so all spots are detected equally but using the threshold has some risk because of the large differences in spot brightness. After applying threshold despite the risk of losing some spots we got clean spaces between the spots but since we here using threshold just to clean the spaces between the whole column and rows of the whole sub microarray so we can
Copyright (c) 2013 International Journal of Computer Science Issues. All Rights Reserved.
IJCSI International Journal of Computer Science Issues, Vol. 10, Issue 6, No 2, November 2013 ISSN (Print): 1694-0814 | ISSN (Online): 1694-0784 www.IJCSI.org
ignore this risk because we are not using threshold to segment each spot alone. The result we got here clean lines between the spots without noise, the threshold value was automatically determined and the grayscale image now in to binary. The output binary image has values of 0: black for all pixels in the input image with luminance less than level and 1: white for all other pixels. the lower points and the zero values in the gray scale images may represent the points the spaces between genes like the background points and the points that contain noise ; if the value of the function f = 0. [16, 17, 18] this aims to solidify spots because they are not fully filled and have some holes and these holes may affect the gene location determination by giving false results. We have to fill the spots holes not the whole images the whole image may be filled but this would incorrectly fill in the common corner of the spots. to prevent that error we fill each spot alone by looping each gene area for segmentation as shown in figure [6]. We used the solid spots to determine the each array dimensions vertical and horizontal positions as explained in the next step
we repeat the previous step to mean intensity for each row of the image then identify where the centers of the spots are and where the spaces between the spots can be mainly found.
Figure [7] Results without applying threshold and without removing the noise between the spots Table [1.1] sample data for analyzing sub microarray of multidimensional array of 10 rows and 5 columns Position a[0][0] a[1][0] a[2][0] a[3][0] a[4][0] a[5][0] a[6][0] a[7][0] a[8][0] a[9][0]
Figure [6] solid spots
The fourth step is to determine the position of the lines that will consist the multi-dimensional array as shown in the drawing in figure [7]. our goal here to get the ideal lines that consist the multi-dimensional array and this by enhancing the image and clearing the unwanted artifact that is found in between the spots because these artifact will affect the line position determination as shown in figure [8] and to achieve our goal we have started to calculate the horizontal mean for genes spots and we have done this by calculating the mean intensity for each row of the image. This make us identify where the centers of the spots found and where the spaces between the spots can be mainly found. After that we determined the mid-point between each row then we rotate the image 90 degree then
206
value 0.01554 0.02546 0.02345 0.03548 0.02589 0.02548 9 0.02156 0.15987 0.15688 7 0.97545 4
Position a[0][1] a[1][1] a[2][1] a[3][1] a[4][1]
value 0.15547 0.05487 0.02355 0.12569 0.02565
a[5][1]
Position a[0][2] a[1][2] a[2][2] a[3][2] a[4][2] a[5][2]
0.15987 a[6][1] a[7][1]
0.02555 0.03698
a[8][1]
a[6][2] a[7][2] a[8][2]
0.03656 a[9][1]
a[9][2] 0.98877
Table [1.2] sample data for analyzing sub microarray of multidimensional array of 10 rows and 5 columns value
Position
value
Position
value
0.06687 0.02556
a[0][3] a[1][3]
0.15558 0.05584
a[0][4] a[1][4]
0.06955 0.02557
0.15658
a[2][3]
0.15899
a[2][4]
0.02555
0.0365
a[3][3]
0.45858
a[3][4]
0.05455
0.0255
a[4][3]
0.01145
a[4][4]
0.02555
0.0255
a[5][3]
0.05692
a[5][4]
0.06871
0.0235
a[6][3]
0.02554
a[6][4]
0.06981
0.2587
a[7][3]
0.00265
a[7][4]
0.05665
0.0255
a[8][3]
0.69894
A[8]4]
0.03656
0.1558
a[9][3]
0.0248
A[9][4]
0.06565
Copyright (c) 2013 International Journal of Computer Science Issues. All Rights Reserved.
IJCSI International Journal of Computer Science Issues, Vol. 10, Issue 6, No 2, November 2013 ISSN (Print): 1694-0814 | ISSN (Online): 1694-0784 www.IJCSI.org
207
7. References In comparison to previous work in microarray archiving and database construction Alvis Brazma, Ugis Sarkans [22] described a Gene expression databases store information about the absolute or relative abundance of gene transcription products in various biological samples, such as cells from a particular tissue in a particular organism, or a particular cell line. There method provided a databases that allow one to access, select, retrieve and combine for analysis gene expression datasets generated by one's own or other laboratories, while our method in construction the archive file and the database provides more accurate way in referencing the gene data relatively with the microarray experiment itself and it also provide a method for comparing the results with aby other microarray experiment that run similar microarray genes. Rayner TF, Rocca-Serra P, Spellman PT et al. [23] provided A simple spreadsheet-based, MIAME-supportive format for microarray data they proposed a simple tab-delimited, spreadsheet-based format, MAGE-TAB, which became a part of the MAGE microarray data standard and can be used for annotating and communicating microarray data in a MIAME compliant fashion, Schena M, Shalon D, [24] provided Quantitative monitoring of gene expression patterns with a complementary DNA microarray , while our proposed a method used a multi-dimensional array based method by classifying genes into proposed multidimensional array where each spot has its location in the array and each location in the array will contain the gene expression level of that gene that can be referred to in the future for further study, analysis and comparison.
6. Conclusion This paper described an improved automated algorithm for analyzing the cDNA genome microarray images using a multi-dimensional array that give each spot of genes a location in the array and by this location we can study and compare all genes in the same microarray together and archiving the results and offer us the ability to correctly compare the results with any other microarray image. this method is automated and very fast, Microarray image analysis is very important field and play the major role in studding the genome our future work will extend the work for developing new algorithms and methods or improving the existing that is found to measure the intensity of genes in each spot to get the best results for the analysis of genes because the two major steps for microarray researchers is to determine the spots location and archiving the results for immediate and future comparison and that what we have specifically presented in this paper ..
[1]. Istepanian, R., 2003. Microarray image processing: Current status and future directions. IEEE Tran. Nanobioscience. [2]. Shalon, D., Smith, S. J., and Brown, P. O. (1996) A DNA microarray system for analyzing complex DNA samples using two-color fluorescent probe hybridization. Genome Res. 6, 639–645. 52. Lockhart, D. J., Dong, H., Byrne, M. C., Follettie, M. T., Gallo, M. V., Chee, M. [3]. Rafael C. Gonzalez, Richard E. Woods, Digital Image Processing,, Pearson Education, 2004. [4]. Lonardi, S. and Y. Luo, 2004. Gridding and compression of microarray images. IEEE Computational ystems Bioinformatics Conf. (CSB'04) Stanford, CA. [5]. Jain, A.N., T.A. Tokuyasu, A.M. Snijders, R. Segraves, D.G. Albertson and D. Pinkel, 2002. Fully automatic quantification of microarray image data. Genome Research. [6]. Kuklin, A., 2000, Laboratory automation in microarray image processing. American Laboratory. [7]. Buhler, J., T. Ideker and D. Haynor, 2000. Dapple: Improved techniques for finding spots on DNA microarrays. Technical Report [7] Alvis Brazma, Pascal Hingamp and others Minimum information about a microarray experiment (MIAME) toward standards for microarray data, nature genetics. volume 29 • december 2001 [8] M. KATHLEEN KERR* and GARY A. CHURCHILL, Statistical design and the analysis of gene expression microarray data, Genet. Res., Camb. (2001), 77, pp. 123±128 [9] Wun-Yi Shu, Yang-Chao Wang , Optimal Design for Gene Expression Microarrays [10] Kerr, M. K. and Churchill, G. A. (2001). Experimental design for gene expression microarrays. Biostatistics 2, 183201 [11] Kerr, M. K. and Churchill, G. A. (2001). Statistical design and the analysis of expression microarray data. Genet. Res. 77, 123-128. [12] Kerr, M.K., Martin, M., and Churchill, G.A. (2000). Analysis of variance for gene expression microarray data. Journal of Computational Biology, to appear. [13] Oleksiak, M. F., Churchill, G. A. and Crawford D. L. (2002).Variation in gene expression within and among natural populations. Nature genetics. vol. 32,261-266 [14] Wu, H., Kerr, M.K., Cui, X. and Churchill, G.A. (2002).MANOVA: a software package for the analysis of spotted cDNA microarray experiments. to appear. [15] Raghavarao, D. (1971). Constructions and Combinatorial Problems in Design of Experiments. New York: Wiley. [16] Matlab 7 Image Processing Toolbox, Signal Processing Toolbox.
Copyright (c) 2013 International Journal of Computer Science Issues. All Rights Reserved.
IJCSI International Journal of Computer Science Issues, Vol. 10, Issue 6, No 2, November 2013 ISSN (Print): 1694-0814 | ISSN (Online): 1694-0784 www.IJCSI.org
[17]. Kuklin, A., 2000. Laboratory automation In microarray image processing. American Laboratory. [18]. Angulo, J. and J. Serra, 2003. Automatic analysis of DNA microarray images using mathematical morphology. Bioinformatics. [19] Basim Alhadidi, Hussam Nawwaf Fakhouri and Omar S. AlMousa 2006, cDNA Microarray Genome Image rocessing Using Fixed Spot Position, American Journal of Applied Sciences , Volume: 3 issue 2 [20] E.R. Dougherty, J. Barrera, M. Brun, S. Kim, R.M. Cesar, Y. Chen, M. Bittner, and J.M. Trent. Inference from lustering with application to gene-expression microarrays.Journal of Computational Biology, 9:105–126, 2002. [21] R. Spang, C. Blanchette, H. Zuzan, J. R. Marks, J. Nevins, and M. West. Prediction and uncertainty in the analysis of gene expression profiles. In E. Wingender, and I. Liebich, editors, Proceedings of the German Conference on Bioinformatics GCB 2001, Braunschweig, 2001. Omar Y. Adwan received his BSc in computer science from Eastern Michigan University, USA. MSc and PhD in Computer science from George Washington University, USA, majoring in Software Engineering. Currently he is the chairman of Computer Information Systems at the University of Jordan. His research interests include Software Engineering, Information Security, Quality Assurance, Software Architecture, and Information Systems Audit. Amjad Hudaib is an associate Prof. of software engineering at the department of computer information systems, University of Jordan. He received his Ph.D. in Computer Science/ Software Engineering from University of Pisa, Italy in 2003. He is now the Director of Accreditation and Quality Assurance Center at the University of Jordan. His research interests include software engineering, software verification and validation, quality assurance, image processing, algorithms, and e-learning.
Hussam Nawwaf Fakhouri received his Master Degree in Information Systems from the University of Jordan, Amman, Jordan, in 2013. His research interests are in Bioinformatics, Image Processing, e-learning, algorithms.
Loai Alnemer is Assistant Professor in the Computer Information Systems Department at the University of Jordan. He received his Ph.D. in Computer Science from North Dakota State University, USA, in 2011. His research interests are in dataminig, Machine learning, and Bioinformatics.
Copyright (c) 2013 International Journal of Computer Science Issues. All Rights Reserved.
208