Jonathan H. Dennis. Abstract ... applied to mammalian systems (Dennis et al.,. 2007; Ozsolak et al., .... positions (Keene and Elgin, 1981), and the microarray is ...
Microarray Mapping of Nucleosome Position
19
Brian Spetman, Sarah Lueking, Brooke Roberts and Jonathan H. Dennis
Abstract The location and density of nucleosomes in the eukaryotic genome plays a role in regulating nuclear processes including transcription, replication, recombination, and repair. Microarray mapping of nucleosomally protected DNA has emerged as a powerful, cost-effective, highthroughput method to analyse the relationship between nucleosome position and genomic regulation. In this chapter we discuss experimental considerations such as sample preparation and microarray design. In addition, two procedures are detailed: (1) ‘formaldehyde cross-link and harvest cells, isolate nuclei, and MNase cut chromatin’, and (2) ‘isolation of mononucleosomally protected DNA and fluorescent labelling of DNA for microarray hybridization’. With the information specified in this chapter, most any laboratory equipped for molecular biology with institutional or commercial access to microarray facilities should be should be able to map nucleosome position and occupancy. Introduction Understanding the functional organization of the genome remains one of the biggest challenges in biology. Eukaryotic genomes consist of DNA that is packaged together with histone proteins into chromatin. The basic subunit of chromatin is the nucleosome, composed of approximately 150 bp of DNA wrapped 1.65 times around a histone octamer, containing two copies each of the four histone proteins H2A, H2B, H3, and H4 (reviewed by Kornberg and Lorch, 1999). A
topic of long-standing interest is the positioning of nucleosomes along the genome, which presumably depends on a variety of factors, including properties of the sequence itself, physical constraints, epigenetic factors such as ATP-dependent chromatin remodelling and cellular memory complexes (e.g. trithorax and Polycomb-group proteins), and alterations in the biochemical composition of the histone octamer. This organization results in architectures that facilitate or impede DNA-binding interactions required for nuclear processes such as transcription, replication, recombination, repair, and transposition (Koerber et al., 2009). Knowledge of nucleosome position provides a critically important point of reference for interpreting higher order structures and epigenetic modification. Note the important distinction between ‘nucleosome position’ and ‘nucleosome occupancy.’ The latter is a measure of nucleosome density over a broad genomic locus and does not refer to an exact genomic address containing 150 bp. ‘Nucleosome position’ refers to the likelihood that nucleosomes from a population of cells will be housed at an exact location along the genomic sequence occupying 150 bp (Pugh, 2010). Both ‘occupancy’ and ‘position’ information can be extracted from the microarray maps described in this chapter, but for consistency, we will use ‘nucleosome position’ throughout. Maps of nucleosome position can be used to generate novel testable hypotheses about the role of nucleosome–DNA interactions in transcription and other chromosomal regulatory processes. Pioneers in the study of chromatin mapped nucleosome positions at several discrete loci (for
UNCORRECTED FIRST PROOFS
338 | Spetman et al.
examples, see Benezra et al., 1986; Richard-Foy and Hager, 1987; Ercan and Simpson, 2004), however, generating genome-scale sets of data was not possible until recently. Yuan et al. (2005) published an innovative method for measuring nucleosomal position across broad areas of the yeast genome by hybridizing nucleosomally protected DNA fragments to a high-density tiling microarray. Soon thereafter, this method was applied to mammalian systems (Dennis et al., 2007; Ozsolak et al., 2007). Microarray-based mapping of nucleosome position has emerged as a relatively affordable, high-throughput, genomescale method accessible to any lab equipped for the most basic molecular-biology manipulations. These and other genome-wide maps (for example those of Mavrich et al., 2008; Schones et al., 2008; Weiner et al., 2010) have revealed the nucleosomal context of regulatory elements and transcription start sites. These studies have verified the common nucleosomal structure around genes, defining nucleosome positions around the transcriptional initiation and termination sites. Long stretches of linker DNA (~150–200 bp) were also found to be a common feature of these start sites. These nucleosome free regions are believed to have an important function in regulation of transcription. They are flanked by strongly positioned nucleosomes both upstream (the ‘–1 nucleosome’) and downstream (the ‘+1 nucleosome’) of the nucleosome-free region. The –1 nucleosome is normally found at –300 to –150 relative to the start site and is often the target of covalent histone modifications associated with gene activation or repression ( Jiang and Pugh, 2009). The +1 nucleosome has a tighter nucleosome positioning signal and frequently contains the transcription-associated histone variants H2AZ and H3.3 (Malik and Henikoff, 2003, Wirbelauer et al., 2003). Nucleosome mapping studies established the existence of nucleosome free regions, an important observation confirming earlier models of nucleosome phasing, such as statistical positioning of nucleosomes (Kornberg, 1981; Yuan et al., 2005; Gupta et al., 2008; Mavrich et al., 2008). Genome-wide studies of nucleosome position have aided in defining the features intrinsic to the DNA itself that play a role in positioning
nucleosomes. Again, early seminal work by chromatin biologists working from first principles defined a set of rules describing DNA sequences that favoured or excluded the formation of nucleosomes (Lohr et al., 1977; Trifonov, 1980; Mengeritsky and Trifonov, 1983; Drew and Travers, 1985; Satchwell et al., 1986; Hsieh and Griffith, 1988; Wang and Griffith, 1996; Travers and Drew, 1997; Lowary and Widom, 1998). The arrival of genome-wide sets of nucleosome position data allowed researchers to use sequence information from hundreds to thousands of positioned nucleosomes to train computational models that predict nucleosome position. These predictive algorithms are consistent with earlier models of nucleosome position. A handful of these algorithms have increased our understanding of DNA-encoded chromatin regulatory features and served as a platform for studying the evolution of chromatin regulatory sequences. Genome-wide nucleosome position data will continue to fuel the generation of these important DNA sequencebased nucleosome-prediction models trained from specific genomic loci or from a variety of organisms. High density tiling microarrays provide an opportunity to study nucleosome position in a massively parallel context across whole genomes and multiple experimental conditions. The microarray can be designed to study non-repetitive loci in any sequenced genome. Currently microarrays contain between 100,000 and 2 million oligonucleotide probes on a standard 1 in. by 3 in. slide, and slides containing up to eight million probes are on the horizon. The density of oligonucleotide features printed on a standard microarray is following a trend consistent with Moore’s law; the number of probes on the NimbleGen platform, for example, has doubled every three years since 2000. Next generation massively parallel sequencing is emerging as a powerful tool for many genomic applications, including nucleosome mapping. We anticipate next generation sequencing will supersede microarrays for nucleosome mapping within the next decade. Presently, next generation sequencing requires a substantial financial and bioinformatic commitment, not practical for typical academic laboratories. The financial and bioinformatic overhead for microarray analysis
UNCORRECTED FIRST PROOFS
Nucleosome Mapping | 339
is well within the means of most research labs. Currently, however, microarrays are keeping pace with the throughput of other genome-analysis technologies, such as massively parallel sequencing, and should continue to serve as an important genome analysis tool for the next several years. Here we describe a method of mapping nucleosome position in tissue-culture cell lines that uses micrococcal nuclease (MNase)-treated chromatin and tiling microarrays. MNase cleaves chromatinized DNA preferentially in internucleosomal linker regions. Chromatin can be digested to mononucleosomes, and the associated DNA fragments can be labelled with fluorescent dyes and hybridized to microarrays. The fluorescent intensity of sample specifically hybridized to the array is used to determine the genomic location of positioned nucleosomes. Here, we discuss experimental considerations with respect to preparation and planning, such as pre-extraction of nonchromatin proteins with high salt, cross-linking by means of formaldehyde to limit the redistribution of nucleosomes, MNase cleavage conditions, and microarray design. Procedure 1 explains how to cross-link and harvest cells, isolate nuclei, and cut with MNase. Procedure 2 explains how to isolate and fluorescently label mononucleosomally protected DNA for hybridization to a tiling microarray. Experimental considerations Pre-extraction of non-chromatin proteins with high salt In this experiment, the possibility cannot be ruled out, without further confirmatory experiments, that a fraction of hybridization signal comes from non-nucleosomal protections. Protection from micrococcal nuclease cleavage may come from any number of DNA-associated factors: transcription factors, cellular memory proteins, or other protein complexes. We are confident, however, that a majority of our hybridization signal results from nucleosomal protections, for multiple reasons: MNase has a long history as the internucleosomal reagent of choice for determining nucleosome positions (Keene and Elgin, 1981), and the microarray is probed with gel-purified fragments
of ~150 bp, a size consistent with mononucleosomal protections. ‘Non-histone’ proteins can be extracted from the chromatin for the analysis of protections by bona fide chromatin proteins (histones and strongly associated proteins). Nonhistone proteins are destabilized at relatively low salt concentrations (250–350 mM NaCl), whereas the nucleosome core particle is stable up to 600 mM NaCl (Weintraub et al., 1975; Stein and Page, 1980). Pre-extraction occurs immediately before formaldehyde fixation. Cells can be pre-extracted with phosphate-buffered saline supplemented with 150 mM NaCl, 0.2% Tween 20, and 0.2% Triton X-100 for 5 min at room temperature. Once the pre-extraction has been completed, one may proceed as detailed in the procedure below. Formaldehyde cross-linking to limit the redistribution of nucleosomes Formaldehyde is a common reagent used to crosslink primary amines and imines (found on lysine, arginine, and histidine amino acids and adenine and cytosine nucleic acids) to preserve chromatin structure (Solomon and Varshavsky, 1985). The reaction between the electrophilic carbonyl of the formaldehyde and the amino or imino groups on DNA and proteins forms a reactive Schiff base intermediate. This intermediate reacts with nearby (~2-Å) nucleophiles on DNA or protein to form a covalent linkage. Adding an excess of primary amine, in this protocol the relatively inexpensive amino acid glycine, quenches the reaction. The use of formaldehyde to preserve chromatin structure has several advantages. From a practical standpoint, both formaldehyde and glycine are inexpensive and thus available for use in all laboratories. Formaldehyde is a small molecule that is highly permeant to cell membranes. Formaldehyde fixation is rapid, occurring within minutes after the compound is added to living cells and tissues. Importantly, the reaction is reversible at high temperatures, so DNA can be recovered for hybridization to the microarray. MNase cleavage conditions A vitally important consideration is the population of oligomers produced by a particular concentration of MNase when nucleosomal protection is
UNCORRECTED FIRST PROOFS
340 | Spetman et al.
mapping. Digestion of large, complex genomes, like those of mammals, with a single concentration of MNase can cause overrepresentation of a particular fraction of the genome. In the protocol below, we suggest using a broad titration of MNase and combining the mononucleosomally protected DNA so that mononucleosomally protected fragments from areas of the genome in various states of accessibility and condensation will be represented. Documentation of the populations of oligomers used to create the representative library of mononucleosomally protected DNA is imperative as differing degrees of digestion may result in slightly different nucleosome position patterns. Analysis and interpretation of nucleosomal position patterns, thus, must always occur in the context of the starting material. Microarray design Thoughtful and informed microarray design is essential in this experiment, and proper attention should be paid to preparing the best design possible. Several factors must be taken into account, including: probe length, strandedness, redundancy, tiling density, and repeat masking. Multiple platforms are available. We have the most experience using the NimbleGen platform and the following specifications apply to Nimblegen microarrays. Probes are generally isothermal, range between 50 and 70 bp in length and are printed in duplicate on both strands, forward and reverse. This redundancy allows greater confidence in the signal at each probe and allows observation of strand-specific effects. Probes are selected from a repeat-masked genomic sequence with a maximum spacing of 20 bp. Inclusion of repeats is uninformative and may lead to signal saturation and signal bleeding from one feature to an adjacent feature. Commercially available arrays generally come with microarray design support (e.g. NimbleGen has a bioinformatics and microarray design team; Agilent provides the web tool eArray). Platform and cost considerations Several array platforms exist, and our laboratory has used several including in-house prepared, and commercially available. We have the most experience using the NimbleGen platform. We
have developed a cost-effective, high-throughput nucleosome mapping pipeline. We take advantage of the NimbleGen HD2 design (2.1 million features per microarray) 12-plex (12 individual isolated experiments per microarray) customdesigned microarrays. These microarrays are a cost-effective approach to nucleosome occupancy mapping, with robust information content and data quality, and built in replicates for controls. The 12-plex format allows for 135,000 oligonucleotide probes to be queried in each experiment. These 135,000 probes are sufficient to assay 1 kb surrounding the transcriptional start site (TSS) of 200 genes at approximately 10 bp resolution. Twelve experiments per microarray brings the cost per experiment to around US$200 per subarray. Procedures Procedure 1: formaldehyde crosslink and harvest cells, isolate nuclei, and mnase cut chromatin Breakpoints indicate stopping points at which samples may be stored at –20°C before moving onto the next step. Materials • 2.5 × 10⁷ cells (adherent or suspension cells) • 1 × phosphate-buffered saline • 10% methanol-free formaldehyde • 2.5 M glycine (Sigma Aldrich Co., St Louis, MO, USA; product number G8898) • 1× nucleus-isolation buffer (see recipe) • 1× glycerol-pad buffer (see recipe) • 20 units/µl MNase from Staphylococcus aureus, Strain ATCC #27735; I.U.B.: 3.1.31.1 (Worthington Biochemical Corp., Lakewood, NJ, USA, cat. no. LS004798) • MNase cleavage buffer (see recipe; 4 mM CaCl2, 25 mM KCl, 4 mM MgCl2, 12.5% glycerol, 50 mM Tris, pH 7.5) • 500 mM EDTA, pH 8.0 • 20 µg/µl Proteinase K from Tritirachium album (Applied Biosystems/Ambion Inc., Austin, TX, USA, cat. no. AM2546) • 20% sodium dodecyl sulfate • Phenol, saturated, buffered to pH 8
UNCORRECTED FIRST PROOFS
Nucleosome Mapping | 341
• Phenol–chloroform–isoamyl alcohol (25:24:1) • Chloroform • 3.0 M sodium acetate • 100% ethanol • 70% ethanol • Tris-EDTA (TE) • Miracloth (EMD Chemicals/Calbiochem, Gibbstown, NJ, USA; product number 475855-1R) • Glycogen, 20 mg/ml aqueous solution • 15-ml conical tubes • 50-ml conical tubes • 1.5-ml microcentrifuge tubes. Solutions 1 × nucleus isolation buffer • 0.3 M sucrose • 2 mM MgOAc2 • 1 mM CaCl2 • 1% Nonidet P-40 • 10 mM Hepes, pH 7.8. 1× glycerol-pad buffer • 25% glycerol • 5 mM MgOAc2 • mM EDTA • 10 mM Hepes, pH 7.8. 1 × MNase cleavage buffer • mM CaCl2 • 25 mM KCl • mM MgCl2 • 12.5% glycerol • 50 mM Hepes, pH 7.8. MNase stock MNase treatments are a critical and pivotal step in these experiments. So that experimental variation will be minimized, the MNase is stored at a concentration of 20 units/µl at –80°C in small aliquots (30 µl) from single lots purchased from Worthington Biochemical Corp. Aliquots in current use are stored at –20°C, where the glycerol prevents repeated freezing and thawing. • 10 mM Hepes, pH 7.8 • 25 mM KCl
• mM CaCl2 • 50% glycerol • 20 units/µl MNase. Cell harvest 1 Harvest 2.5 × 10⁷ cells by centrifugation at 1000 × g for 5 min. 2 Remove media and gently and quickly resuspend cells in 10.0 ml of phosphatebuffered saline. (For adherent cells, remove media tissue-culture plate and add the saline directly to the plate, where the cells will still be attached.) Note This protocol is adaptable to many cell types and cell sources. We have used this protocol to prepare MNase-cleaved chromatin for microarray analysis from cell culture lines from human, monkey, mouse, and hamster using this protocol. Both adherent and suspension cell lines work well. Additionally, we have used crushed and homogenized primary human basal cell carcinoma samples and primary tissue from the pant Zea mays in this protocol. Formaldehyde cross-link 1 Cross-link the cells by adding formaldehyde to final concentration of 1% and incubate for 10 min at room temperature with gentle rocking on a rocking platform. 2 Add glycine to a final concentration of 125 mM to quench the formaldehyde. 3 Collect the cells by centrifugation at 1000 × g for 10 min (collect adherent cells by scraping with a cell scraper; and transfer them to a conical tube and centrifuge them 1000 × g for 10 min). From this step forward, suspended and adherent cells are treated alike. Breakpoint. Samples may be stored at –20°C before moving onto the next steps. Isolation of nuclei 1 Resuspend cell pellets in 15 ml nucleusisolation buffer. 2 Add 15 ml glycerol-pad buffer to a 50-ml conical tube. 3 To isolate nuclei, layer cell resuspension onto
UNCORRECTED FIRST PROOFS
342 | Spetman et al.
the glycerol-pad buffer by slowly pipetting it down the side of the tube. 4 Be sure to pipette the cell suspension very slowly, gently dripping down the side using gravity. You will see two layers begin to form. 5 Centrifuge at 1000 × g for 10 min. 6 Discard supernatant and resuspend in 1 ml of glycerol-pad buffer 7 Pellet should be a pure white colour (because it consists of nuclei; cells would form a tan pellet). 8 Place a 200-µl aliquot in each of five 1.5-ml microcentrifuge tubes. Each tube now contains approximately 5 × 10⁶ nuclei. 9 Prelabel the five tubes with the amounts of MNase that will be used in the titration (e.g. 20 U/ml MNase; see below for MNase titration instructions). Note that you will at this point have 5 × 10⁶ cells in each of the 200-µl tubes. This protocol can be scaled and can be adjusted for different cell lines and cell counts. 10 Centrifuge at 1000× g for 10 min in a tabletop centrifuge. MNase cleavage of chromatin 1 While the nuclei are being centrifuged (step 15), prepare an MNase titration series of 10 U/ml, 5 U/ml, 2.5 U/ml, 1.25 U/ml, and 0.6 U/ml MNase in MNase cleavage buffer. We recommend preparing a 20-U/ml sample with 20-U/µl MNase stock and performing a 1:1 serial dilution. We describe a typical titration range; cell type-specific results may vary and should be adjusted accordingly. It is also possible to titrate not only MNase concentration but also digestion time. Parameters given in this protocol may serve as a starting point for individual researchers customized protocols. 2 Carefully remove supernatant from one tube and resuspend the pellet of nuclei in 500 µl of the 10-U/ml MNase sample prepared in the previous step. 3 Immediately incubate at 37°C for 5 min. 4 Stop the reaction with a final concentration 50 mM EDTA. 5 Add Proteinase K to a final concentration of 0.2 µg/µl. 6 Add sodium dodecyl sulfate to a final concentration of 1%.
7 8
Incubate at 65°C for 6 h to overnight to reverse the cross-links. Repeat steps 16–22, separately, for each of the 5 U/ml, 2.5 U/ml, 1.25 U/ml, and 0.6 U/ml MNase concentrations. Once the researcher has become familiar with the protocol, all five MNase concentrations can be run simultaneously; each MNase concentration is added 30 s after the last, and each reaction stopped 30 s after the last.
Breakpoint. Samples may be stored at –20°C before moving onto the next steps. Isolation of MNase cut DNA This protocol is for the isolation, purification and characterization of DNA from chromatin digestions. Maximal recovery of small amounts of DNA is achieved with this protocol, and the final product DNA can be directly and immediately used for further analysis. 1
In a fume hood, add one volume of Trissaturated phenol, pH 8, to sample tubes and vortex. 2 Centrifuge at ~14,500 g (13,000 rpm) in a tabletop microcentrifuge for 5 min. 3 Remove the upper, aqueous phase and transfer it to a new 1.5-ml microcentrifuge tube. 4 Add 1 volume of phenol:chloroform:isoamyl alcohol (25:24:1) and vortex. 5 Centrifuge at ~14,500 × g (13,000 rpm) in a tabletop centrifuge for 5 min. 6 Remove the upper, aqueous phase and transfer it to a new 1.5-ml microcentrifuge tube, as in step 26. Take care not to disturb the interface between the aqueous and organic layers. 7 Add one volume of chloroform and vortex. 8 Centrifuge at ~14,500 × g (13,000 rpm) in a tabletop centrifuge for 5 min. 9 Remove the upper, aqueous phase and transfer it to a new 1.5-ml microcentrifuge tube, as in step 26. Again, take care not to disturb the interface between the aqueous and organic layers. 10 Add 1/10 volume of 3 M sodium acetate. Mix well by inversion. Note: A co-precipitant such as glycogen may be added at this point but in our experience has not been necessary.
UNCORRECTED FIRST PROOFS
Nucleosome Mapping | 343
11 Add two volumes of 100% ethanol and vortex. 12 Incubate at room temperature for 30 min. 13 Centrifuge at 14,500 × g (13,000 rpm) in a tabletop centrifuge for 10 min. 14 Discard supernatant and retain the DNA pellet. 15 Add 1 ml of 70% ethanol to wash away excess salt. 16 Centrifuge at ~14,500 × g (13,000 rpm) in a tabletop centrifuge for 10 min. 17 Discard supernatant. 18 Vacuum dry the remaining pellet for 5 min to remove any residual alcohol. Take care not to overdry it. 19 Resuspend the pellet in 100 µl Tris-EDTA. 20 Allow DNA to dissolve completely. Vortex lightly and store at 4°C. 21 Quantify the DNA. Read the OD260 using a spectrophotometer to obtain DNA concentration in ng/µl. The OD260/280 should read between 1.7 and 1.9, and the 260/230 between 2.0 and 2.2. We generally realize yields of approximately 20µg of DNA per 5 × 10⁶ nuclei reaction. 22 Verify MNase digestion by resolving on a gel.
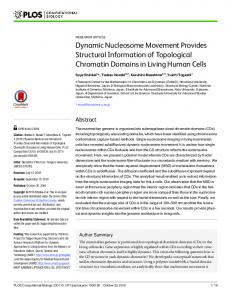
Load 0.25 to 0.5 µg DNA from each sample on a 2% agarose gel to assess the level of MNase cleavage of chromatin (Fig. 19.1). Breakpoint. Samples may be stored at –20°C before moving onto the next steps. Procedure 2: Isolation of mononucleosomally protected DNA and fluorescent labelling of DNA for microarray hybridization Isolation of mononucleosomally protected DNA 1 Load 20 µg of each DNA (determined by the concentration of DNA from A260 reading) on a 1% agarose gel. 2 Cut out the mononucleosomal band across each MNase concentration. The mononucleosomal band should be cut across several titrations to ensure equal representation of the genome. 3 Place the gel slice in a spin column. A spin column can be prepared from a 3-ml syringe; remove the plunger and line the bottom of the
LOW RESOLUTION ARTWORK [MNase]
4.3 kbp
2.0 kbp
7N
6N
5N
4N
500 bp
3N
2N
N
Figure 19.1 MNase titration digestion pattern. 5 × 10⁶ human U-937 nuclei in a volume of 500 µl were digested with concentrations of MNase consistent with this protocol for 5 min at 37°C. DNA was isolated, and 250-ng samples were run on a 2% agarose Tris-acetate EDTA gel. The gel shows a clear nucleosomal ladder with banding at regular 150 bp intervals representing multimers of nucleosomes (N, mononucleosome; 2N, dinucleosome; 3N, trinucleosome, etc.). The lowest molecular-weight band is 150 bp, consistent with nucleosomal protection. UNCORRECTED FIRST PROOFS
344 | Spetman et al.
4 5 6 7
syringe barrel with Miracloth. The Miracloth can be held in place by the syringe stopper, which has had a hole cut into it. Freeze the gel slice overnight at –80°C. Spin the thawed gel slice in the spin column at 2000 × g through Miracloth for 30 min. Add glycogen to the flow-through to a final concentration of 20 µg/ml from a 20 mg/ml aqueous solution stock. Perform standard ethanol precipitation as outlined in steps 33–45 under (Procedure 1).
Breakpoint. Samples may be stored at –20°C before moving onto the next steps. Fluorescent labelling of DNA We have successfully used the following protocol (derived from a procedure outlined by NimbleGen) to label material for NimbleGen and in-house-prepared microarrays. Protocols from other platforms should work similarly and should be suitable in this procedure. A fluorescently labelled random 7-mer oligonucleotide primer is used in a Klenow fill-in reaction to label the mononucleosomally protected and bare genomic reference DNA samples. The mononucleosomally protected DNA sample is usually labelled with a fluorescently labelled Cy3 primer, and reference bare genomic DNA is labelled with a fluorescently labelled Cy5 primer. One microgram of sample is needed for each labelling reaction. The labelling materials and labelling procedure can be obtained from the array manufacturer. Efficient labelling is particularly important for a robust microarray hybridization signal. Hybridization is always according to the manufacturer’s protocol. Materials • 0.5 mg/ml random heptamers labelled with Cy3 (supplied by IDT, custom order) in primer resuspension buffer • 0.5 mg/ml random heptamers labelled with Cy5 (supplied by IDT, custom order) in primer resuspension buffer • 5 mM dNTP mix • 50 U/µl DNA Polymerase I, Large (Klenow) Fragment (New England Biolabs, Ipswich, MA, USA: cat. no. M0210M) • 0.5-M EDTA
• • • • •
5-M NaCl Isopropanol 80% EtOH, ice cold 1.5-ml tubes MicroAmp® Reaction Tube with Cap, 0.2 ml (Life Technologies, Carlsbad, CA, USA; part number N8010540) • Thermal cycler. Solutions Primer resuspension buffer (2.5× Klenow reaction buffer) • 125 mM Tris (pH 7.2) • 125 mM NaCl • 12.5 mM MgCl2 • 25 mM β-mercaptoethanol • 0.025% Triton X-100 10× dNTP solution • 10 mM Tris, pH 8.0 • 1 mM EDTA • 5 mM dATP, dCTP, dGTP, dTTP. Primer annealing 1 Assemble a primer-annealing reaction in a 0.2-µl PCR tube containing 1 µg of DNA to be labelled and 40 µl of fluorescent heptamer. We recommend 40 µl of DNA at 25 ng/µl and 40 µl of random heptamers at 0.5 µg/µl for a total volume of 80 µl. 2 Bring the volume to 80 µl with nuclease-free water. 3 Denature samples at 98°C for 10 min in a thermal cycler. 4 Move reaction to ice immediately for 2 min. For best annealing of the labelled primer to the DNA the reaction must move immediately to the ice from the 98°C incubation. Primer extension with Klenow Fragment of DNA Polymerase 1 Prepare dNTP/Klenow master mix by combining 8 µl nuclease-free water, 10 µl of 5 mM dNTP solution, and 2 µl of 50 U/µl Klenow polymerase per sample. 2 Add 20 µl dNTP/Klenow master mix to tube of primer-annealed samples, pipette to mix (do not vortex).
UNCORRECTED FIRST PROOFS
Nucleosome Mapping | 345
log2 (nucleosomal/bare genomic)
CD69 gene
LOW RESOLUTION ARTWORK
9912500
9912500
9912500
9912500
9912500
9912500
9912500
genomic posi0on on human chromosome 12
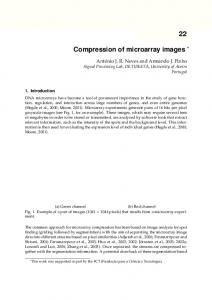
Figure 19.2 Typical microarray mapping results around a mammalian transcription start site. Mononucleosomally protected DNA and a bare genomic reference DNA were isolated from human U-937 cells, fluorescently labelled, and hybridized to a high density tiling microarray. The microarray was processed using NimbleScan v2.5 software and the resulting files were plotted using the R software environment for statistical computing and graphics. The plot shows the 2 kilobases surrounding the transcription start site of the CD69 gene. The X-axis indicates genomic position and the Y-axis indicates log2(nucleosomal/ bare genomic) hybridization signals (higher values indicate greater nucleosomal protection). Ovals indicate suggested nucleosome arrangement. Arrow indicates transcription start site.
3
Briefly spin contents to the bottom of the tube. 4 Incubate primer-extension reaction for 2 h at 37°C in a thermal cycler with a heated lid. 5 Add 10 µl of 0.5 M EDTA to stop the reaction. 6 Add 11.5 µl of 5 M NaCl. 7 Vortex and briefly spin contents to the bottom of the tube. 8 Transfer entire reaction (approx. 121.5 µl) to a 1.5-ml tube containing 110 µl of isopropanol. 9 Vortex, then incubate at room temperature for 10 min in the dark. These samples must be protected from light as much as possible. 10 Centrifuge at 12,000 × g for 10 min. You should see a clearly visible colourful pellet in the bottom of the tube. The Cy3 pellet will be pink, and the Cy5 pellet will be blue. 11 Pipette off and discard the supernatant (do not disturb the pellet), rinse pellet with 500 µl of ice-cold 80% EtOH. Make sure to dislodge and completely wash the pellet. 12 Centrifuge at 12,000 × g for 2 min.
13 Remove and discard the supernatant and dry pellets in SpeedVac for about 5 min or until dry. Do not overdry. 14 The labelled reaction can be stored as a dry pellet at –20°C for up to 1 month. Breakpoint. Samples may be stored at –20°C before moving onto the next steps. 1
2 3 4
Resuspend the pellet in 25 µl nuclease-free water, vortex gently, make sure the pellet goes fully back into solution, allow 5 min at RT in the dark. Vortex and briefly spin contents to the bottom of the tube. Quantify the DNA. The fluorescent dyes will not affect these readings. From each 1 µg labelling reaction, expect at least 20 µg, total quantities can be 3 µg/µl or greater. The results from the spectrophotometer will reveal whether the labelling reaction has succeeded. A good labelling reaction should produce at least 20 µg in your entire
UNCORRECTED FIRST PROOFS
346 | Spetman et al.
sample. Once the sample is labelled correctly it is ready to be divided into aliquots, combined with the reference sample, and hybridized to the microarray. Hybridization quantities and processes are provided by the microarray manufacturer. Note that specific hybridization protocols exist for each array architecture, so the total quantity of sample hybridized to the array and the hybridization time are specific for each array. Data analysis Currently there are no commercially available tools designed specifically for the analysis of nucleosome mapping data. The microarray data may be analysed using standard graphing tools. The log(bare genomic/nucleosomal) signal intensities may be plotted to indicate regions of increased or decreased nucleosomal occupancy. We have developed a suite of tools that work in the R software environment for statistical computing and graphics. A copy of these tools is available upon request. Fig. 19.2 shows the typical results from a nucleosome mapping experiment. References
Benezra, R., Cantor, C.R., and Axel, R. (1986). Nucleosomes are phased along the mouse beta-major globin gene in erythroid and nonerythroid cells. Cell 44, 697–704. Dennis, J.H., Fan, H.Y., Reynolds, S.M., Yuan, G., Meldrim, J.C., Richter, D.J., Peterson, D.G., Rando, O.J., Noble, W.S., and Kingston, R.. (2007). Independent and complementary methods for large-scale structural analysis of mammalian chromatin. Genome Res. 17, 928–939. Drew, H.R., and Travers, A.A. (1985). DNA bending and its relation to nucleosome positioning. J. Mol. Biol. 186, 773–790. Ercan, S., and Simpson, R.T. (2004). Global chromatin structure of 45000 base pairs of chromosome III in a- and α-cell yeast and during mating-type switching. Mol. Cell Biol. 24, 10026–10035. Gupta, S., Dennis, J., Thurman, R.E., Kingston, R., Stamatoyannopoulos, J.A. and Noble, W.S. (2008). Predicting human nucleosome occupancy from primary sequence. PLoS Comput. Biol. 4, e1000134. Hsieh, C.H., and Griffith, J.D. (1988). The terminus of SV40 DNA replication and transcription contains a sharp sequence-directed curve. Cell 52, 535–544. Jiang, C., and Pugh, B.F. (2009) Nucleosome positioning and gene regulation: advances through genomics. Nat. Rev. Genet. 10, 161–172.
Keene, M.A., Elgin, S.C. (1981) Micrococcal nuclease as a probe of DNA sequence organization and chromatin structure. Cell 27, 57–64. Kornberg, R. (1981). The location of nucleosomes in chromatin: specific or statistical. Nature 292, 579–580. Kornberg, R.D., and Lorch, Y. (1999). Twenty-five years of the nucleosome, fundamental particle of the eukaryote chromosome. Cell 98, 285–294. Koerber, R.T., Rhee, H.S., Jiang, C., and Pugh, B.F. (2009). Interaction of transcriptional regulators with specific nucleosomes across the Saccharomyces genome. Mol. Cell 35, 889–902. Lohr, D., Tatchell, K., and Van Holde, K.E. (1977). On the occurrence of nucleosome phasing in chromatin. Cell 12, 829–836. Lowary, P.T., and Widom, J. (1998). New DNA sequence rules for high affinity binding to histone octamer and sequence-directed nucleosome positioning. J. Mol. Biol. 276, 19–42. Mavrich, T.N., Ioshikhes, I.P., Venters, B.J., Jiang, C., Tomsho, L.P., Qi, J., Schuster, S.C., Albert, I., and Pugh, B.F. (2008). A barrier nucleosome model for statistical positioning of nucleosomes throughout the yeast genome. Genome Res. 18, 1073–1083. Malik, H.S. and Henikoff S. (2003) Phylogenomics of the nucleosome. Nat. Struct. Biol. 10, 882–91. Mavrich, T.N., Jiang, C., Ioshikhes, I.P., Li, X., Venters, B.J., Zanton, S.J., Tomsho, L.P., Qi, J., Glaser, R.L., Schuster, S.C., Gilmour, D.S., Albert, I., and Pugh, B.F. (2008). Nucleosome organization in the Drosophila genome. Nature 453, 358–362. Mengeritsky, G., and Trifonov, E.N. (1983). Nucleotide sequence-directed mapping of the nucleosomes. Nucleic Acids Res. 11, 3833–3851. Ozsolak, F., Song, J.S., Liu, X.S., and Fisher, D.E. (2007). High-throughput mapping of the chromatin structure of human promoters. Nat. Biotechnol. 25, 244–248. Pugh, B.F. (2010). A preoccupied position on nucleosomes. Nat. Struct. Mol. Biol. 17, 923. Richard-Foy, H., and Hager, G. L. (1987). Sequencespecific positioning of nucleosomes over the steroid-inducible MMTV promoter. EMBO J. 6, 2321–2328. Satchwell, S.C., Drew, H.R., and Travers, A.A. (1986). Sequence periodicities in chicken nucleosome core DNA. J. Mol. Biol. 191, 659–675. Schones, D.E., Cui, K., Cuddapah, S., Roh, T.Y., Barski, A., Wang, Z., Wei, G. and Zhao, K. (2008). Dynamic regulation of nucleosome positioning in the human genome. Cell 132, 887–898. Solomon, M.J., and Varshavsky, A. (1985). Formaldehydemediated DNA–protein cross-linking: a probe for in vivo chromatin structures. Proc. Natl. Acad. Sci. USA 82, 6470–6474. Stein, A., and Page, D. (1980). Core histone associations in solutions of high salt. An osmotic pressure study. J. Biol. Chem. 255, 3629–3637. Travers, A., and Drew, H. (1997). DNA recognition and nucleosome organization. Biopolymers 44, 423–433.
UNCORRECTED FIRST PROOFS
Nucleosome Mapping | 347
Trifonov, E.N. (1980). Sequence-dependent deformational anisotropy of chromatin DNA. Nucleic Acids Res. 8, 4041–4053. Wang, Y.H., and Griffith, J.D. (1996). The [(G/C)3NN] n motif: a common DNA repeat that excludes nucleosomes. Proc. Natl. Acad. Sci. USA 93, 8863– 8867. Weiner, A., Hughes, A., Yassour, M., Rando, O.J. and Friedman, N. (2010). High-resolution nucleosome mapping reveals transcription-dependent promoter packaging. Genome Res. 20, 90–100.
Weintraub, H., Palter, K., and Van Lente, F. (1975). Histones H2a, H2b, H3, and H4 form a tetrameric complex in solutions of high salt. Cell 6, 85–110. Wirbelauer, C., Bell, O., and Schubeler, D., (2003) Variant histone H3.3 is deposited at sites of nucleosomal displacement throughout transcribed genes while active histone modifications show a promoterproximal bias. Genes Dev. 19, 1761–6. Yuan, G.C., Liu, Y.J., Dion, M.F., Slack, M.D., Wu, L.F., Altschuler, S.J., and Rando, O.J. (2005). Genome-scale identification of nucleosome positions in S. cerevisiae. Science 309, 626–630.
UNCORRECTED FIRST PROOFS