and blast assessment (11). The U.S. Bureau ..... is not significantly different from the one in figure 3D. ..... plementary information includes borehole logs of sonic.
RI 9497
REPORT OF INVESTIGATIONS/1994
PLEASE 00 Nor REMOVE FRCM LIBRARY
UBRARY SPOKANE RESEARCH CENTER RECEIVED
MAY 171994 us BURE.~U OF v'1',ES E. 315MONTOOW.ERY AVE.. SPOKANE. WA 99207
MIGRATOM-Geophysical Tomography Using Wavefront Migration and Fuzzy Constraints By M. J. Jackson and D. R. Tweeton
UNITED STATES DEPARTMENT OF THE INTERIOR
,.
... f
U.S. Department of the Interior Mission Statement As the Nation's principal conservation agency, the Department of the Interior has responsibility for most of our nationally-owned public lands and natural resources. This includes fostering sound use of our land and water resources; protecting our fish, wildlife, and biological diversity; preserving the environmental and cultural values of our national parks and historical places; and providing for the enjoyment of life through outdoor recreation. The Department assesses our energy and mineral resources and works to ensure that their development is in the best interests of all our people by encouraging stewardship and citizen participation in their care. The Department also has a major responsibility for American Indian reservation communities and for people who live in island territories under U.S. administration.
1 r I
r
f
r ~
Report of Investigations 9497
MIGRATOM-Geophysical Tomography Using Wavefront Migration and Fuzzy Constraints By M. J. Jackson and D. R. Tweeton
UNITED STATES DEPARTMENT OF THE INTERIOR Bruce Babbitt, Secretary BUREAU OF MINES
t, !
,I
.1
,!
International Standard Serial Number ISSN 1066-5552
CONTENTS Page
Abstract ............•.....................................................•..••.•.. Theoretical background .............................................•..........•...... Introduction: defmitions and concepts ..................................•...•......•.... Travel-time inversion ............................................••...••.......•.• Amplitude inversion .............................................•.•.............. Experimental configuration and resolution . . . . . . . . . . . . . . . . . . . . . . . . . . . . . . . • . . . . . . . . . . . . . . . • Instrumentation and physical resolution . . . . . . . . . . . . . . . . . . . . . . . . . . . . . . . . . . . • . . . . . . . . . • . . Experimental geometry and mathematical resolution .....................•............•..• Ray tracing and wavefront propagation ................................................. . The nonuniqueness problem, constraints, and fuzzy logic .....................•..............• Fuzzy constraints .............................................................. .. Synthetic data experiments ........................................................ . Summary ....................................................................... . MIGRATOM user's manual ........................................................... . System requirements .....................................................•......... Installing MIGRATOM ............................................................ . Graphics drivers . . . . . . . . . . . . . . . . . . . . . . . . . . . . . . . . . . . . . . . . . . . . . . . . . . . . . . . . . . . . . . . . . Extended memory ....................................................•.......... Starting MIGRATOM ............................................................. . Menu structure ................................................................•.. Data files ....................................................................... . Grid geometry ..............................................................•..... Grid editor ..................................................................... . Constraints .........................................................,............ Global constraints ..............................................•.......•.......•. Node constraints ........................................•.................•..... Inversion: straight-ray and curved-ray processing .......................•.•................ Output files ..................................................................... . Options ........................................................................ , Recommended general strategy ......................................................... . Special topics ...................................................................... . Running under Microsoft Windows operating system ................................. ; ..... . "Runaway" caustics and reentry after clipping ...........................................•.. Forward modeling ................................................................ . Benchmarks .................................................................•...•.. Conclusions ...................................................................•.... References ......................................................•..........•....... Appendix A.-List of files on MIGRATOM distribution diskette ................................ . Appendix B.-Summary of utility programs supplied on MIGRATOM distribution diskette ..........•... Appendix C.-Details of wavefront calculations ............................................. . Appendix D.-Format of output files generated by MIGRATOM ................................ .
1 2 2 2 4
5 5 5 8 10 12 12 14 14 14 14 14 15 15 15 16 17 17 18 18 18 19 19 20 22 23 23 24 25 25 27 27 29 30 31 34 I;
!
ILLUSTRATIONS 1. 2. 3. 4. 5.
Schematic illustration of anomaly projections ......................................... Ray-path coverage associated with different experimental geometries ........................ Resolution test with synthetic data ................................................. Resolution test with synthetic data for model with vertical high-velocity zone .................. The "shadow-zone" problem ......................................................
1
!:
. . . . .
2 6 7
8
' ; "
"
1
'
I
;) , ,I
9
,!
!
"
-"
ii ILLUSTRATIONS
I ii f'!
Page 6. 7. 8.
9. 10. 11. 12. 13. 14. 15. 16. 17. 18. C-l. C-2. C-3. C-4.
Schematic illustration of Huygens' Principle ........................................... Results of calculations based on Huygens' Principle for heterogeneous velocity model ............ Resolution test with synthetic data .......... . . . . . . . . . . . . . . . . . . . . . . . . . . . . . . . . . . . . . . . . Effects of hard and soft layering constraints with synthetic data . . . . . . . . . . . . . . . . . . . . . .. . . . . . . MIGRATOM main menu screen. .... . . . . . . . . . . . . . . . . .. . . . ... .. . . . . .... . .. . . . . ... . . Travel-time me illustrating required format ........................................... Velocity model file illustrating required format. . . . . . . . . . . . . . . . . . . . . . . . . . . . . . . . . . . . . . . . . Node constraint matrix .......................................................... Summary of data and program mes involved in producing tomogram . . . . . . . . . . . . . . . . . . . . . . . . . Intrapixel velocity distributions . . . . . . . . . . . . . . . . . . . . . . . . . . . . . . . . . . . . . . . . . . . . . . . . . . . . . MIGRATOM screen graphics captured by Microsoft Windows operating system ................ Schematic illustration of caustic generated by strong velocity contrast ........................ Execution time for 10 iterations, using 486/33 processor . . . . . . . . . . . . . . . . . . . . . . . . . . . . . . . . . . Initial takeoff angles ............................................................ Forward time step, two adjacent points. . . . . . . . . . . . . . . . . . . . . . . . . . . . . . . . . . . . . . . . . . . . . . . Forward time step, three neighboring points . . . . . . . . . . . . . . . . . . . . . . . . . . . . . . . . . . . . . . . . . . . Box constructed for arrival test ....................................................
I,
IIIi,
iI' I' I"
9 11 13 13 15 16 17 18 20 21 24 25 26 31 31 32 32
TABLES 1. 2.
Resolution and range characteristics of various energy sources for geophysical tomography ........ Performance comparison.: MIGRATOM, BOMCRATR, and BOMTOM .....................
5 26
I::
i
I: 'I I:
UNIT OF MEASURE ABBREVIATIONS USED IN THIS REPORT 11
ft
foot
Mbyte
megabyte
kbyte
kilobyte
MHz
megahertz
kHz
kilohertz
m/ms
meter per millisecond
km/s
kilometer per second
m/s
meter per second
m
meter
s
second
:1
I
DISCLAIMER OF LIABILITY The U.S. Bureau of Mines expressly declares that there are no warranties expressed or implied that apply to the software described herein. By acceptance and use of said software, which is conveyed to the user without consideration by the U.S. Bureau of Mines, the user hereof expressly waives any and all claims for damage and/or suits for or by reason of personal injuryj or property damage, including special, consequential or other similar damages arising out of or in any way connected with the use of the software described herein.
MIGRATOM-GEOPHYSICAL TOMOGRAPHY USING WAVEFRONT MIGRATION AND FUZZY CONSTRAINTS
By M. J. Jackson 1 and D. R. Tweeton 2
ABSTRACT MIGRATOM is a third-generation PC-based computer program developed by the U.S. Bureau of Mines for geophysical tomography. Like its predecessors, BOMTOM and BOMCRATR, MIGRATOM was developed to enable users to address a variety of mining-related problems by mathematically reconstructing the distribution of physical properties in a rock mass, using measurements of travel time or amplitude of wave energy propagated through the rock mass. Examples of applications include lithologic characterization, fracture detection, fluid monitoring, stress evaluation, and blast assessment. The resolution and accuracy of tomographic reconstructions generally depend very strongly on the geometry of source and receiver locations. In many practical applications, such as cross-borehole tomography, limited coverage results in nonunique reconstructions. MIGRATOM follows the precedent of BOMTOM and BOMCRATR in allowing the user to constrain the inversion, in order to reduce the nonuniqueness problem. A new approach to application of constraints implemented in MIGRATOM is based on fuzzy logic techniques. Refraction of wave energy is modeled in MIGRATOM using an approach based on Huygens' Principle. Propagation of a continuous wavefront is modeled as a constructive interference phenomenon, which obviates the shadow-zone problem that affects conventional ray-tracing calculations. MIGRATOM has been tested with both synthetic and field data sets.
1Geophysicist.
2Research physicist. Twin Cities Research Center, U.S. Bureau of Mines, Minneapolis, MN.
I!!
,
2
THEORETICAL BACKGROUND INTRODUCTION: DEFINITIONS AND CONCEPTS
i
!
i
, i ;
::
I I
Ii I; !,J
,I I
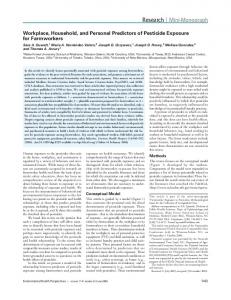
"Tomography" comes from the Greek "tomos," meaning slice. It involves reconstructing a cross section or slice through an object using measurements, made outside the object's perimeter, of energy that has passed through it. The mathematical basis for tomography was established in 1917 by Radon (1),3 who showed that an object can be exactly reconstructed from a complete set of its projections. The method began to find practical applications with the development of digital computers, first in astronomy, then with tremendous success in medicine, and more recently in geophysics. Useful summaries have been presented by various authors (2-6). In mining, seismic and electromagnetic tomography are used to construct images or maps of the physical properties of a rock mass; these images provide information that helps to address a variety of mining-related problems (1), including lithologic characterization, fracture detection (8), fluid monitoring (9), qualitative stress evaluation (10), and blast assessment (11). The U.S. Bureau of Mines (USBM) is continuing to develop tomographic imaging technology for these purposes. Tomographic analysis can be carried out using wave energy transmitted through the object of study (transmission tomography) or using wave energy that has been scattered by heterogeneities within the object (diffraction tomography). Diffraction tomography is generally superior at resolving isolated anomalies embedded in a uniform background (12-13). However, data collection for diffraction tomography is quite complex, requiring the recognition of the scattered wave energy within the total wave field. Transmission tomography, in contrast, can be carried out using simply the first arriving wave energy at all receivers. Consequently, only transmission tomography will be considered here. The fundamental concept in transmission tomography is that of the projection. Energy is radiated through the object being studied; it interacts with the material, and is received and measured after passing through it. Spatial variations in the physical properties of the interior result in corresponding variations in the characteristics of the energy received; in other words, the measurements constitute a projection of the internal structure (fig. 1). Tomography produces an image of the internal structure by combining information from a set of projections obtained at different viewing angles. Different types of energy are sensitive to, and therefore provide information on, distinct physical properties of the 3ltalic numbers in parentheses refer to items in the list of references preceding the appendixes at the end of this report.
material. Electromagnetic wave energy is strongly affected by electrical conductivity and permittivity and by magnetic permeability, and is therefore used to image those properties. Seismic waves provide information on elastic properties. Measured characteristics of the received wave energy include amplitude and travel time. The amplitude measured at a particular point is determined by the distance traveled and by attenuation along the transit path; the spatial variation of attenuation (or of its inverse, the attenuation distance) can therefore be tomographically reconstructed from amplitude projections. Travel time depends on path length and on velocity along the path. Travel-time data thus enable tomographic imaging of the velocity distribution within the sampled area. The following section describes inversion of traveltime data to obtain the velocity distribution; a subsequent section will describe how to modify the analysis for amplitude data and attenuation. Travel-Time Inversion
Each point in the projections shown in figure 1 corresponds to a particular ray path, from a fixed source
POSITION SIGNAL
z
o I00
o
a..
c Figure 1.-Schematlc Illustration of anomaly projections. Physical anomaly (A) projects as data anomalies (8 and q; tomography Involves reconstruction of physical anomalies from their projections.
f
3
position S to one of an array of receiver positions. At each receiver location R the measured travel time reflects the average velocity along the path joining Sand R. Stated mathematically, each travel time t represents a line integral of the wave slowness p (inverse of velocity v) along the corresponding ray path from S to R:
R
t=
R
J.! · J dl =
s v
p. dl,
(1)
s
where dl is the path length increment. There are two broad categories of methods for reconstructing the slowness distribution p(x,z) from a set of its line integrals. The first includes Fourier transformation and convolution. These methods are fast, elegant, and precise, and are widely used in medical imaging. Unfortunately, they have stringent requirements for source and receiver geometry (2, 5) that can rarely be met for geophysical studies, so they will not be considered here in any detail. Methods in the second category are referred to as "series expansion techniques," and they begin by approximating the continuous function p(x,z) as a set of discrete elements or pixels (or voxels for three-dimensional elements), each with a uniform slowness Pj (j = I,M where M is the number of pixels). Then the integral corresponding to travel time ti (i = 1,N where N is the number of observations) becomes a summation:
The essence of tomography is solving for the slowness vector P (i.e., the velocity field), given the set of measured travel times T, by inverting the matrix of path lengths D:
(4) However, under certain common circumstances the matrix D is singular, i.e., it cannot be inverted. This occurs when the measured data are insufficient in number or in range (as discussed in the following section on nonuniqueness), or with overdetermined but inconsistent (noisy) data. An approximate solution known as back-projection uses a rownormalized transpose rather than the inverse of D:
(5) where the matrix D' is obtained by dividing each row of D, corresponding to a particular ray path, by the square of the path length. Thus
(j
=
l..M).
(6)
Better than back-projection is a least squares solution that satisfies the inconsistent data as closely as possible:
(7)
(2)
This approach may also fail, when the matrix (D'I'D) is singular or nearly singular (14). This has led to the application of damped least squares methods:
where d ij is the distance traveled by ray i in pixel j. For the entire set of rays, the travel-time equation above can be expressed in matrix form as
(8)
M
tj =
E Pj dij
(i = l..N) ,
j=l
T = DP,
(3)
where T and P are column vectors of length Nand M respectively, and D is an N by M rectangular matrix. Note that although P is mathematically one dimensional, it refers to a two- or three-dimensional physical model. Tomographic imaging thus involves solving for P, the slowness vector, given the travel-time matrix T. This of course requires that the matrix of path lengths D be calculated. If the ray paths are approximated as straight lines, D follows from simple geometry. When velocity varies as a function of position, however, ray paths are refracted, and if velocity contrasts are sufficiently large, D must be calculated by detailed ray tracing, as discussed in a later section.
where A is called the damping parameter and I is the identity matrix. Strong damping produces smooth tomographic reconstructions, similar to back-projection (compare equations 8 and 5). An additional method that is very powerful for handling singular or near-singular (illconditioned) matrices is known as singular-value decomposition or SVD (15-11). SVD allows resolution to be evaluated quantitatively (11). The principal drawback of the matrix inversion methods described above is their high computational cost. Since inversion of an N by M matrix involves on the order of M3 numerical operations, even a moderate sized matrix requires a substantial amount of processing time to invert (15). An efficient alternative is the family of iterative or algebraic reconstruction techniques, or ART (18-21).
,i
!!
,
,. ; ,
4 ,, .. ,,
:
~
In iterative reconstruction, a starting velocity model is progressively modified until it converges to a solution. This involves the following steps. First, an initial model is specified and is used to calculate a corresponding set of model travel times: T' ;:: DP' ,
I.i
(9)
where the prime notation refers to the initial model. The model travel times are subtracted from the measured times to obtain the residuals: dT
= T - T'.
(10)
The key step is then to back-project the residuals and obtain a set of model perturbations or correction factors: dP'
= DOT dT.
II
I,
I
) ,
,!
: !~ i
= P' + dP' ,
(13)
(11)
The model is then updated with the calculated correction factors,
P"
either velocity distribution or attenuation structure, but not both simultaneously, and hence is limited to straight-ray inversion of amplitude data. Experience has shown that, as with travel-time inversions, the use of this approximation for field data is satisfactory in some cases and not in others. An important improvement in future USBM tomographic software will be the capability to handle velocity and attenuation simultaneously. With MIGRATOM, it is important to use straight-ray processing for amplitude inversions. The following description of attenuation refers to "radio waves," but the comments generally apply to seismic waves as well. For a radio wave with initial amplitude Ao, spreading spherically in a homogeneous material, the amplitude at a distance r from the source is
(12)
and the process is repeated until it converges to a solution. The USBM has developed three generations of tomographic software based on the iterative reconstruction approach. The first-generation program, BOMTOM (22), operates under the straight-ray assumption. BOMCRATR (BOM Curved-Ray Tomographic Reconstruction, 23) and MIGRATOM trace refracted ray paths through the velocity model at each iteration; this will be described in more detail later.
Here OT is the angle with respect to the transmitting antenna axis and a is the coefficient of attenuation. The rl dependence is a consequence of energy conservation (E ex r- 2) with amplitude proportional to JE. Note that for inseam guided waves a cylindrical (r-1/2) dependence should be substituted for the spherical spreading (24-25). Taking natural logs and rearranging gives -In(A/AO) +In(sil1(OT)) -In(r) =ar.
For an inhomogeneous material where a varies as a function of position, the quantity on the left is equal to the line integral of attenuation along the ray path from source to receiver: R
Amplitude Inversion
. i
MIGRATOM (as well as BOMTOM and BOMCRATR) can be used for calculating the distribution of attenuation properties from a set of amplitude data. This requires a preliminary step of data reduction prior to input to the tomographic software. Both seismic and electromagnetic data must be corrected for the following: (1) geometrical spreading of the waves, (2) radiation pattern of the source, and (3) angular sensitivity of the receiver. An important limitation of MIG RAT OM for amplitude inversion is that it is restricted to straight-ray analysis. In a rock mass with large contrasts in electromagnetic or elastic properties, measured amplitudes can be strongly affected by focusing or defocusing of the energy by refraction, so this limitation may be quite serious. Curvedray amplitude inversions require an estimate of the velocity structure so that these effects can be accounted for, before the intrinsic attenuation due to an elasticity or electrical conductivity is calculated. MIGRATOM keeps track of
(14)
-In(A/Ao) + In(sin( 0T» -In(r) = J a (r) dr. (15)
s This is now equivalent in form to equation 1. However, two further adjustments are required before the data can be inverted. First, the receiving antenna has a sensitivity with the same angular dependence as that of the radiation from the transmitting antenna. Second, amplitude data are generally expressed in decibel units, equal to 2010g(A/A R), where AR is some reference amplitude. The . left-hand side is therefore rewritten as -0.115[2010g(A/AR> + 2010g(A R /Ao) -2010g(sin(OT»
- 20 log (sin (OR)) + 20Iog(r)] = Ja(r)dr.
(16)
5 The first term in the square brackets on the left-hand side of equation 16 thus represents the measured data. The other terms are correction factors, respectively: ratio of reference and source amplitudes, angular dependence of radiation, angular dependence of receiver sensitivity (e R is the angle between the ray path and the receiving dipole axis), and spherical spreading. The term 0.115 comes from conversion of natural to decimal logarithms (1/ (20l0g(e»). For each ray path, the left-hand side of equation 16 should be calculated and used as input to MIGRATOM. This can easily be done using most commercial spreadsheet software. EXPERIMENTAL CONFIGURATION AND RESOLUTION Instrumentation and Physical Resolution
The spatial resolution possible in tomography is related to the wavelength of the energy utilized: In general, the shorter the wavelength, the smaller the feature that can be resolved. Short-wavelength energy, however, is more strongly attenuated than long waves. Thus, there is a tradeoff between physical resolution and range of investigation: Longer wavelengths have less resolving power but greater range. The variety of available seismic and electromagnetic instrumentation enables researchers to get the best possible physical resolution over the necessary range of investigation. Table 1 (26) lists sollie of the seismic and electromagnetic energy sources that have been used in USBM research, along with their frequencies and approximate corresponding wavelengths and ranges. A rule of thumb widely used in reflection studies is that the smallest feature resolvable is roughly 1/4 of a wavelength (27). For transmission tomography, the frequency dependence of resolution enters through the "width" of the ray paths, i.e., the radius of the first Fresnel zone, which is proportional to wavelength (28-29). The operating ranges of the sources listed in table 1 depend on the energy used, and also depend strongly on the attenuation properties of the rock mass, but are typically on the order of 10 to 100 wavelengths. Another physical limitation on resolution is caused by ray bending associated with strong velocity contrasts. Zhou (30) has shown with synthetic models that reconstruction accuracy reaches a maximum for velocity contrasts of about 20%; resolution decreases for smaller contrasts because the travel-time residuals become insignificant; for larger velocity contrasts refraction degrades the ray-path coverage (coverage is discussed below) and thus reduces resolvability. It is somewhat ironic that stronger anomalies can actually be harder to resolve than more modest ones. .
Table 1.-Resolution and range characteristics of various energy sources for geophysical tomography Energy and source Seismic: Piezoceramic ...... Electric Shells Sparker .......... Air gun Electromagnetic: Radio transmitter ...
.....
..........
Frequency, kHz
Wavelength ,1 m
Range, m
20 3-5 1-2
0.2 "'1 2- 4 16
2-20 .:1100 40- 300+ 300+
.25 30,000
3
10-100
1Assuming v '" 4 km/s for seismic waves and v '" 108 m/s for electromagnetic waves.
The use of first-arrival travel times as input also causes a bias in the kinds of features that can be resolved with curved-ray tomography. Wielandt (31) has shown that high-velocity anomalies can be readily detected and characterized tomographically, whereas slow anomalies tend to be significantly underestimated. Nolet (29) has termed this the "Wielandt effect." This point was also discussed by Ivansson (32). Because the first-arrival ray paths tend to avoid low-velocity regions, the corresponding travel times contain essentially no information about the structure within these slow areas. This problem can be severe in applications such as tunnel detection or mining void delineation (33). Experimental Geometry and Mathematical Resolution
Radon (1) showed that, given a complete set of projections, an object can be reconstructed exactly. In practice, it is not possible to obtain a complete set of continuous projections: Limited data are collected at a finite number of locations. Here, several common data-gathering configurations are briefly described, and synthetic models are used to show how tomographic reconstructions are affected by limitations in the data. The best practical arrangement completely surrounds the area of investigation with sources and receivers, so that the entire area is crisscrossed by rays traveling in different directions. Such an arrangement is possible, for example, when the object of study is a mine pillar (34-36): Geophones can be placed around the entire perimeter, recording arrivals as sources are activated at successive locations around the edge. Fairly complete coverage is also possible for imaging a horizontal bedrock surface overlain by a slow surficial layer, using "refraction tomography" (11): Down-going energy generates head waves that travel along the bedrock surface and then return at a steep angle to the surface. In-seam electromagnetic or
6
i !. ~ ,I'
I: ! I"
, ,
(
i 111,1
":1
';
;1
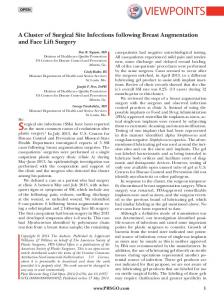
anomaly reasonably well, but its size, shape, and magnitude are very poorly resolved. This lack of resolution is due to the limited range of viewing angles rather than the reduced ray density; a reconstruction using a cross hole geometry with ray-path density increased by a factor of 9 is not significantly different from the one in figure 3D. The same numerical experiment with a different target model illustrates an important point. Figure 4A shows a model with a vertical high-velocity zone. Again, a synthetic travel-time data set for this model is calculated using the three configurations shown in figure 2, and these synthetic data sets are used to reconstruct the target. The results are shown in figure 4. The optimal instrumental array again produces a very good reconstruction of the location, size, shape, and magnitude of the anomaly (fig. 4B). The simulated boreholesurface data set yields a strongly degraded image (fig. 4C), particularly in the lower part of the tomogram, where raypath density is low and angular range of the ray paths is strongly limited (fig. 2B). In the cross hole reconstruction (fig. 4D), there is no indication whatsoever of the target anomaly. This illustrates the vertical structure problem in cross hole tomography: A continuous vertical anomaly cannot be resolved at all using cross hole travel times. The inaccuracy of the reconstructions here does not follow from any inaccuracy in the synthetic travel-time data, which ,are essentially exact. Rather, it stems from insufficiency of the data: The limited travel-time data sets simply do not contain enough information to produce a mathematically unique reconstruction (22, 37-38). Even
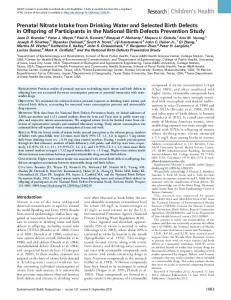
seismic waves can also be used to study longwall coal panels or similar mine structures (24-25). A more common arrangement in exploration uses one or more boreholes and the ground surface for source and receiver positions. Cross-borehole geometries are commonly used, to avoid the strong attenuation of a weathered surface layer. Figure 2 illustrates the ray-path coverage associated with these instrumental configurations. It is obvious that with a constant station spacing the number of ray paths and the sampling density differ enormously for the various configurations. It is also clear that with incomplete coverage, the range of ray-path angles sampling parts of the area becomes quite limited. The resolving power of these different experimental configurations can be evaluated by numerical simulation. Figure 3A shows a simple target model for which a set of synthetic travel times can be calculated. When the synthetic data are used as input for a tomographic reconstruction, the calculated velocity distribution should closely resemble the target model. Figure 3 shows images obtained for the three instrumental configurations. With complete coverage the reconstruction is quite accurate in terms of the position, size, and shape of the anomaly, as well as its magnitude (fig. 3B). The simulated survey using borehole and surface coverage (fig. 3C) produces a somewhat degraded image: The anomaly appears in the proper location, but its size and shape are distorted and its magnitude is diminished. The cross hole survey, with instrumental coverage of only two sides of the square, still succeeds in locating the
,I
A
8
c
Figure 2.-Ray-path coverage associated with different experimental geometries. A, Complete coverage; B. surface and borehole coverage; C, borehole coverage.
*
7 though the N equations outnumber the M unknowns, the solution is underdetermined because the N equations are not all linearly independent. A complete travel-time set (as in figure 24) can be mapped uniquely into a particular velocity mode~ because the number of independent equations exceeds the number of unknowns. However, a given set of cross hole travel times can be mapped into many different velocity models. This is known as the nonuniqueness problem, which affects any reconstruction based on incomplete ray-path coverage. Here the
simultaneous iterative reconstruction technique (SIRT) algorithm converged to a velocity model that differs from the target model, but one that produces essentially identical cross hole travel times. Cross hole travel-time data thus cannot distinguish between the models of figures 4A and 4D. In order to improve the resolution of cross hole reconstructions, it is essential to supplement the travel-time data with additional information; this will be discussed further in the section "The Nonuniqueness Problem, Constraints, and Fuzzy Logic."
B
A KEY V,
m/ms
5.9 5.7 5.5 5.3 5.1 4.9
c
D
I
I
Figure 3.-Resolutlon test with synthetic data. A, Target velocity model; B, reconstruction using complete raypath coverage, as In figure 2; C, reconstruction using borehole and surface Instruments; D, reconstruction using cross hole data only.
iI
8
B
A
KEY V,
m/ms
5.9 5.7 5.5 5.3 5.1
4.9
I,
I:
i:
c
Figure 4.-Resolutlon test with synthetic data for model with vertical high-velocity zone. A, Target velocity model; B, reconstruction using complete ray-path coverage, as In figure 2j C, reconstruction using borehole and surface Instrumentsj D, reconstruction using cross hole data only.
RAY TRACING AND WAVEFRONT PROPAGATION i'111
, 'ii'
Experience indicates that when velocity contrasts are more than about 50%, the straight-ray approximation described above becomes quite inaccurate and it becomes necessary to trace ray paths through the velocity model after each iteration. For velocity contrasts of 10% or less, the straight-ray approximation is almost always acceptable. When velocity ratios are between 10% and 50%, straightray processing may be acceptable, depending upon the requirements of the user (23).
I'
lill
D
A number of methods are available for travel-time calculation and ray tracing though a heterogeneous medium (39-45). A common and efficient approach is to divide the imaging plane into triangular pixels, within each of which the velocity varies linearly with position, i.e., the velocity gradient is constant within each pixel. Under these conditions, the ray-path segment in an individual pixel can be calculated analytically by application of Snell's law (4, 23, 40).
9
".
Calculation of the particular ray path joining specific source and receiver locations is a two-point boundary value problem. The most widely used methods are ray shooting and ray bending (40-41, 45; see also 15). Shooting methods fmd the path to a particular receiver by tracing rays with different takeoff angles from the source, and interpolating until one passes sufficiently close to the receiver. Bending methods begin with a trial path joining source and receiver; the path is then iteratively perturbed until its travel time is minimized. The USBM's secondgeneration tomographic program, BOMCRATR, performs curved-ray calculations using the shooting method (23). Each of these approaches has disadvantages. Shooting methods may fail for complicated velocity distributions, where ray trajectories can be an extremely sensitive and irregular function of takeoff angle. An example is the inability of shot rays to reach certain receivers in highvelocity areas, because of refraction of the rays away from the receiver (the "shadow-zone" problem; figure 5). The documentation for BOMCRATR (23) reports failure rates as high as 20% for a typical field data set. An additional drawback of both bending and shooting approaches is that they may find secondary arrivals rather than the shortest time path (although BOMCRATR takes additional steps to identify the first arrival when more than one is possible). For these reasons, the third-generation USBM tomographic program, MIGRATOM, uses an alternative approach: modeling migration of a continuous wavefront using Huygens' Principle. Originally formulated in optics, Huygens' Principle enables modeling of the propagation of a wavefront through a heterogeneous velocity medium by treating each point on the wavefront as an instantaneous point source of wave energy. The position of the wavefront an infinitesimal time later is the locus of constructive interference of these Huygens' wavelets. MIGRATOM uses a numerical two-dimensional wavefront propagator based on Huygens' Principle. An initially
infmitesimal circular wavefront at the seismic source is advanced in a series of time steps, by construction of circular wavelets about a number of points on the wavefront, each with a radius proportional to the local velocity. The locus of constructive interference is approximated by lines tangent to adjacent Huygens wavelets. Each point on the current wavefront is advanced for the next time step to a position on its wavelet midway between tangent points (see figure 6). The trajectory of an individual tracking point on the wavefront represents a ray path. As the wavefront expands, new tracking points are added by interpolation; in the interest of computational efficiency, wavefront points are deleted when they have traveled a certain distance outside the region of interest. In numerical tests using simple velocity functions for which travel times and ray paths could be calculated analytically (e.g., v = Vo + VlZ, where Vo and Vl are constants), the Huygens algorithm was found to be accurate to within 0.01%. The network approach developed by Saito (43) and by Moser (42), and a closely related dynamic programming approach (44) have practical similarities to the USBM approach, most notably that they ensure that ray paths can be found for each source-receiver pair, and that these ray paths are those of the first arrivals. The shortcomings of ray-shooting and ray-bending methods are thus obviated. The approaches are similar in concept inasmuch as the network grid points can be considered analogous to points
Source (,ii:\
Source
~
~
Calculated ray paths
t. t t Figure 5. The "shadow-zone" problem. Rays are refracted away from high-velocity layer; ray exit points are an extremely sensitive function of takeoff angle, causing problems for rayshooting methods. After Tweeton, Jackson, and Roessler, 1992
(23).
Figure 6.-Schematlc illustration of Huygens' Principle.
,
10
!,
!
'
,Ii,
on an expanding wavefront, acting as secondary point sources (43). The major conceptual difference between the network approach and the U:SBM's more literal implementation of the Huygens method lies in the nature of the constructed ray paths. The network approach is restricted to ray paths joining a sequence of fIxed network grid points; in contrast, the potential paths are not predetermined by the Huygens method: In practice, the difference between the two methods will depend upon factors such as the density and interconnection of network grid points, the size of the time steps used for wavefront propagation,and Ule density of tracking points on the wavefront; by appropriate choice of these parameters a high degree of accuracy may be attained. Another closely related recent approach to solving the forward problem involves finite-difference solution of the eikonal equation (15, 46-47). As pointed out by Qin, Luo, Olsen, Cai, and Schuster (47), the finite-difference approach is most appropriately implemented along an expanding wavefront, which enables penetration of shadow zones and treatment of head waves. Figure 7A shows an example of calculated .wavefront migration through a heterog~neous velocity model, for a source position in the upper left corner. Note how the spacing between successive wavefront positions varies according to velocity. Also note that the wavefront reaches all of the receivers in the right borehole, so that travel times and ray paths are calculated for every sourcereceiver pair, and all measured data can thus be used in the inversion. The ray-shooting algorithm used by the USBM was unable to join 19 of the 120 source-receiver pairs. Figure 7B shows the calculated ray paths for transmitted first arrivals, superimposed on the same tomogram, for all source-receiver pairs. Naturally these first-arrival rays sample the higher velocity regions most intensively. They bend sharply where gradients are large; it is this sharp bending that causes the ray-shooting approach to fail, particularly when receivers are located in high-velocity areas. THE NONUNIQUENESS PROBLEM, CONSTRAINTS, AND FUZZY LOGIC
Cross-borehole seismic surveys have important advantages over surface seismics: The cross hole energy avoids the filtering and attenuation effects associated with a, weathered surface layer; sources and receivers may be placed closer to the region of interest; and shorter travel paths allow.reception of higher frequencies, providing higher resolution (48). However, these advantages are partially offset by some serious disadvantages.
:i!
,
!'
ii, ',,'!
'.
The most critical problem in cross hole tomographic imaging is the mathematical nonuniqueness of the solutions obtained (22, 37-38). The limited range of viewing angles in a cross hole survey results in singular matrices in the inversion, because the N travel-time equations are not all linearly independent. The system is thus underdetermined even when N (the number of observations) is much greater than M (the number of unknowns), and many solutions can be found that fit the data equally well. For example, as shown above, cross hole travel times for a uniform velocity plane are indistinguishable from times for a plane with vertical strips of contrasting velocity, as long as the average horizontal slowness is the same in both cases. This nonUluqueness is inherent in the cross hole geometry and affects both direct inversion and iterative methods. However, in many practical applications incomplete angular coverage, and the attendant nonuniqueness problem, are unavoidable. There are alternative strategies for reducing nonuniqueness. Limits may be imposed on the statistical properties of the solution (49); for example, a condition of minimum solution variance may be imposed (50), resulting in the smoothest possible reconstruction compatible with the data. The approach followed by the USBM is to supplement the incomplete travel-time data set with additional site information. This additional information can be incorporated into the inversion to a certain extent through the use of an appropriate starting model, and more explicitly in the form· of constraints limiting the range of permissible solutions. Commonly available supplementary information includes borehole logs of sonic velocities and lithology, surface refraction or reflection data, and local or regional structural and stratigraphic information. In many cases such information permits definition of the types of solutions that would be considered geologically "reasonable," among the multitude of mathematically permissible solutions. Iterative reconstruction methods begin by specifying a "reasonable" initial model, and in general they remain close to the starting model, except where modifications are required to fit the data. In addition, however, certain explicit constraints can be incorporated that are not possible with direct matrix inversion methods. For example, the solution can be forced to match known boundary values (e.g., known borehole velocities); the solution range may be bounded (Le., maximum and/or minimum allowable velocities may be specified); and the solution may be damped selectively (e.g., layer uniformity may be maintained by averaging over groups of pixels). Iterative methods thus allow greater range and flexibility in the nature of constraints that may be applied.
11
A -3.5
KEY
E ,.~'
I
l-
-4.0
m/ms -4.5
e..
:1'
,
6.5 6.0 5.5 5.0
W
0
-5.0
4.5
-5.5
4.0 3.5 3.0
-6.0
2.5
DISTANCE, m
B
E I
l-
-4.0
-4.5
e.. W
o
-5.0
-5.5
-6.0
DISTANCE, m Figure 7.-Results of calculations based on Huygens' Principle for heterogeneous velocity model (dark. er shading represents higher velocities). A, Wavefront migration from single source position; B, first· arrival ray paths joining 10 source positions (left) and 10 receiver pOSitions (right).
--r'('7'
: :
12 Fuzzy Constraints
I·
.1
..
i' I· I'
I'
: .11
Because of incomplete angular coverage, incorporation of a priori information IS critical for obtaining reliable tomograms from cross well travel-time data. However, this information is itself always subject to some degree of uncertainty. For borehole velocities obtained from sonic logs, this uncertainty is relatively small, and a reconstructed velocity model should generally be constrained to match borehole velocities very closely.4 For other types of information, however, the uncertainty may be much larger, and it is less desirable to force the solution to match it precisely. For example, in a sequence of sedimentary strata, it is "known" that there should be a generally layered velocity field with possible localized anomalies. In iterative reconstruction, stratification of velocities may be enforced by averaging over horizontal layers at each iteration. Such enforcement, however, precludes the development of local anomalies in the reconstructed velocity field. In such a situation, it is useful to replace the "hard" constraint that forces a particular outcome in the reconstruction with a "soft" constraint that causes the reconstruction to tend in a certain direction without completely determining the results. The methods of fuzzy logic are well suited to such an approach. Fuzzy logic is a branch of artificial intelligence designed for making decisions based on uncertain information (5152). An important concept in fuzzy logic is the continuous Boolean function. With "crisp" logic, a statement is either true or false, and the Boolean function returns a value equal to either 0 (false) or 1 (true). With fuzzy logic the Boolean is a continuous function that may return a value anywhere in the interval from 0 to 1, inclusive. Fuzzy logic has been applied to a wide variety of problems, including medical diagnosis and mineral exploration (52). USBM researchers have followed a simplified approach to applying fuzzy logic to constrain velocities. A constraint parameter is assigned for each node in the velocity grid: a real number whose integer part represents the type of constraint applied, and whose fractional part represents the uncertainty or fuzziness in the constraint. At each iteration, both unconstrained and fully constrained velocities (vo and v1, respectively) are computed for each node. "Fully constrained" here means the velocity value obtained after application of a hard constraint (e.g., velocity fixed at 4Por anisotropic rocks, however, the (vertical) velocities obtained from sonic logs may differ somewhat from the (horizontal) velocities associated with cross hole ray paths.
j: ;1. ill,
i
I
'
its initial value, or velocity obtained by averaging over a group of nodes). The velocity carried into the next iteration is a linear combination of the unconstrained and fully constrained values:
(17) where f is the uncertainty or fuzz factor. When f = 0, the constraint is applied "full strength;" when f approaches unity, the inversion becomes essentially unconstrained. This approach differs from that of Lo (53-54), who formulates the entire tomographic inversion problem in terms of fuzzy logic. Here a standard SIRT algorithm is used for handling the travel-time data, and fuzzy logic is used only in the application of constraints based on qualitative or subjective supplemental site information. The following section illustrates the different effects produced by applying hard, soft, or no constraints.
Synthetic Data Experiments Figure SA shows a layered velocity model for which synthetic cross-borehole travel times were calculated. Using this synthetic data without constraints produced the velocity map of figure 8E; it is a crude reconstruction of the actual distribution. The overall pattern reflects that of the target model,but a number of spurious anomalies appear in the reconstruction. The difference between the target model and the reconstruction is another manifestation of the nonuniqueness problem in cross hole tomography. A horizontally layered solution can be forced by applying a constraint of lateral invariance; this is carried out by row-wise averaging of the noge velocities after each iteration. This yields a virtually perfect reconstruction of the target model. However, forcing perfect lateral invariance is generally undesirable. It makes it impossible to detect any real lateral variation that may be present; a discrete anomaly such as that in the earlier section (fig. 5) would be smeared out horizontally over the width of the image. For example, figure 9A depicts a model with a layered sequence cut by a vertical low-velocity zone extending from the surface to about half the maximum depth of the tomographic plane. This might represent an alluvium-filled bedrock valley, for example. An unconstrained reconstruction using synthetic cross hole and borehole-to-surface travel times (fig. 9B) provides a poor image of the original model, with low velocities near the anomalous zone, but showing discontinuities in the layering and several
13
A
0.0 ......._ _"""-_ _-.10_ _ _ _10.0.._ _...
8
0.0
.,..----~-"""""'-.,..-'---~
KEY v, m/ms
6
·5.0
·5.0
5.5 5
·1·,.
4.5
·7.3
·7.5
4
,
"I'
3.5
·10.
·10.
Figure a.-Resolution test with synthetic data. A, Layered velocity model; B, unconstrained reconstruction.
A
8 KEY v, m/ms
5.4 5.2 5 4.8 4.6 4.4 4.2
c
D
!
oJ!, \
Figure 9.-Effects of hard and soft layering constraints with synthetic data. A, Layered synthetic velocity mod· el; B, unconstrained reconstruction using synthetic borehole and surface data; C, reconstruction with hard lateral Invarlance constraint; D, reconstruction with fuzzy (f 0.75) laterallnvarlance constraint.
=
14 apparently significant but spurious anomalies. Imposition of lateral invariance leads again to a fairly accurate onedimensional velocity model, but with no possibility of reconstructing the low-velocity channel (fig. 9C). A fuzzy horizontal-continuity constraint with f = 0.75 achieves an optimal reconstruction (fig. 9D) in the conservative sense: Although the real anomaly is subdued, there are no. significant spurious anomalies; the only features that appear in the reconstruction are real ones.
SUMMARY Cross hole tomography is a mathematically underdetermined problem: Cross well travel-time data alone do not contain enough information to provide a unique velocity reconstruction. In order to obtain reliable tomographic images despite this nonuniqueness, it is necessary to constrain the reconstructed velocity fields to match known boundary conditions, such as measured velocities in the boreholes, and also to place reasonable limits on
maximum and minimum velocity in the tomographic plane. It is also necessary to supplement the travel-time data with any additional site information, even though there is invariably some uncertainty associated with this additional information. By using fuzzy constraints, it is possible to incorporate this uncertainty into the velocity inversion, so that well. determined constraints have a stronger influence than more uncertain ones. It is also important to use the measured travel-time data as fully as possible. When velocity contrasts are very large, ray-shooting methods may fail to model a significant fraction of the ray paths, because of the shadow-zone problem. When this occurs, the corresponding measured data cannot be used in the inversion. That problem has been obviated by modeling the migration of the entire wavefront, using a method based on Huygens' Principle. This ensures that model travel times can be calculated for every source-receiver pair, and thus none of the measured data are wasted.
MIGRATOM USER'S MANUAL SYSTEM REQUIREMENTS
i, : I'
I!
MIGRATOM was designed to run on PC-compatible (MS-DOS-based)5 microprocessors. A minimum of 640 kbyte of RAM and an 8086 processor are required, but more RAM (2 Mbyte or more) and a faster processor (80386 or 80486) are highly recommended. MIGRATOM has been tested with MS-DOS versions 5 and 6, and with Microsoft Windows operating system versions 3.0 and 3.1. MIGRATOM can be loaded and run from the floppy disk supplied, but performance will be improved if it is first installed onto a hard disk.
INSTALLING MIGRATOM An installation utility (MTINST.EXE) is supplied on the distribution disk. To run it, place the distribution disk into a floppy drive, and log onto that drive by typing A: (or B: as the case may be) and pressing Enter. Then type MTINST and press Enter. The installation utility will create a directory named \MIGRATOM on your hard disk and copy the files from the distribution disk to this directory. It will also create a directory for graphics driver files, as described below. 5-rhe names of specific commercial software products are given for the purpose of information only. Reference to specific products does not imply endorsement by the U.S. Bureau of Mines.
iI. I
1
Other files included on the disk include example data files (DEM01.TT and DEM02.TT), a program information file for Windows 3.1 (MIGRATOM.PIF), the plotting program TOMOPLOT and its configuration program SETUP, a utility (FILECONV) for translating data files between the formats used by BOMTOM, BOMCRATR, and MIGRATOM, and an update file containing information more recent than this publication (README.DOC). A complete list of the files on the distribution disk is given in appendix A, and descriptions of the utility programs are presented in appendix B.
Graphics Drivers MIGRATOM was written in Turbo Pascal. Turbo Pascal provides a set of graphics drivers supporting most PCcompatible graphics systems. MIGRATOM uses Turbo Pascal's capabilities to detect the type of graphics hardware available and load the appropriate graphics driver. This enables the program to run on systems with CGA, EGA, VGA, Hercules, and AT&T graphics hardware. Graphics drivers are stored on the MIGRATOM distribution disk in the directory \MIGRATOM\BGIj the installation utility will create a directory with this name on the hard disk and copy all of the files.
15 Extended Memory
;'
\
Under MS-DOS, the amount of system memory available for software and data is limited to 640 kbyte, even though the physical memory capacity of a computer may be much greater. MIGRATOM uses a commercial memory extender (the Quinn-Curtis Huge Virtual Array Toolbox) for accessing memory above the MS-DOS 64O-kbyte limit. This software enables MIGRATOM to store arrays in extended (XMS) memory, making it possible to work with large numbers of ray paths and pixels. When MSDOS memory is insufficient, arrays are stored in XMS memory, if available. The amount of XMS memory available is detected automatically. If insufficient XMS memory is available, MIGRATOM will attempt to store arrays on a hard disk; this enables the program to work with very large data sets (tens of megabytes), but slows execution considerably. More information on XMS extended memory is available in the MS-DOS manual.
Then type MIGRATOM and press Enter. An introductory screen will appear showing the MIGRATOM version number and release date, briefly describing the program, and reporting the amount of available DOS memory. Press Enter to proceed to the main menu screen. MENU STRUCTURE
The program is menu driven, with a main menu and three submenus: a file menu for specifying input and output files; a constraint menu for specifying global and node constraints; and an options menu for setting various program options. The main menu screen (shown in figure 10) displays current values of various parameters, which may be altered through the submenus. The main menu appears at the bottom of the screen. It allows the user to select among the following choices:
STARTING MIGRATOM
To begin running MIGRATOM under MS-DOS, log onto the MIGRATOM directory by typing CD\ MIGRATOM at the C: (or D: if appropriate) prompt.
F: access the file menu; E: activate the grid editor; C: access the constraints menu; 0: access the options menu; G: go (begin the tomographic calculations); X: exit MIGRATOM.
MIGRA'l'CH: Tomography using Wavefront Migration and Fuzzy Constraints
'.,
Files Input: Travel times: o times Velocity model: o nodes Output: Travel times: Velocity model: MIGRATOM.VM format: text Raypaths: format: Wavefronts: format: Path Lengths: Residuals: MIGRATOM.RSD Sum: MIGRATOM. SUM Directory: C:\MIGRATOM
F: Files
E: Edit
c:
Constraints
Global Constraints Vmin: 1.0 Vmax: 6.5
Options Display: Graphic Pixels: rectangular Max # iterations: 15 # straight-ray it.: 15 Tolerance: 1.0E-0002 Incr. Tol.: -1.0E+0002 Time step [ss]: 30.0 Anisotropy (Vh/Vv): 1.000 Damping Factor: 1.000 Wavefront density: 3.00 Constr. Inter. Par.: 5 Beginning V model: Mean V
0: Options
Figure 10.-MIGRATOM main menu screen.
G: Go
X: Exit
16
"
'Ii I,
A menu selection may be canceled by pressing the Esc key. The file menu allows the user to specify an active directory, to select input flles, and to specify the names and formats of the output fIles. The default startup directory is \MIGRATOM. This may be changed by pressing F (for flle)and D for directory. A window will open, listing subdirectories of \MIGRATOM. A subdirectory may be selected by positioning the cursor with the cursor control keys (Home, End, PageUp; PageD own, and arrow keys) and pressing Enter. This process may be repeated as needed to move outward in the directory structure. The process can be reversed by selecting the directory represented by two periods (..); this moves back one branch toward the root directory. More information about directory structures is available in the MS-DOS manual. Input fIles are of two types, as described in the following section: travel-time (or amplitude) data files and initial velocity (or attenuation) model files. Pressing F for file, I for input, T for travel time, and Enter will produce a list of files in the· current directory with names matching the specification ,,* .TT" (or other specification supplied by the user). A travel-time flle is then loaded by selecting its name (using the arrow keys) and pressing the Enter key. A velocity model stored in a file "*.VM" is selected in a similar way. The options menu permits the user to alter the default values of certain parameters that affect program execution. Pressing 0 opens the options submenu, from which one of these parameters may be selected; the user is then prompted to supply a new value. These options are described in detail in a subsequent section. The constraints menu holds two submenus: one for global constraints and one for node constraints. Global constraints are maximum and minimum acceptable velocities. Node constraints apply to groups of nodes, and are
Example data file. Units ft, ms. ---- Source X, Y, Z ft
1.;,.
,.
I
specified through the grid editor. Application of constraints will be described below. DATA FILES
A set of measured travel times or reduced amplitudes (as described in the "Theoretical Background" section), along with source and receiver locations, must be supplied in a flle having the format shown in figure 11. The file can be produced and edited using a text editor or spreadsheet program. Two header lines contain any information the user wishes to include for descriptive purposes, with a maximum line length of 120 characters, but no other format restrictions. These header lines are followed by the data, which are arranged in eight columns (separated by one or more spaces): a ray identification string, the Cartesian (x, y, z) coordinates of the source and of the receiver for each ray, and the travel time of the first arrival. The width of the ray identifier field should be 11 characters; the width of the numeric fields can vary as long as they are delimited by spaces. The example in figure 11 contains data for rays traveling from 11 source positions to a single receiver. The units of distance and time in the input file determine the units of velocity calculated by MIGRATOM; for example, with locations in meters and times in milliseconds, the calculated velocities will have units of meters per millisecond, or equivalently, kilometers per second. MIGRATOM assumes that the source and receiver locations define a vertical plane (however, this is not tested for). The imaging plane is thus defined by the vertical (z axis) and a horizontal (h axis), where the h coordinate is defined as
(18)
---- Receiver X, Y,
Z ----
ttime
1
-5.840
-2.400
10.000
0.000
0.000
12.000
0.4225
2
-5.840
-2.400
11.000
0.000
0.000
12.000
0.3870
3
-5.840
-2.400
12.000
0.000
0.000
12.000
0.3700
4
-5.840
-2.400
13.000
0.000
0.000
12.000
0.3615
5
-5.840
-2.400
14.000
0.000
0.000
12.000
0.3590
6
-5.840
-2.400
15.000
0.000
0.000
12.000
0.3525
7
-5.840
-2.400
16.000
0.000
0.000
12.000
0.3570
12.000
0.3760
8
-5.840
-2.400
17.000
0.000
0.000
9
-5.840
-2.400
18.000
0.000
0.000
12.000
0.3965
10-
-5.840
-2.400
19.000
0.000
0.000
12.000
0.4245
11
-5.840
-2.400
20.000
0.000
0.000
12.000
0.4645
Figure 11.-Travel-time file illustrating required formal
17 The Xo and Yo coordinates represent the origin of the imaging area. Data collected over a horizontal plane may be input to MIGRATOM by defming a coordinate system with x and z axes horizontal, and arranging the data fIle as above. In a similar manner, data collected on an arbitrarily oriented plane may be transformed for MIGRATOM by defming a coordinate system such that the z axis lies in the plane. An optional second input fIle (*.VM) specifies the node and pixel dimensions to be used for the velocity imaging, as well as an initial velocity model. An example is shown in figure 12. The first line specifies the number of nodes in the horizontal and vertical directions, respectively. In this example the tomographic grid is four nodes wide by three nodes high (three pixels by two pixels), and the starting velocities are the same at all of the nodes. Note that the physical dimensions of the region are specified by the source and receiver locations in the travel-time fIle; the second fIle only describes how that region is to be divided into pixels and gives initial velocities for the nodes. If an initial velocity model fIle is not specified, MIGRATOM will generate a default pixel geometry and starting velocity model, as described in the following section. Various standard output fIles are produced, and additional optional output can be generated if requested by the user. These are described in a later section.
GRID GEOMETRY As described above, MIGRATOM constructs an imaging plane defined by hand z axes. The default limits of the imaging area are defined by the extreme values of source and receiver positions on the imaging plane. The imaging area is divided into a pixel grid with the default number of pixels M comparable to, but less than, the number of measured travel times N: M =MH*M z MH
=M z = Integer (2 * N 1/ 3) ,
(19)
where the Hand Z subscripts refer to the horizontal and vertical directions, respectively.
4 3.500 3.500 3.500
3 3.500 3.500 3.500
3.500 3.500 3.500
3.500 3.500 3.500
Figure 12.-Veloclty model tile illustrating required format.
The default pixel geometry is constructed by MIGRATOM while the travel-time fIle is read, and may be changed by the user immediately thereafter. Default values are displayed for coordinates of the grid origin (upper left corner) and terminus (lower right corner), number of pixels in the hand z directions, and pixel dimensions in the same directions. The user may change the size and position of the imaging area by specifying new values for the coordinates of the origin and/or terminus. The default division of the imaging area into pixels may be altered by specifying a different number of pixel rows and! or columns. If the user wishes to specify a pixel size, MIGRATOM matches the desired size as closely as possible while maintaining an integral number of pixels in the imaging area. Velocity is specified at the nodes of the pixel grid, and is taken to vary in a continuous linear fashion between the nodes. This is similar to the approach used in BOMCRATR, but differs from that used in BOMTOM, where the region is divided into pixels of constant velocity, bounded by discontinuities. Note, therefore, that MIGRATOM (as well as BOMCRATR) will inevitably produce somewhat smoother velocity models than those generated by BOMTOM. A default velocity model is also generated by MIGRATOM as a travel-time fIle is being read. For each travel time, the straight-line distance from source to receiver is calculated; dividing this distance by the travel time yields a minimum average velocity for that ray (since the straight line is the minimum-length path, and the actual ray path may be longer and the actual velocity may be greater). These ray mean velocities are then averaged to obtain the mean velocity for the plane, and this value is displayed6 and assigned to each grid node for the starting model.
GRID EDITOR MIGRATOM provides a grid editor for viewing and modifying an initial velocity model. A mathematically unique velocity reconstruction is independent of the starting model chosen; thus, modifying the initial model allows the user to test for nonuniqueness. Furthermore, when the solution is nonunique because of insufficient angular coverage of ray paths, it is important to incorporate other available site information into the inversion. One way to do this is to apply constraints, as discussed in the "Theoretical Background" section, as well as in the following sections. An additional method is to incorporate the site ~e maximum and minimum calculated ray velocities are also displayed, and inspection of these values may help the user to identify errors in the travel-time data.
I "
18
V
information into the starting model; in general, the reconstruction will remain as close as possible to the initial model while still satisfying the travel-time data as closely as possible. After the program menu is displayed, pressing E on the keyboard activates the grid editor. If a velocity model has been selected through the files menus, the velocity matrix is displayed on the screen; otherwise, the grid editor allows the user to create a new velocity model. An individual node can be selected for editing by highlighting it with the arrow keys. Groups of nodes can be selected by highlighting the first member of the group, pressing the Insert key, and then using the arrow keys to highlight additional nodes. An entire row of nodes can be selected by pressing Ctrl-End! and a column by pressing Ctrl-PageDown. After a node or group of nodes has been selected, the new value can be typed in. When the Enter key is pressed, the new value is displayed at the appropriate node(s). When editing is complete, press the Esc key to return to the main nienu. The edited velocity model may be saved in a disk file; it will have the format described above for input files, so that it can be used for subsequent runs. The grid editor is also used to set constraints on groups of nodes, as described below.
i
CONSTRAINTS
hi :
I'"
I
'I,
I
:·1'
i"! ,I
i
Because of deficiency of coverage in common sourcereceiver geometries, travel-time data may not contain sufficient information to obtain a mathematically unique reconstruction of velocities. It is important in such cases to use all other available information about the site. Application of constraints enables the user to eliminate velocity solutions that are mathematically acceptable in terms of satisfying the travel-time data, but geologically unreasonable. For example, a nonunique inversion may result in a model with unrealistically high or low velocities, one that agrees poorly with measured borehole velocities, or a model velocity structure that appears unreasonable based on regional stratigraphic or structural information. In MIGRATOM, a distinction is made between constraints that are applied over the entire grid (global constraints) and those that are applied locally to portions of the grid (node constraints). These will be discussed in turn in the following sections. Global Constraints
:,' I·
The global constraints that MIGRATOM allows the user to specify are upper and lower bounds on reconstructed velocities. Upper bounds may be applied based on a general knowledge of rock types present at the site. Tweeton (22) showed with synthetic models that application of a tight upper bound can dramatically improve the
accuracy of a reconstruction. However, caution is warranted because too tight an upper limit will cause inaccuracies; limiting velocities typically results in areal expansion of high-velocity regions. Lower bounds are generally more difficult to justify, because velocities may be very low in fractured rocks. Node Constraints
Node constraints are useful for forcing the solution to match known boundary values (e.g., measured borehole velocities), and for maintaining uniformity over groups of nodes (e.g., continuous layers). Because the latter type of constraint is often quite uncertain, node constraints are assigned an estimate of uncertainty, which is used as a weighting factor so that better determined constraints have a stronger influence on the solution than do poorly determined ones. Such weighted constraints are herein referred to as "fuzzy" constraints. The node constraints are entered by means of the grid editor. Each node in the grid has an associated constraint parameter, which is a real number consisting of an integer part and a fractional part (fig. 13). The integer part designates the type of constraint to apply: 0 means the velocity is unconstrained and can be freely adjusted by MIGRATOM to obtain the best possible agreement with the travel-time data; a negative number indicates that the
Soft layering constraint
-1.0 -1.0 -1.0 -1.0 -1.0 -1.0 -1.0 -1.0 -1.0
0.0 11.5 0.0 0.0 0.0 0.0 2.0 2.0 0.0
0.0 1 .5 0.0 0.0 0.0 0.0 2.0 2.0 0.0
0.0 1.5 0.0 0.0 0.0 0.0 2.0 2.0 0.0
-1.0 0.0 (0 0.0 ( Hard borehole constraint
0.0 1.5 0.0 0.0 0.0 0.0 2.0 2.0 0.0
1
0.0 1 .5 0.0 0.0 0.0 0.0 2.0 2.0 0.0
~ 0.0 1.5 0.0 0.0 0.0 0.0 2.0 2.0 0.0
I
O';:~;:::r:~:~g
constraints
-2.5 -2.5 -2.5 -2.5 -2.5 -2.5
-2.5 -2.5 -2.5 -2.5
Soft borehole constraint
Figure 13.-Node constraint matrix. Integral part of each con· stralnt parameter Indicates type of constraint to apply: Zero means node velocity Is unconstrained; negative values Indicate that velocity Is fixed at Its Initial value; positive values Indicate that velocity Is to be averaged over a group of nodes. Different Integers designate different groups. Fractional part of constraint parameter Indicates fuzziness or uncertainty In constraint: Zero after decimal point Indicates hard constralntj higher values after decimal point Indicate greater uncertainty In constraint.
r Ii 19 velocity is to be held fIXed at the value in the starting model (this is useful for forcing the solution to match measured borehole velocities); a positive number assigned to a selected group of nodes indicates that uniformity of velocity is to be maintained over that group (this is accomplished by averaging velocities over the group, and is useful for producing uniform layers in the reconstruction). Different groups may be selected and assigned different positive constraint parameters; uniformity is then enforced for each group, independently of the other groups. The fractional part of the constraint parameter represents the uncertainty in the constraint, or the "fuzz factor" f. After each iteration, two different velocity values are calculated for each node: an u,-lconstrained velocity Vo determined by the SIRT equations and a constrained velocity V1 calculated by strict enforcement of the constraint. The fuzzy constraints are applied by replacing the unconstrained corrected velocity at each node with a linear combination of the unconstrained and fully constrained values (see equation 17 above). INVERSION: STRAIGHT-RAY AND CURVED-RAY PROCESSING
As was the case for both BOMTOM and BOMCRATR, MIGRATOM calculates velocities using a variation of the SIRT. This involves modification of an arbitrary initial velocity model by repeated cycles of three steps: forward computation of model travel times, calculation of residuals, and application of velocity corrections. Forward calculations in the new program may be carried out in either of two ways. The straight-ray approximation allows very rapid calculation of model travel times. Curved-ray calculations involve a great deal more computation, but are more physically realistic. The curved-ray algorithm in MIGRATOM models the migration of the entire wavefront according to Huygens' Principle, as described in the "Theoretical Background" section above. The reader may refer to appendix C for details of the wavefront calculations. The initial wavefront is defined by 60 tracking points with takeoff angles at 6° intervals. As the wavefront expands, the density of tracking points along the wavefront is maintained by interpolating new tracking points whenever the separation of adjacent points exceeds the size of a pixel. Tracking points are discarded when they have traveled a certain minimum distance beyond the region of interest (i.e., the pixel grid), to reduce memory requirements and execution time. The program is designed to run on a personal computer with 640 kbyte of RAM; because of this memory restriction, MIGRATOM does not store simultaneously the trajectories of every point on the wavefront. Consequently, the forward calculations are done twice; a first pass computes travel times and identifies the takeoff angles for rays traveling from each
source to each receiver, and a second pass retraces the ray paths with these takeoff angles, and tabulates the distance traveled by each ray in each pixel. The travel-time residual for each ray (difference between measured and calculated travel times) is used to calculate an incremental correction factor for each pixel sampled by that ray. The incremental correction factors for all rays are accumulated before being applied to the pixels (hence the term "simultaneous" iterative reconstruction). For a particular ray path i, the incremental slowness correction .6.Pij applied to each pixel j traversed by that path is proportional to the travel-time residual .6.ti for the ray and to the path length dij of the ray within the pixel: .6.p .. =
.6.tAj
IJ
M
Np
2; k=1
(20)
(dik)2
where 1:5;i::s;N, 1:5;j~M, N is the number of travel times, M is the number of pixels, and Np is the number of ray paths that sample pixel j. In other words, the residual is backprojected along the ray path to generate model perturbations (see equations 6 and 11). The incremental slowness corrections are summed to obtain the net correction for each pixel: N
t. P j
= ,2;
t. Pij •
(21)
1=1
Correction factors for each grid node are then obtained by averaging the corrections calculated for each pixel attached to that node. After the correction factors are added to the node velocities, constraints are applied, as described above. Fuzzy constraints attempt to make optimal use of imperfect a priori information. OUTPUT FILES
By default, MIGRATOM writes three output files for each run, containing the final velocity model, information about residuals, and a summary of the run. Default file names for this output have the root "MIGRATOM" and extensions ".VM," ".RSD," and ".SUM," respectively. The root file name can be modified by pressing F for file, 0 for output, and entering the new name. Additional output files of four types are generated as specified by the user: a list of calculated travel times, wavefront points, ray-path points, and the matrix of path lengths. These optional files are specified through the file output menu; they are useful under certain circumstances outlined below. A summary of input and output files is presented in figure 14, and appendix D details the formats of the different output files, for users who wish to write their own utility programs.
'I
20
(.......~~.~~;.~.~;;~....... , •••••••••
••••••••••••,
(·····~·;~~~~~~·;;i~···) ".
····i'···············..·····•·····
.,1
/ ' - -_ _--,-_ _---'.................
I
. . . . . ~. . . . . . . . . .:.J. . . . . . . . . . . .. (travel times or amplitudes)
...... (' ...........
Starting model (velocities or inverse attenuation)
. .•.....
/:.::7· ......·..·..· ..··. ···. ·..·..···......
") ...........
'----r----.--r'~~::~i~-l, (~.RAY\ .I *.WAV\
/*.PLN\\
, Ray ) i, Wave w ) ~. Path I \, paths i '\ fronts / \ lengths! ....., ........ l
\\.,
I
\ .... , ......,.
\ .........../
///
l" ..-:i...... ~........ jf· ........i
TOMOPLOT
!
I
i Graphics software i t.................................... .!
Figure 14.-Summary of data and program files Involved In producing tomogram. Dotted files and arrows Indicate optional flies or user actions.
between calculated and measured travel times). This can be useful for identifying problems in the data such as typographical errors or incorrectly picked travel times. The summary ftle lists the input and output ftles associated with the run, constraints applied, and other optional run settings. It also contains the final velocity model in a format that can be read by the contouring program TOMOPLOT. The summary file can therefore be used directly as input for TOMOPLOT. In addition, the summary file contains the constraint matrix; the matrix of sampling density (showing the number of rays that sample each pixel); and the coordinates of all sources, receivers, and pixels. Optional output files are useful for some special tasks. For example, ray paths and wavefronts may be saved for graphical presentation, using either HPGL or text format. These files are not generated by default; they are only produced if requested by the user. As above, text format is recommended for better quality, if the user has other graphics software available. Ray-path text files are written as the model wavefront propagates; therefore, they are arranged by time rather than by path, and they need to be sorted. Each line in the ftle contains a source and receiver index, which can be used to sort the file into individual ray paths. An output travel-time file contains all calculated and measured travel times. The output ftle of path lengths is primarily useful for debugging purposes, and may become very large.
OPTIONS
,U I
I
il
I
,I
I . I
I
I
The fmal velocity model can be saved in either text or Hewlett-Packard Graphics Language (HPGL) format. In text mode, the file is saved in the same format as the initial velocity model; it can therefore be used as input for a subsequent run. When saved as an HPGL graphics file, the final model can be imported by many graphics and word processing programs, or copied to an HPGL pen plotter. The exact appearance of the output varies according to the type of plotter or the software that imports the HPGL file. For superior quality graphics output, however, it is recommended that the final model be saved as a text file and imported by commercial software with contouring capability, or by the USBM program TOMOPLOT, as described below. The residual summary (*.RSD) contains two types of information. First, the convergence history of the iterative reconstruction is documented, with the root-mean-square (RMS) residual as a function of iteration number. This file also lists the RMS velocity perturbation (indicating how much the velocities have changed from their starting values) after each iteration. Second, a sorted list is presented of the 50 largest residuals (largest differences
This section describes the settings that the user can change through the options menu. D: Display. This enables the user to select a text-only display rather than the default graphical display. This option allows MIGRATOM to run on PC's without graphics capability. It also enables MIGRATOM to run as a background process under the Windows operating system. A separate section on running under Windows is presented later. For systems with color graphics capability but a monochrome monitor (as is the case for many portables), the default graphics color palette can be replaced with a monochrome palette. P: Pixels. Velocities within the imaging area are specified at pixel corners (grid nodes) and interpolated within the pixels. The velocity distribution within individual pixels may be specified in two different ways. The default method ("rectangular") involves four-point bilinear interpolation, and results in smoothly varying velocities within each pixel (i.e., continuously varying gradients). The alternative method divides the rectangular pixels into triangular subpixels, each with a constant velocity gradient. The latter approach was used in BOMCRATR, because the constant
21 gradients enabled the use of analytic solutions for ray paths and travel times, which greatly enhances computational speed. In MIGRATOM, the choice of pixel type does not affect execution time, and the effects on calculated travel times are generally small. Figure 15 illustrates the velocity distribution within a single pixel, as represented by three-point (BOMCRATR) and four-point (MIGRATOM default) interpolation. M: Maximum number of iterations. Iterative calculations are terminated when any of four criteria are met: absolute convergence, incremental convergence (see below), user interrupt (pressing the Esc key), or completion of the specified maximum number of iterations. An excessive number of unconstrained iterations generally produces models with unrealistically large velocity variations; an insufficient number in general results in smooth models without sharp resolution of anomalous regions. M may range from 0 to 100; the default value is 15. S: number of Straight-ray iterations. S may range from o to M; the default value is 15. Straight-ray iterations are performed before curved-ray iterations; thus when S is less than M, MIGRATOM performs S straight-ray iterations, followed by (M - S) curved-ray iterations (unless convergence criteria are satisfied first). A: Absolute tolerance. In general, the model traveltime residuals (differences between measured and calculated travel times) decrease with increasing iteration number (if the iteration process continues converging). The absolute tolerance is the value of RMS residual causing the iterations to terminate. A should initially be set close to the average uncertainty in the travel-time data, and adapted as necessary for subsequent runs. I: Incremental tolerance. In general, the rate of decrease in RMS residual is fastest in the initial iterations, diminishing progressively thereafter. Iterations terminate when the rate of convergence becomes slower than 1. I
may be assigned positive, zero, or negative values. Typically the RMS residual increases for the first curved-ray iteration if more than one or two straight-ray iterations were performed first, so I should be assigned a negative value when both straight- and curved-ray iterations will be used. In a linear iterative inversion, stable convergence is guaranteed (32), i.e., the RMS residual will continue to decrease as long as iterations are carried out. In a nonlinear inversion, this is not true. Residuals tend to decrease, but may occasionally increase or oscillate with increasing iteration number. The reason for this is related to the fact that the ray paths are not fIXed, but change according to the velocity distribution for each iteration. A small increase in residual from one iteration to the next does not necessarily mean that execution should be stopped, because subsequent iterations may continue to improve the fit. For curved-ray processing the incremental tolerance should generally be set to a modest negative value; for straight-ray processing a small positive value (for example, one-tenth the mean uncertainty in the travel times) is appropriate. T: length of Time steps for the curved-ray iterations. The Huygens algorithm is essentially a numerical integration method applied to an initial value problem. The accuracy of any numerical integration technique depends on proper selection of step size. The default step size is defined as the length of time required to travel half the diagonal length of a pixel at the mean velocity of the tomographic plane. For sharply varying velocity models, it may be necessary to reduce the step size to obtain accurate results. The step size may be increased slightly to reduce execution time, but caution is advised: If the time steps are too large, the wavefront may fail to sample certain pixels, which will cause erroneous results.
i
j,
Figure 15.-lntraplxel velocity distributions. A, Two triangular regions with uniform gradients; B, smoothlyvarying gradient produced by bilinear velocity Interpolation.
22
i
i I I
I, iii
Iii
,ii.: , I
.'1'
[I': i!! 'i
I
v.. Velocity anisotropy. The user may specify an elliptical dependence of velocity upon travel angle. The velocity ellipse is assumed to have horizontal and vertical principal axes, whose relative magnitudes are specified by the ratio vH/vv' Ratios greater than 1 indicate that horizontal velocity VH exceeds vertical velocity vv, a relationship that may be observed in horizontally bedded shales, for example. Anisotropy is accommodated by stretching the z (vertical) coordinates of all sources, receivers, and grid nodes by a factor equal to the velocity ratio, before beginning the iterative calculations (55). This implicitly stretches the velocity ellipse into a circle (isotropy), so the calculations can proceed without any additional modification. After the froal iteration, the z coordinates are recompressed to their initial values. Note that anisotropy is thus treated as spatially uniform over the area of investigation. w.. Wavefront density. As described above, the number of tracking points on the expanding wavefront is maintained dynamically, with new points interpolated when the nearest neighbor distance reaches a critical value. The default value of 3.0 means that a new tracking point is interpolated when two adjacent points are separated by more than 1/3 the diagonal length of a pixel. Decreasing W causes the wavefront density to decrease and the critical separation to increase. Execution time is approximately proportional to W. Reducing W will thus speed up the wavefront propagation, but it is not recommended that W be set to values below 1. C: Constructive interference parameter. For each wavefront tracking point, the travel direction is determined by constructive interference with the Huygens wavelets of neighboring tracking points (see figure 6). Initially, the neighboring tracking points are those with adjacent takeoff
angles. However, if the velocity variations are sufficient, refraction may bring tracking points with different takeoff angles into proximity (e.g., if the wavefront wraps around a low-velocity zone). Therefore, it is necessary to identify the nearest neighbors for each tracking point; this is one of the most time-consuming parts of the wavefront calculations. Execution time can be greatly reduced by limiting the nearest neighbor search for each tracking point P to the C points with takeoff angles closest to that of P. C may be assigned any integer value greater than or equal to 0; execution time is roughly proportional to C. If C is set too low, the wavefront may develop spurious kinks or loops, and the calculated travel times and ray paths may become unreliable. This is discussed further in the "Special Topics" section below. The default value of 5 is generally adequate for velocity contrasts up to 100%. If a straight-ray reconstruction has larger contrasts, C should be increased to at least 10. B: Beginning velocity model. While reading the traveltime input file, MIGRATOM calculates a mean velocity for each ray (source-receiver separation divided by travel time), and an overall mean velocity for the whole plane (sum of ray mean velocities divided by number of rays). The default starting model assigns this overall mean velocity to each node. The alternative starting model is obtained by horizontal layer-averaging. Horizontal layeraveraging computes a mean velocity for each row of pixels, using all straight ray -paths within that row. Because the initial models are constructed while the travel-time input file is being read, the B option must be set before the travel-time file is read. Reading a velocity model file after the travel-time file will cause the calculate4 initial model to be overwritten by that read from the file.
RECOMMENDED GENERAL STRATEGY
i.
I,
The following guidelines have been found useful for efficient processing of tomographic data. In general, it is recommended that processing progress from fast and simple to more complex and time-consuming approaches as necessary. Initial inversions can be carried out quickly with straight-ray processing to decide whether the velocity contrasts may be high enough to warrant detailed ray tracing. Two or more straight-ray inversions with different initial models (e.g., uniform or horizontally layered) can be helpful in evaluating the degree of nonuniqueness associated with the data set. It is also important at an early stage to check the output file containing information on residuals; data with large associated residuals may be due to incorrect travel-time picks or typographical errors, and
should be reexamined. If the high-residual data appear to be correct, the discrepancies may indicate the need for curved-ray processing. Remember that the default pixel size is determined only by the number of travel times; it is governed by the mathematical resolution of the data, which may differ significantly from the physical resolution. Representative data traces should be analyzed to determine the dominant frequency of the first-arriving energy, which can be combined with an average velocity estimate to provide an approximate wavelength and an indication of the physical resolution possible. The USBM software BOMSPS (Bureau of Mines Signal Processing Software; 56) can be used for this analysis. If the default pixel size is much smaller than the wavelength (e.g., less than 10%), it may be worthwhile to
f
23 change to a somewhat coarser pixel grid, which will reduce execution time without sacrificing real resolution. If the default pixel dimensions are larger than a few wavelengths, a somewhat rmer grid may be justified; however, the number of pixels should be kept below the number of travel times (or amplitude data) to stay within the mathematical resolution capability of the data. Similarly, the default grid range may require modification. MIGRATOM constructs a grid that fits tightly over the source and receiver positions, which is appropriate if the ray paths are confmed to this region (e.g., if the velocity contrasts are sufficiently low that ray paths can be approximated as straight lines). There may be circumstances where the physical ray paths extend beyond the grid area, e.g., if there is a high-velocity zone outside the default limits. When using curved-ray processing, it is a good idea to expand the grid area somewhat, to allow some ray-path flexibility. It is also important to keep in mind that MIGRATOM assumes that all ray paths are confined to the imaging plane (Le., it is strictly two dimensional). This may not be the case, especially if there are strong velocity contrasts in a direction perpendicular to the imaging plane. For example, if data are collected around the perimeter of a coal pillar, the actual first-arrival ray paths may be refracted through the roof or floor rock rather than directly through the relatively low-velocity coal. In this situation it is necessary to use one of two alternative approaches. First, the problem can be reduced to two dimensions by considering only the ray paths traveling through the floor rock, by making necessary corrections for the travel-time increments from the source down to the refractor and from the refractor back up to the receiver (11, 35). An alternative approach is to use the travel times of direct arrivals rather than refracted first arrivals; however, proper identification
of such phases may be difficult. The use of guided waves, generated by an appropriate source, may be very helpful in such circumstances (24-25). For curved-ray inversions with a uniform-velocity starting model, at least one straight-ray iteration should be performed first (that is, option S should be set to at least 1). The reason for this is efficiency: With uniform velocities, the ray paths will be straight lines, and there is no need to carry out the wavefront calculations. Initial curved-ray processing should be carried out using the default values for time step, wavefront density, and constructive interference parameter. Migration of a few wavefronts should be observed in graphics mode to enable recognition of problems requiring modification of the default values. Two potential problems are associated with very strong velocity contrasts. The first is referred to as "runaway" caustics; the second is reentry of clipped wavefront ends. These are described in the "Special Topics" section below. Constraints should be considered whenever a reconstruction is based on incomplete ray-path coverage, and is thus nonunique. Constraints may also be applied with more complete data sets in order to reduce the effects of noise and errors in the data. When a reconstruction appears to be geologically unreasonable in terms. of the range or distribution of velocity, the data should first be checked for errors as described above; if the problem remains, a progression of constraints should be applied, beginning with the most objective (generally borehole velocity measurements) and continuing to more SUbjective or uncertain constraints, such as maximum and minimum velocity limits and overall structural-stratigraphic configuration. Uniformity over groups of grid nodes should always be recognized as an uncertain constraint, and an appropriate fuzziness should be applied ..
SPECIAL TOPICS RUNNING UNDER MICROSOFT WINDOWS OPERATING SYSTEM
Although MIGRATOM was written as an MS-DOS application, it is strongly recommended that it be run under a multitasking operating system such as Windows or OS2, because execution time can be very long for curved-ray processing. MIGRATOM has been tested under Windows 3.0 in 386 enhanced mode and under Windows 3.1 in both standard and enhanced modes; it has not been tested under Windows 3.0 real or standard modes, nor under OS2. MIGRATOM maybe started from Windows in several different ways: for example, by setting up a program
group or program item through the Windows Program Manager; by using the Windows MS-DOS prompt; by using the "Run" command in the Windows file menu; or by selecting the executable file with the Windows File Manager. A Windows program information file (MIGRATOM.PIF) and a Windows icon file (MIGRATOM.ICO) are included on the distribution diskette. More information about running MS-DOS applications under Windows is available in the Windows documentation. Once started, MIGRATOM operates in the same way under Windows as it does under MS-DOS, with two important advantages: First, execution can be suspended at any point, enabling temporary use of the same computer for other purposes, and then resumed at the same point;
II,
II,' ,I!
,', :;,j
Ii:! "I "I
I "
~-- - ~===-~-----------------------------------------------------------------------
24 second, when running in text mode rather than graphical mode, MIGRATOM can be executed as a background process, enabling full-time use of the same computer for other tasks. For information on switching between applications, see the Windows manual. Screen graphics are easy to capture when running MIGRATOM under Windows: Pressing Alt-PrintScrn copies a bitmapped screen image to the Windows clipboard, from which it can be inserted into any Windows application. Figure 16 was produced in this way. MIGRATOM can be run as a background process only in the Windows 386 enhanced mode; standard or real modes allow task switching, but execution is suspended for any process not in the foreground. As previously mentioned, MIGRATOM must use its text display mode to run as a background process. Similarly, it can be run in a window (rather than full-screen display) only in 386 enhanced mode with a text display. "RUNAWAY" CAUSTICS AND REENTRY AFTER CLIPPING
Caustics occur when velocity gradients are sufficiently strong to bend rays with different takeoff angles so that
they arrive simultaneously in the same place; this appears as a kink in the wavefront, often in a low-velocity zone, separating higher velocity wavefront lobes (see figure 17). Continued propagation in a direction locally perpendicular to the wavefront then causes the wave field to develop two crossing branches (fig. 17B), corresponding to a continuous first-arrival wavefront and two secondary arrivals. MIGRATOM discards wavefront tracking points when they become secondary arrivals, and propagates only the first-arrival part of the wavefront. MIGRATOM recognizes such crossovers by constructing boxes defined by adjacent tracking points at successive time steps; figure 17B shows several such boxes. For each box, MIGRATOM tests a number of adjacent tracking points to determine whether or not they are located within the box; if so, they are discarded as secondary arrivals. This is quite costly in execution time, and to help speed the process, the number of adjacent tracking points considered is limited to the constructive interference parameter C (described in the "Options" section). For strongly heterogeneous velocity models, the default value of this parameter may be too small to properly detect all caustics. If this happens, the secondary arrival wavefront segments are not deleted, and a loop develops in the wavefront. If
Figure 16.-MIGRATOM screen graphics captured by Microsoft Windows operating system.
25 A
imaging area (this requires reloading the travel-time data and modifying the default grid); or interrupt the processing (Esc), increase the density of wavefront tracking points, and resume with the same' grid setup.
B
FORWARD MODELING
Figure 17.-Schematlc illustration of caustic generated by strong velocity contrast. A, Successive wavefront positions and ray paths; B, detail of caustic point showing crossing ray paths (arrows) and wavefronts.
this occurs, the processing should be stopped by pressing the Esc key, the value of C should be increased, and processing can be resumed via the Go command. An additional infrequent problem associated with caustics occurs when a crossover develops at a receiver location. This may cause the takeoff angle to that particular receiver to be inaccurately calculated. A further problem that may develop in association with sharp ray curvature is reentry of a wavefront segment after clipping. MIGRATOM clips tracking points from the wavefront when they have traveled outside the imaging area by a distance equal to 20% of the imaging area height or width. This is necessary to enhance performance and to prevent memory overflows, but the clipped wavefront ends are somewhat unstable numerically, and in some cases they may propagate back into the imaging area. This is a problem primarily because it can cause arrivals to be missed at a number of receivers. There are two remedies for this situation: Start over with a wider
It is useful to evaluate the resolving power of any experimental geometry by generating and inverting synthetic travel-time data, as in the "Theoretical Background" section of this report. This can be accomplished with MIGRATOM in two alternative ways. First, for simple geometries with sources and receivers placed along two or more sides of a rectangle, synthetic data can be generated by loading or editing a velocity model and then pressing "G" for Go to begin the inversion. If no travel-time input file has been read, MIGRATOM will offer the user two choices: (1) return to the main menu and read a data file or (2) proceed with the forward model. MIGRATOM then prompts the user to supply the name of a file in which to store the synthetic data, and requests information on the disposition of sources and receivers around the rectangle. Then MIGRATOM calculates and files the travel times, and terminates. Straightor curved-ray travel times will be computed depending on the setting for S (number of straight-ray iterations) in the options menu. For source-receiver geometries not confined to the edges of a rectangle, the user must first set up a traveltime file containing the source and receiver locations (as described in the section "Data Files" above), and "dummy" travel times? Then start MIGRATOM and specify an output file for travel times. After setting up a velocity model (by reading a file or by using the grid editor), carry out a single iteration. The travel-time output file will then contain the synthetic travel times for the velocity model used. This file of synthetic travel times can be used as input to MIGRATOM.
I
,I' I
,ii i ,
BENCHMARKS This section compares the performance of MIGRATOM with those of BOMTOM and BOMCRATR, in terms of execution time, ability to model ray paths, and accuracy. Benchmark testing involved the use of both synthetic and field data sets; the former allow assessment of accuracy because the "true" solution is known. Both straight-ray and curved-ray inversions were carried out by BOMCRATR and MIGRATOM. Processing was carried out on an 80486 processor running at 33 MHz;
10 iterations were performed for all models. The results are summarized in table 2 and figure 18. 7Dummy travel times should be nonzero but small. MIGRATOM does not ignore them, but uses them as an indication of when to begin checking for arrivals. For simplicity, they may be set to a constant value for all paths; for more efficient processing, they may be made proportional to path length (spreadsheet software can do this quite easily).
"
" I
j
26 Table 2.-Performance comparison: MIGRATOM, BOMCRATR, AND BOMTOM Data set
synthdat
flelddat
foidel5
ohio xhole
N travel times ................ M pixels .................... l Size " " " " , , " " " " " " Execution time, s: BOMTOM BOMCRATR, straight ....•... BOMCRATR, curved .....•... MIGRATOM, straight MIGRATOM, curved ..•...... Percentage of successful ray paths: BOMTOM BOMCRATR, straight ........ BOMCRATR, curved .....•... MIGRATOM, straight MIGRATOM, curved •........
21 12 252
120 130 15,600
393 100 39,300
837 225 188,325
1 10 325 5 300
2 60 4,775 25 7,692
5 189 12,020 52 24,846
9 772 20,640 196 336,750
................
........
••••••••
I
100.0 100.0 100.0 100.0 100.0
•••••••
........
100.0 100.0 90.8 100.0 100.0
100.0 93.6 61.8 100.0 99.0
100.0 99.8 60.1 100.0 98.6
lFor comparison purposes, the size of the inversion is defined as the product of the number of travel times (N) and the number of pixels (M).
Execution speed was evaluated for inversions of various "sizes," where size is defmed as the number of elements in the matrix D in equation 3 (the product of the number of travel times N and the number of pixels M). The smaller models (synthdat and fielddat) have previously served as a basis for comparing BOMTOM and BOMCRATR (23). The larger inversions (foide15 and ohio xhole) were based on field data and have been described in more detail elsewhere (33, 35). Three performance levels are evident in figure 18. BOMTOM, optimized for straight-ray processing, is by far the fastest program for all inversion sizes, typically running in less than one-tenth the time of straight-ray inversions by MIGRATOM and BOMCRATR. One reason for the reduced straight-ray efficiency of the latter programs is that they recalculate the matrix of path lengths D after each iteration (a necessary step for curved-ray capability). Nevertheless, straight-ray run times, for the range of sizes 6
1x10
.,,--::----:---------..,
----0-
..,.,....
---
KEY MIGRATOM (C) BOMCRATR (C) BOMCRATR (S) MIGRATOM (S) BOMTOM (S)
1x1 0° -I-....-,.,.;:;;;::=;:::;::;:;;:;;;::::".....,..,.,.,.",..-,-...,..,.,.."J 2
1x10
3
4
5
1X10 1x10 1x10 MODEL SIZE (N X M)
6
1x10
Figure 18.-Executlon time (seconds) for 10 Iterations, using 486/33 processor. C and S refer to curved and straight rays, respectively.
investigated, are short enough to remain practical. BOMCRATR is about a factor of 2 slower than MIGRATOM for straight-ray processing, due primarily to the time required for its text output to the screen. Curved-ray processing requires a great deal more computation time, by as much as four orders of magnitude. The additional time is consumed by ray-tracing calculations. For small model sizes (below about 100,000), MIGRATOM and_BOMCRATRperform similarly, but for larger inversions, BOMCRATR is more efficient. For 80486 systems, an upper practical limit on curved-ray inversion size for MIGRATOM, imposed by execution time, is on the order of 106, corresponding to roughly 1,000 travel times and a 30 by 30 pixel grid. For straight-ray inversions, the limiting factor is available memory rather than computation time. The tradeoff for MIGRATOM's slower execution is increased success in ray-path modeling. The fmal velocity models for the two larger data sets all have velocity contrasts of more than 200%, and this causes serious shadow-zone problems for BOMCRATR (table 2), which failed to model nearly 40% of the ray paths. However, MIGRATOM successfully modeled virtually all paths; the few failures occurred when receivers were located at caustic points on the wavefront. The set of tomographic software available from the USBM thus spans the tradeoff curve between efficiency and rigor. BOMTOM is extremely fast and is appropriate for use whenever the velocity contrasts are modest (roughly 30% or less). A future implementation of BOMTOM will include fuzzy constraints and anisotropy. BOMCRATR is the faster of the two curved-ray programs, and when velocity contrasts are not much greater than 100%, it successfully models all but a small fraction of the ray paths. MIGRATOM can deal with much larger velocity contrasts, and runs at speeds comparable to BOMCRATR for all but the largest inversions.
27
CONCLUSIONS Two of the most significant problems in geophysical tomography are the nonuniqueness of the images obtained and the efficiency and accuracy of numerical ray-tracing methods. Nonuniqueness is a consequence of suboptimal source and receiver positioning, which is frequently dictated in geophysical studies by logistical considerations. Ray tracing constitutes the great majority of the computational cost of tomographic imaging, and can be subject to "shadow-zone" problems. MIGRATOM represents an advance in USBM tomographic software in its ray-tracing capability and in its
application of fuzzy constraints to help minimize the nonuniqueness problem. It avoids the shadow-zone problem by modeling propagation of a continuous wavefront according to Huygens' Principle, thereby making the fullest possible use of travel-time data. The cost is increased execution time in comparison to BOMCRATR, particUlarly for very large inversions. The capability to apply "soft" constraints is especially important in layered rock masses, where it helps to maintain stratification in the reconstruction while still allowing lateral heterogeneities to be resolved.
REFERENCES 1. Radon, J. Uber die Bestimmung von Functionen Durch Ihre Integralwerte Langs Gewisser Mannigfaitigkeiten. Ber. Verh. Saechs. Akad. Wiss., v. 69, 1917, pp. 262-267. 2. Worthington, M. H. An Introduction to Geophysical Tomography. First Break, v. 2, 1984, pp. 20-26. 3. Nolet, G. (ed.). Seismic Tomography, With Applications in Global Seismology and Exploration Geophysics. Reidel, Boston, 1987, 336 pp. 4. Bregman, N. D. Tomographic Inversion of Crosshole Seismic Data. Ph.D. Thesis, Univ. Toronto, Toronto, Canada, 1986, 180 pp. 5. Stewart, R R Exploration Seismic Tomography: Fundamentals. SEG Course Notes, 1991, 190 pp. 6. Anderson, D. L., and A. M. Dziewonski. Seismic Tomography. Sci. Am., v. 251, No.4, 1984, pp. 60-68. 7. Friedel, M. J., D. R Tweeton, M. J. Jackson, J. A. Jessop, and S. Billington. Mining Applications of Seismic Tomography. Paper in The Society of Exploration Geophysicists Sixty-Second Annual International Meeting and Exposition. SEG, 1992, pp. 58-62. 8. Jessop, J. A, M. J. Friedel, D. R Tweeton, and M. J. Jackson. Fracture Detection With Seismic Crosshole Tomography for Solution Control in a Stope. Paper in Proceedings of the Symposium on the Application of Geophysics to Environmental and Engineering Problems. Soc. Eng. and Min. Explor. Geophys., 1992, pp. 487-508. 9. Tweeton, D. R, C. L. Cumerlato, J. C. Hanson, and H. L. Kuhlman. Field Tests of Geophysical Techniques for Predicting and Monitoring Leach Solution Flow During In Situ Mining. Geoexploration, v. 28, 1991, pp. 251-268. 10. Young, R P., and S. C. Maxwell. Seismic Characterization of a Highly Stressed Rock Mass Using Tomographic Imaging and Induced Seismicity. J. Geophys. Res., v. 97, No. B9, 1992, pp. 12361-12373. 11. Cumerlato, C. L., V. J. Stachura, and D. R Tweeton. Application of Refraction Tomography To Map the Extent of Blast-Induced Fracturing. Key Questions in Rock Mechanics, ed. by P. A Cundall, R L. Sterling, and A. M. Starfield. Balkema, Rotterdam, 1988, pp. 691-698. 12. Devaney, A. J. Geophysical Diffraction Tomography. IEEE Trans. Geosci. and Remote Sensing, v. GE-22, 1984, pp. 3-13. 13. Lo, T., M. N. Toksoz, S. Xu, and R Wu. Ultrasonic Laboratory Tests of Geophysical Tomographic Reconstruction. Geophysics, v. 53, 1988, pp. 947-956. 14. Stroud, W. P., and R S. Dennen. Direct Tomographic Reconstruction and Applications to Mining. BuMines RI 9361, 1991, 17 pp. 15. Press, W. H., B. P. Flannery, S. A Teukolsky, and W. T. Vetterling. Numerical Recipes: The Art of Scientific Computing. Cambridge Univ. Press, New York, 1987, 818 pp. 16. Aki, K., and P. G. Richards. Quantitative Seismology: Theory and Methods. Freeman and Co., San Francisco, 1980, 932 pp.
17. McGaughey, W. J., and R P. Young. Comparison of ART, SIRT, Least-Squares, and SVD Two-Dimensional Tomographic Inversions of Field Data. Paper in Society of Exploration Geophysicists 60th Annual Meeting, Expanded Abstracts. SEG, 1990, pp. 74-77. 18. Gilbert, P. Iterative Methods for the Three-Dimensional Reconstruction of an Object From Projections. J. Theor. BioI., v. 36, 1972, pp. 105-117. 19. Wattrus, N. J. Two-Dimensional Velocity Anomaly Reconstruction by Seismic Tomography. Ph.D. Thesis, Univ. MN, Minneapolis, MN, 1984, 245 pp. 20. Peterson, J. E., B. N. P. Paulson, and T. V. McEvilly. Applications of Algebraic Reconstruction Techniques to Crosshole Seismic Data. Geophysics, v. 50, 1985, pp. 1566-1580. 21. Mason, I. M. AlgebraiC Reconstruction of a 2-D Velocity Inhomogeneity in the High Hazels Seam of Thoresby Colliery. Geophysics, v. 46, 1981, pp. 298-308. 22. Tweeton, D. R A Tomographic Computer Program With Constraints To Improve Reconstructions for MonitOring In Situ Mining Leachate. BuMines RI 9159, 1988, 70 pp. 23. Tweeton, D. R, M. J. Jackson, and K. S. Roessler. BOMCRATR-A Curved-Ray Tomographic Computer Program for Geophysical Applications. BuMines RI 9411, 1992, 39 pp. 24. Shope, S. M. Electromagnetic Coal Seam Tomography. Ph.D. Thesis, PA State Univ., University Park, PA, 1987,293 pp. 25. Stolarczyk, L. G. Radio Imaging in Seam Waveguides. Ch. in Geotechnical and Environmental Geophysics, ed. by S. H. Ward. Soc. Explor. Geophys., v. 3, 1990, pp. 187-209. 26. Thill, R E., J. A. Jessop, and M. J. Friedel. Crosshole Seismics: Applications in Mining. Paper in 30th Symposium on Rock Mechanics. Balkerna, 1989, pp. 335-342. 27. Widess, M. B. How Thin is a Thin Bed? Geophysics, v. 38, 1973, pp. 1176-1180. 28. Williamson, P. R A Guide to the Limits of Resolution Imposed by Scattering in Ray Tomography. Geophysics, v. 56, 1991, pp. 202-207. 29. Nolet, G. Seismic Wave Propagation and Seismic Tomography. Ch. in Seismic Tomography, ed. by G. Nolet. Reidel, 1987, pp. 1-24. 30. Zhou, H. How Much Velocity Variation Can Be Resolved by Crosswell Seismic Tomography? Paper in Society of Exploration Geophysicists 61st Annual Meeting, Expanded Abstracts. SEG, 1991, pp. 813-816. 31. Wielandt, E. On the Validity of the Ray Approximation for Interpreting Delay Times. Ch. in Seismic Tomography, ed. by G. Nolet. Reidel, 1987, pp. 85-98. 32. Ivansson, S. Seismic Borehole Tomography-Theory and Computational Methods. Proc. IEEE, v. 74, 1986, pp. 328-338.
,
-' 28
, ,i ,, II
. i
,i
'I' i
.'
,
I
I •
33. Jackson, M. J., D. R. Tweeton, and M. J. Friedel. Approaches for Optimizing the Use of Available Information in Crosshole Seismic Tomographic Reconstruction. Paper in Proceedings, GeoTech '92 Geocomputing Conference (Denver, CO, Aug. 31-Sept. 3, 1992). Denver GeoTech, 1992, pp. 130-143. 34. Billington, S., P. L. Swanson, F. M. Boler, and L. H. Estey. A 2-D P-Wave Velocity Tomographic Experiment in a Deep Mine. Paper in Pre-Workshop Volume: Workshop on Induced Seismicity, 33rd U. S. Symposium on Rock Mechanics. Int. Soc. Rock Mech., 1992, p. 1. 35. Friedel, M. J., M. J. Jackson, D. R. Tweeton, and M. Olson. Application of Seismic Tomography for Assessing Yield Pillar Stress Conditions. Paper in Proceedings of the 12th Conference on Ground Control in Mining. WV Univ., Morgantown, WV, 1993, in press. 36. Dennen, R. S., and W. P. Stroud. Radar Hazard Detection in a Coal Structure. Min. Eng., v. 34, No.4, 1991, pp. 413-418. 37. Menke, W. The Resolving Power of Cross-Borehole Tomography. Geophys. Res. Lett., v. 11, 1984, pp. 105-108. 38. Bregman, N. D., R. C. Bailey, and C. H. Chapman. Crosshole Seismic Tomography. Geophysics, v. 54, 1989, pp. 200-215. 39. Cerveny, B. Ray Tracing Algorithms in Three-Dimensional Laterally Varying Layered Structures. Ch. in Seismic Tomography, cd. by G. Nolet. Reidel, 1987, pp. 99-134. 40. Langan, R. T., 1. Lerche, and R. T. Cutler. Tracing of Rays Through Heterogeneous Media: An Accurate and Efficient Procedure. Geophysics, v. 50, 1985, pp. 1456-1465. 41. Julian, B. R., and D. Gubbins. Three-Dimensional Seismic Ray Tracing. J. Geophys., v. 43, 1977, pp. 95-114. 42. Moser, T. J. Shortest Path Calculation of Seismic Rays. Geophysics, v. 56, 1991, pp. 59-67. 43. Saito, H. Traveltimes and Raypaths of First Arrival Seismic Waves: Computation Method Based on Huygens' Principle. Paper in Society of Exploration Geophysicists 59th Annual Meeting, Expanded Abstracts. SEG, 1989, pp. 244-247. 44. Schneider, W. A., Jr., K. A. Ranzinger, A. H. Balch, and C. Kruse. A Dynamic Programming Approach to First Arrival Traveltime
Computation in Media With Arbitrarily Distributed Velocities. Geophysics, v. 57, 1992, pp. 39-50. 45. Um, J., and C. Thurber. A Fast Algorithm for Two-Point Seismic Ray Tracing. Bull. Seismot. Soc. Am., v. 77, 1987, pp. 972-986. 46. Vidale, J. Finite-Difference Calculation of Traveltimes. Bull. Seismot. Soc. Am., v. 78, 1988, pp. 2062-2076. 47. Qin, F., Y. Luo, K. B. Olsen, W. Cai, and G. T. Sehuster. FiniteDifference Solution of the Eikonal Equation Along Expanding Wavefronts. Geophysics, v. 57, 1992, pp. 478-487. 48. Thill, R. E. Acoustic Cross-Borehole Apparatus for Determining In Situ Elastic Properties and Structural Integrity of Rock Masses. Paper in 19th Symposium on Rock Mechanics (Reno, NV). Univ. NY Press, 1978, pp. 121-129. 49. Jackson, D. D. The Use of a Priori Data To Resolve NonUniqueness in Linear Inversion. Geophys. J. R. Astron. Soc., v. 57, 1979, pp. 137-157. 50. Nolet, G. Solving or Resolving Inadequate and NoisyTomograph. ic Systems. J. Comput. Phys., v. 61, 1985, pp. 463-482. 51. Zadeh, L. A. Fuzzy Sets. Inf. and Control, v. 8, 1965, pp. 338-353. 52. Giarratano, J. C., and G. Riley. Expert Systems: Principles and Programming. PWS Kent, Boston, 1989, 485 pp. 53. Lo, T.-W. Fuzzy Logic Approach for Solving a Traveltime Tomography Problem. Papcr in Society of Exploration Geophysicists 61st Annual Meeting, Expanded Abstracts. SEG, 1991, pp. 732-736. 54. _ _. Fuzzy Logic Traveltime Tomography: Synthetic Data Test. Papcr in Society of Exploration Geophysicists 61st Annual Meeting, Expanded Abstracts. SEG, 1991, pp. 925-928. 55. Saito, H. Anisotropic Traveltime Tomography at the Buckhorn Test Facility in Illinois. Paper in Society of Exploration Geophysicists 61st Annual Meeting, Expanded Abstracts. SEG, 1991, pp. 123-126. 56. Friedel, M. J. BOMSPS: Bureau of Mines Signal Processing Software-Concepts, Expressions,. Tutorial. BuMines IC 9242, 1990, 40 pp.
29
APPENDIX A.-LIST OF FILES ON MIGRATOM DISTRIBUTION DISKETTE Directory of B:\TP
Directory of B:\ FILECONV MIGRATOM MTINST READTOMO SETUP TOMOPLOT TOMOPLOT TP 8 file(s)
EXE 96848 EXE 6288 DOC 6670 EXE 32088 ICO 766 EXE 207978 350638 bytes
12-29-92 05-27-93 01-19-93 09-12-91 11-19-91 02-05-93 08-01-92 05-27-93
12:41p 7:29a 3:59p 12:22p 6:48p 1:51p 5:59p 7:28a
05-27-93 05-27-93 02-07-92 05-28-92 04-01-93 03-02-93 02-05-93 05-27-93
7:29a 7:29a 1:13p 10:46a 8:21a 9:48a 1:48p 7:29a
Directory of B:\MIGRATOM
DEM01 DEM02 MIGRATOM MIGRATOM MIGRATOM SOURCE 8 file(s)
TT 5483 9829 TT EXE 176448 PIF 545 ICO 766 193071 bytes
05-27-93 05-27-93 11-12-92 12-29-92 01-20-93 05-14-93 05-29-92 12-30-91 03-26-93 01-20-93 01-22-93 01-20-93 04-01-93 01-19-93 02-22-93 01-20-93 01-22-93 01-20-93 01-20-93 12-30-91 12-18-92 10-09-91 09-15-92 09-15-92 09-15-92
3 file(s)
7:29a 7:29a 2:14p 12:41p 9:55a 4:00p 1:29p 2:03a 11:52a 10:33a 9:24a 10:20a 8:21a 3:55p 10:58a 10:18a 8:39a 9:56a 9:53a 2:03a 12:30p 9:05a 7:52a 7:52a 7:22a
05-27-93 05-27-93 05-27-93
7:28a 7:28a 7:28a
05-27-93 05-27-93 10-23-90 10-23-90 10-23-90 10-23-90 10-23-90 10-23-90 10-23-90 10-23-90 10-23-90 10-23-90 10-23-90
7:28a 7:28a 6:00a 6:00a 6:00a 6:00a 6:00a 6:00a 6:00a 6:00a 6:00a 6:00a 6:00a
Directory of B:\TP\BGI ATT BGI 6348 CGA BGI 6332 EGAVGA BGI 5554 GOTH CHR 18063 GRAPH TPU 32336 HERC BGI 6204 BGI IBM8514 6665 CHR UTT 5131 BGI 6012 PC3270 CHR 13596 SANS TRIP CHR 16677 13 file(s) 122918 bytes Total files listed: 57 file(s)
Directory of B:\MIGRATOM\SOURCE 23780 FCMENU PAS 19814 FILECONV PAS GETFILE PAS 4788 GETFILEW PAS 4788 GTC PAS 247 5005 PAS MISCS MTCAL2 PAS 58960 MTEND2 PAS 5718 PAS 16574 MTFIL2 MTGRF2 PAS 9444 37415 MTIN2 PAS 1377 MTINST PAS 4590 MTINSTF PAS 22173 MTMENU PAS MTOM2 8830 PAS MTPIX2 PAS 6691 MTVAR2 4332 PAS 30832 TPU TP030 3823 TRIGVEC PAS 2384 WIN TPU WIN2 2094 PAS WIN2 2784 TPU WINDOWS TPU 2848 25 file(s) 279291 bytes
BGI
o bytes
945918 bytes 495104 bytes free
, 'I
i;
:,1 !
:: 1
I
"Ii 'i
ii
30
APPENDIX B.-SUMMARY OF UTILITY PROGRAMS SUPPLIED ON MIGRATOM DISTRIBUTION DISKETTE TOMOPLOT TOMOPLOT produces contour plots of the final velocity model saved by MIGRATOM in "*.SUM" ftles. The contour plots are generated oJ,l a computer screen, and a bit-mapped copy can be sent to various types of printer. A brief user's manual for TOMOPLOT is included in the ftle READTOMO.DOC. FILECONV FILECONV is a ftle-conversion utility for users of BOMTOM and BOMCRATR. FILECONV translates data ftles from either BOMTOM or BOMCRATR format into the form required by MIGRATOM, and vice versa. To run FILECONV, type "FILECONV" at the system prompt. An introductory screen will be displayed, after which the· user will be asked to specify the respective formats of the source and destination ftles. Then
FILECONV will display a main menu screen, whose appearance depends on the ftle formats that have been specified. When converting ftles from BOMTOM or BOMCRATR format for use by MIGRATOM, two separate ftles may be created: one for travel-time data, and an optional one for the starting model. Names for these ftles are specified through the output ftle menu. BOMTOM . and BOMCRATR ftles contain values for various options such as the number of iterations to perform, convergence criteria, etc. These values are not saved in the MIGRATOM ftle(s) , and must be set through MIGRATOM's interactive menus at run time. Conversion of MIGRATOM ftles to BOMTOM or BOMCRATR ftles involves the reverse situation: The destination ftles require information not contained in the source ftle(s). Default values for run-time options are displayed by FILECONV, and they may be altered interactively before the destination ftle is written.
31
APPENDIX C.-DETAILS OF WAVEFRONT CALCULATIONS INITIATION AND PROPAGATION
As shown in figure C-1, the wavefront is initially defined by 60 points at 60 angular intervals, and at a radial distance from the source equal to v(S)t.t, where v(S) is the velocity at the source location and t.t is the length of a time step. The takeoff angle tP is defined such that tP equals zero for a ray traveling downward (in the positive z direction). At each point on the wavefront, a circular wavelet is constructed. For the kth point, the radius rk of the wavelet is v(Xk" zJt.t, where v(Xk" 7J is the velocity at the point. A line tangent to circles k and k - 1 intersects circle k at the point (Xk,' , ~') (fig. C-2). The coordinates of the intersection point are calculated as follows. The distance d separating points k and k - 1 is equal to
.---------------~x
Source
kt2
Figure C-1.-Inltlal takeoff angles. Initial wavefront consists of 60 points at 6· Intervals, at a distance from source equal to time step duration times velocity at source.
The orientation angle fJ of segment d, measured clockwise from the -z axis, is given by
fJ
= tan-l
[Xk -Xk-l], zk - zk-l
and the angle 0: between d and rk.1 is
where M = rk.1 - rk • Defining "I as 1800 intersection point can be calculated as
-
(0: + fJ), the
Repeating the process for circles k and k + 1 produces another intersection point on circle k, generally different from the first intersection point. The travel angle "I' for the ray from point k is determined by bisection of the angle between the two intersection points (fig. C-3). Together with rk , "I' provides an estimate of the location of point k for the subsequent time step:
Figure C-2.-Forward time step, two adjacent points. Locus of constructive Interference Is approximated by a line tangent to adjacent Huygens wavelets.
32
I:
ray k
ray k - 1
,I'' :
!
A , i
t+L\ t
k-1 t
I:'I ,
Figure C-4.-Box constructed for arrival test.
I i
I
, I
!
i
II!
Figure C-3.-Forward time step, three neighboring points. For each wavelet there are tangent points associated with two neighboring wavelets. The ray-path orientation at point k bisects these two tangent points.
A better estimate is obtained by refining rk , using an approximate average velocity along the path between time t and t + ilt:
tip-to-tail around the box. For each receiver R i , a second set of difference vectors a, b, c, d is calculated by subtracting the coordinates of the box corners from those of the receiver. Finally, the cross-products A X a, B x b, C x c, and D x d are calculated. If the y components (orthogonal to the plane of figure C-4) of all four crossproducts are negative, the receiver location must be within the box. Thus the wavefront segment defined by points k and k - 1 sweeps across receiver Ri between time t and t + ilt, and an arrival is recorded. Once an arrival is recognized in this way, its takeoff angle and arrival time must be calculated. MIGRATOM calculates both values by linear interpolation:
ta and substituting rk ' for rk in the previous equation.
ARRIVALS
!
"
I
I
'
!'
When the new location of a wavefront point has been calculated, it is necessary to determine whether the wavefront segment has crossed any receiver locations. MIGRATOM checks for arrivals in the following way. First, it calculates difference vectors corresponding to the four sides of a box defined by the locations of wavefront points k and k - 1 aUimes t (the current time step) and t + ilt (the succeeding time step) (fig. C-4). The difference vectors A, B, C, and D define a counterclockwise circuit,
¢>a
= t =
+ (aeA/IAI2)
L\t
¢>k-l + (a'D/IDI2) (¢>k - ¢>k-l)'
Testing for arrivals is clearly very expensive in terms of processing time. For each of the wavefront points (60 initially, with more added as the wavefront progresses), MIGRATOM must calculate eight difference vectors and four cross-products for each receiver. In order to reduce the processing load, MIGRATOM postpones arrival tests, using measured travel times as guides. A receiver is only tested for possible arrivals if the current time t is at least half the measured travel time for that receiver. Note that this may cause arrivals to be missed if the measured times are erroneously long or if the velocity model is erroneously fast.
33
ADDING AND DELETING WAVEFRONT POINTS
The separation d between each pair of adjacent wavefront points is compared with the diagonal length of a pixel. If d exceeds this length divided by the specified wavefront density D, a new point is inserted. Both the location and the estimated takeoff angle of the new point are linearly interpolated between the values for neighboring points. Wavefront points are eliminated under two circumstances: (1) if they propagate beyond the imaging area;
and (2) if they become secondary arrivals. As described in the main body of this report, the latter condition occurs when a caustic develops as the wavefront wraps around a low-velocity region. In order to detect this situation, MIGRATOM uses the same approach that it uses for detecting arrivals. Boxes are constructed between adjacent wavefront points at successive time steps, and neighboring wavefront points are tested to determine whether they are located within the box. If so, they are "behind" the wavefront, and will not be first arrivals. Thus they are discarded.
-' 34
APPENDIX D.-FORMAT OF OUTPUT FILES GENERATED BY MIGRATOM This appendix lists the Pascal source code lines that control the format of the output files. For users unfamiliar with Pascal, the following example should help in understanding how the formatting instructions operate. The Pascal statement writeln('index: ',i:6, 'values: ',x:1O:4, y:l0:4, z:10:4); is equivalent to the FORTRAN lines WRITE(6,100) I,X,Y,Z 100 FORMAT(,index: ',I6,'values: ',3FI0A) and to the C statement printf("index: %6d %10Af\n",i,x,y,z);
values:
%10.4f
%10.4f
Procedure SumFile; var i, j, k, 11, 12, 13: integer; begin writeln(SumF,' I I MIGRATOM ',dm,' I',dd,' I',dy); writeln(SumF,' I I start:',startH,':', startM:2,':',startS:2); writeln(SumF,' I I finish: ',th,':',tm:2,':',ts:2); writeln(SumF,' II'); writeln(SumF,'1I Input Files:'); writeln(SumF,' I I travel times: ',TtInFname); writeln(SumF,'1 I velocity model: ',VMInFname); writeln(SumF,' I I Output Files:'); writeln(SumF,'1 I velocity model: ',VMOutFname); writeln(SumF,'1 I travel times: ',TtOutFname); writeln(SumF,' I I residuals: ',ResFname); writeln(SumF,' II'); writeln(SumF,' I I Options: '); writeln(SumF,' I I # straight-ray iterations: ',ItStraight); writeln(SumF,' I I total # iterations: ',ItMax); writeln(SumF,'1 I time step: ',dt:6:2); writeln(SumF,' I I anisotropy: ',anisotropy:5:3); writeln(SumF,' I I wavefront point density: ' ,WavePtDensity:5:2); writeln(SumF,'1 I constructive interference parameter: ',InterferencePar:3); if (VMlnFname = ") then writeln(SumF,' I I starting model: ' ,StartMStr[StartingModel]); writeln(SumF,'1 I'); writeln(SumF,' I I Global Constraints: '); writeln(SumF,' I I Vmin: ',VminCon:6:2); writeln(SumF,' I I Vmax: ',VmaxCon:6:2); writeln(SumF,' I I'); ,
writeln(SumF,'@'); writeln(SumF,xO:8:2,' ',xl:8:2); writeln(SumF,(-PosZmax):8:2,' ',(-PosZmin):8:2); writeln(SumF); writeln(SumF,'Distance'); writeln(SumF,'Depth'); writeln(SumF,' 0 0'); writeln(SumF,(NPixV + 1),' ',(NPixH + 1»; k:=0; for i: = 1 to NPixV + 1 do begin for j: = 1 to NPixH + 1 do begin k:=k+l; write(SumF, Node".V[k]:6:2); end; writeln(SumF); end; writeln(SumF); writeln(SumF,' Node Constraint Matrix: '); writeln(SumF); k:=0; for i: = 1 to NPixV + 1 do begin for j: =1 to NPixH + 1 do begin k:=k+l; write(SumF, Node".CC[k]:6:2); end; writeln(SumF); end; writeln(SumF); writeln(SumF,'Pixel Sampling Density'); 11:=0; with Pixel" do begin for 12: = 1 to NPixV do begin for. 13: = 1 to NPixH do begin 11: =11 + 1; write(SumF,NRaysThru[11]:5); end; writeln(SumF); end; end; writeln(SumF); writeln(SumF); writeln(SumF,'Pixel Center X Coordinates'); 11:=0; with Pixel" do begin for 12: = 1 to NPixV do begin for 13: = 1 to NPixH do begin 11:=11 +1; write(SumF,PosPX[I1]:8:3); end; writeln(SumF); end;
--r1
II 35 end; writeln(SumF); writeln(SumF); writeln(SumF,'Pixel Center Y Coordinates'); 11:=0; with Pixel" do begin for 12: = 1 to NPixV do begin for 13: = 1 to NPixH do begin 11:=11+1; write(SumF,PosPY[I1]:8:3); end; writeln(SumF); end; end; writeln(SumF); writeln(SumF); writeln(SumF,'Pixel Center Z Coordinates'); 11:=0; with Pixel" do begin for 12: = 1 to NPixV do begin for 13: = 1 to NPixH do begin 11:=11+1; write(SumF,PosPZ[11]:8:3); end; writeln(SumF); end; end; writeln(SumF); writeln(SumF,'Transmitter Coordinates'); for 11: = 1 to NPsT do writeln(SumF,I1:4, PosTX[I1]:8:3, PosTY[I1]:8:3, PosTZ[I1):8:3); writeln(SumF) ; writeln(SumF,'Receiver Coordinates'); for 11: = 1 to NPsR do writeln(SumF,I1:4, PosRX[11):8:3, PosRY[I1):8:3, PosRZ[I1):8:3); writeln(SumF); end; Close(SumF); End;
Procedure SaveModel; var i,j,k,l,m,n,NodeNum, IOcode: integer; Begin if VMOutFfmt = 1 then begin {text format} Writeln(VMOutF, (NPixH+l), , ',(NPixV+l»; m:=O; for j: = 1 to NPixV do begin for k: = 1 to NPixH do begin m:=m+l; 1: = ULN(m); {upper left node} write(VMOutF, Node".V[I):8:3); end; {k} writeln(VMOutF, Node".V[URN(m»):8:3);
end; {j} m: = m-NPixH; for k: = 1 to NPixH do begin m:=m+l; 1:=LLN(m); write(VMOutF, Node".V[I]:8:3); end; {k} writeln(VMOutF, Node".V[LRN(m»):8:3); end; {i} Close(VMOutF); {HPGL format} end else begin Assign(VMoutF, Fname); Rewrite(VMOutF); HPinit(VMOutF); end; End;
Procedure SaveTtimes; var i,j,k,m: integer; r, ray v, rsd, rsdnorm: single; Be~n Assign(TtOutF, TtOutFname); Rewrite(TtOutF); if TtInFname < >" then Writeln(TtOutF, 'Measured travel time data from file: " TtInFname) else Writeln(TtOutF, 'Synthetic travel time data '); Write(TtOutF,' # -----Source X, Y, Z------ '); Writeln(TtOutF, '----Receiver X, Y, Z------ calc ttime obs ttime d/obs t resid norm resid'); ray:=rayO; for m: = 1 to Nttimes do begin with ray" do begin write(TtOutF,m:l0,' '); for j: = 1 to 3 do write(TtOutF,PosTU):8:3,' '); for j: = 1 to 3 do write(TtOutF,PosRU):8:3,' '); if (ttobs>O) then begin rsdnorm: = rsd/ttobs; ray v: = r /ttobs; end else begin rsdnorm:=O; ray v:=O; end', writeln(TtOutF, ttcalc:12:4, ttobs:12:4, (ray_v): 12:4, rsd:12:4, rsdnorm:12:4); end; ray: = Ray".next; end; Close(TtOutF); End;
i
i. !
I
~
,! INT.BU.OF MINES,PGH.,PA 29894