Research article
Mobile scanning system for the fast digitization of existing roadways and structures Brad Grinstead, Sreenivas Sukumar, David Page and Andreas Koschan Imaging, Robotics, and Intelligent Systems Laboratory, Department of Electrical and Computer Engineering, The University of Tennessee, Knoxville, Tennessee, USA
David Gorsich US Army RDECOM Tank-Automotive Research, Development and Engineering Center, Warren, Michigan, USA, and
Mongi A. Abidi Imaging, Robotics and Intelligent Systems Laboratory, Department of Electrical and Computer Engineering, The University of Tennessee, Knoxville, Tennessee, USA Abstract Purpose – To present a Mobile Scanning System for digitizing three-dimensional (3D) models of real-world terrain. Design/methodology/approach – A combination of sensors (video, laser range, positioning, orientation) is placed on a mobile platform, which moves past the scene to be digitized. Data fusion from the sensors is performed to construct an accurate 3D model of the target environment. Findings – The developed system can acquire accurate models of real-world environments in real time, at resolutions suitable for a variety of tasks. Originality/value – Treating the individual subsystems of the mobile scanning system independently yields a robust system that can be easily reconfigured on the fly for a variety of scanning scenarios. Keywords Image scanners, Digital storage, Topography, Modelling Paper type Research paper
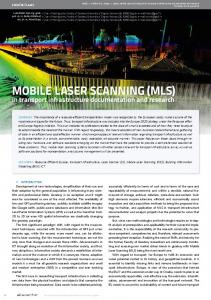
As an example, pavement inspection – investigating roadways for imperfections such as potholes, cracks, etc. – can be an important, yet time consuming task. Manual pavement inspection typically involves someone either walking over the areas to be inspected, or riding on a slowmoving vehicle, taking measurements and/or photographs of the deterioration of the road surface for later evaluation. Some agencies have taken the technological approach, by using triangulation-based laser scanners mounted on vehicle bumpers to create 3D models of the road surface on the fly (Figure 1) that can be evaluated using mathematical tools, thus removing the majority of the manual effort involved in road surface inspection. In essence, a mobile scanning system consists of four main components: hardware for 3D geometry acquisition; hardware for positioning and orientation (pose) measurement; a mobile platform which moves the sensing package past the environment to be digitized; and software to perform the data fusion necessary to combine the data from all the sensing modalities and to process the resulting model to fit the application at hand. While other researchers (see next section) have developed 3D terrain acquisition systems, these tend to be fixed in regards to the hardware and the
Introduction Accurate three-dimensional (3D) models of existing roadways and structures can provide immense benefit to a variety of applications involving simulation and sensor planning: quality assessment of roadways can be done more accurately through 3D models of the actual surfaces; an accurate 3D model of an intersection, can make the process of sensor placement for traffic monitoring applications more efficient. Other applications can also benefit greatly from the availability of accurate 3D models of real-world environments: driving simulators can use models of existing intersections to evaluate traffic flow and safety; tire-soil interactions can be measured and the models used to improve transportation vehicles of all types;, etc. In the past, these models were created by graphics artists from a library of pre-constructed primitives, or from a rough measurement skeleton. Today however, the technology has advanced to the point where we can directly acquire 3D models from real world environments. In effect, we can now “digitize reality”. The current issue and full text archive of this journal is available at www.emeraldinsight.com/0260-2288.htm
Sensor Review 26/4 (2006) 283– 289 q Emerald Group Publishing Limited [ISSN 0260-2288] [DOI 10.1108/02602280610691999]
This work was supported by the DOE University research program in robotics under Grant DOE-DEFG02-86NE37968 and the DOD/ RDECOM/NAC/ARC Program under Grant W56HZV-04-2-0001.
283
Mobile scanning system
Sensor Review
Brad Grinstead et al.
Volume 26 · Number 4 · 2006 · 283 –289
Figure 1 INO laser rut measurement system (INO, 2005)
These research efforts generally fall into one of two categories: image-based methods, where the 3D geometry is inferred from 2D images; and laser range-based approaches, where the 3D geometry is measured directly through laser range scanners. Table I summarizes a few of the current systems that are used to develop large-scale 3D terrain models. Image-based methods infer the 3D geometry from a video stream using stereo imaging principle, and have the advantage of being real-time in acquisition and yielding nicely textured models, at the cost of lower sampling resolution on the surface structures. Laser-based methods measure the target geometry directly through physical principles, and have the advantage of more accurate and dense surface sampling, at the cost of higher processing requirements in the form of data fusion. One of the main disadvantages of the existing mobile laser range systems is that they assume that the target environment will have regular (manmade) constructs and that the vehicle path will be suitably smooth and semi-planar. Our mobile scanning system was developed to utilize the strengths of these systems, and overcome their limitations by utilizing a more sophisticated, instrumented system for pose estimation. This makes our system more robust to environmental conditions and allows us to digitize a wider variety of environments. In addition, the system is designed to be a modular package so that the hardware can be changed to meet the specific needs of the application at hand, while the data processing procedures remain the same.
fusion methods used. In contrast, our mobile scanning system treats the four sub-systems independently, giving us a system that is designed for: 1 Modularity. Each component in the system can be replaced by another that performs a similar function. 2 Configurability. Each component of the system has a configuration file and the processing software is designed to pick up system specifics from that file, rather than having to be recoded for each piece. 3 Static processing. The functionality of the data fusion and post-processing for the various data is independent of the sensors and vehicle used, enhancing the configurability of the system. 4 Robustness. The modularity inherent in our design allows the system to be as robust to real world environments as the individual components.
Mobile scanning system Digitizing large-scale environments is a task that has inherent constraints, depending on the target application, the environment, the structures to be digitized, the size and expense of the equipment to be used, the time available for data acquisition, the purpose for which the models are to be used, etc. Some of these constraints are constant, and some depend on the application – e.g. what resolution is necessary for the model. Perhaps one of the main constraints is the time on site necessary to do the data acquisition. We use high-resolution sensors mounted on a mobile platform to acquire mm- to cm-level resolution models. This allows us to quickly digitize the target scene in a variety of environments, under a variety of conditions and varying lighting. As the vehicle moves past the scene to be digitized, the system acquires 3D geometry profiles of the terrain around it while the pose estimation system acquires information about the motion of the platform. Let [X, Y, Z ] be the global coordinate reference for the digitized scene, let [x, y, z ] be the laser scanner’s internal coordinate system, and let the orientation parameters for the scanner be (roll pitch yaw). Each point p in the current profile has a 3D identity of vp ðx; y; zÞ, as seen from the scanner, and the scanner has a 3D identity of lðX; Y ; Z; Þ in the global reference. Thus, the location of p in the world reference can be found as:
A general system pipeline for our mobile scanning system can be seen in Figure 2, with an example setup of the sensor suite showing the positioning and orientation devices, 3D geometry scanner, and video for texture overlays and pose estimation. For our mobile scanning system, we use a combination of commercial scanners, localization instrumentation, and video processing. What makes our system different from previous approaches is the way we treat the hardware components as interchangeable – using a set of configuration files to allow instrumentation to be swapped in and out during the acquisition process – and keep the post processing of the data fixed, which makes our system more robust to environmental conditions and allows us to digitize a wider variety of environments. The rest of the paper is laid out as follows: The next section discusses previous efforts in the digitization of 3D environments, including a relative comparison of techniques; followed by the design of our mobile scanning system, and goes into brief detail about the processes used for data fusion and processing; experimental results from our system in digitizing real world environments can be seen in the following section; and final section wraps up with an overview and a discussion of future enhancements to the system.
V p ¼ l þ R · vp
Previous methods
where R is the rotation matrix generated from the roll, pitch, and yaw values determined from the pose sensing instrumentation.
In the last few years there have been several groups studying how to best acquire 3D models of real world environments. 284
Mobile scanning system
Sensor Review
Brad Grinstead et al.
Volume 26 · Number 4 · 2006 · 283 –289
Figure 2 General flowchart for the mobile scanning system
Table I Summary of current work on 3D environment modeling System
Modality
Capabilities
Airborne video systems (Baillard and Maıˆtre, 1999; Frere et al., 1998)
Image-based
Shape from motion (Pollefeys et al., 2000; Zisserman et al., 1999)
Image-based
MIT city scanning project (Antone and Teller, 2000)
Image-based
Radial laser scanning (El-Hakim et al., 1997; Sequeira et al., 1999)
Laser range-based
Mobile laser scanning (Fru¨h and Zakhor, 2001; Zhao and Shibasaki, 2001)
Laser range-based
Our mobile scanning system
Laser range-based
meter-level accuracy; can acquire large swaths of terrain data in a short time, but generates coarse models; data acquired in real time and processed offline cm- to meter-level accuracy; general motion with a few degenerate cases; 3D structure inferred from stereo principles; demonstrated on small scale; acquires in real-time and processes offline meter-level accuracy amongst models; structure inferred from spherical nodules; time consuming to setup and acquire data cm-level accuracy; involves acquiring a large number of groundbased range scans, registering them into a common frame, and merging them together; time consuming in both acquisition and processing cm-level accuracy; use orthogonal range scanners for pose estimation, limiting them to semi-planar urban environments; orthogonal scan-line matching makes data fusion fast and accurate; data acquired in real time and processed offline mm- to cm-level accuracy; uses instrumentation for pose estimation, allowing the system to be used in a variety of environments; makes no assumptions about the environment to be digitized; data acquired in real time and processed offline
measurement unit (IMU) to provide orientation and acceleration information for the platform. For positioning, we have integrated a highly accurate differential real-time kinematic (D-RTK) GPS receiver, which is accurate up to 2 cm. To augment the instrumented self-localization process, we have also implemented a pose from video (PfV) algorithm
Self-localization Self-localization, pose estimation, is a critical part of the mobile scanning system as the accuracy of the 3D model is directly related to the accuracy of the estimation of the position and orientation at the time of each acquisition. For the example configuration shown in this paper, we have utilized an inertial 285
Mobile scanning system
Sensor Review
Brad Grinstead et al.
Volume 26 · Number 4 · 2006 · 283 –289
that utilizes the high-resolution images acquired by our sensing module. GPS data gives us the ability to georeference the data acquired by the mobile scanning system, giving an absolute frame of reference, allowing us to incorporate all the localization information available from the other measurement systems into a common, fixed reference. The fusion of the localization data thus involves mainly the computation of the fixed rotations and translations if the various sensors with respect to the global reference, the GPS (Grewal et al., 2001). Let us denote the position of the platform at a given time as p(t) ¼ [x y z ], and its orientation as r(t) ¼ [w c v ]. Since the acquisition rates are different for the various sensors and we only have discrete time sampled data, interpolation is needed to obtain a continuous path trajectory. For a full 3D motion estimate Pk ¼ [x y z w c v ] at time k in the interval [ti, ti þ 1], the displacements and rotations are defined as:
Data fusion and model processing For our target application range, the mobile scanning system acquires data in realtime, but processes the data offline. This allows us to meet our parallel goals of minimal time on site and maximal model quality. A typical terrain model can consist of over 200,000 geometry profiles, 1,000,000 position and orientation measurements, and 20,000 high-resolution color images. A rough estimate of the storage capacity required for the raw data alone exceeds 10 Gb. Thus, we need to combine the data together in a meaningful fashion, while reducing the amount of memory required to deliver the model’s information to the target application. This procedure consists of the following stages: 1 fusion of the raw data into a single model; and 2 geometry processing to remove the effects of noise, fill holes and remove duplicate data, and provide and adaptive simplification of the model.
ðk 2 t i Þ Dhk ¼ ðt iþ1 2 t i Þ
P k ¼ A þ BDhk þ
CDh2k
þ
DDh3k ;
Data fusion is carried out in two main stages: combining the localization information to provide position and orientation of the sensor package at each scanning step, and using that pose information to relate the individual laser range profiles and digital images. The localization and scanning instruments are synchronized by a common timing signal. Then, for range profiles we find the corresponding localization information by combining interpolated values for the position and orientation. As mentioned previously, we use the localization information provided by the video system to provide position and orientation information when the instrumented systems’ quality falls below a given level. Once the data fusion of the localization information has been done, the alignment of the individual laser range profiles and color images is a straightforward process. Pose estimates local to the individual range scans are interpolated to find the best estimate of the position and orientation of the scanner at the time of acquisition. A rigid transformation is then applied to the coordinate system of the scanner to bring the data into the world reference frame, as defined by the pose instrumentation. As with any system that measures real data, our mobile scanning system has a noise component associated with it, derived from the inherent inaccuracies of the laser range scanners as well as the uncertainty associated with each pose estimate. The filter that we use to remove the noise is based on the assumption that the system noise is an additive Gaussian noise and the characteristics are based on those of the scanner, experimentally determined within our lab. In addition, while the vehicle is stopped or undergoing turns the scene geometry may be sampled more than once, yielding redundant data. These data are identified through motion analysis and removed. Occasionally, the model created may be used by more than one application, with each task requiring a different level of resolution and accuracy. In order to have the generality of a system that can acquire high-resolution geometry information and provide low-resolution models as needed, we have developed a multi-resolution processing scheme (Roy et al., 2003) that defines the operations needed to display/store/ process the generated 3D model in various levels-of-detail. Figure 3 shows this process on a building model at the original resolution, and at 25 and 2.5 percent of the original resolution. Notice that the geometry is increasingly simplified, and storage/computations reduced, but the overall appearance of the model remains the same.
ð2Þ
where A, B, C, and D and the third order polynomial coefficients given by the tridiagonal system, as per Bartels et al. (1998). The orientation parameters for the system are measured by the IMU through a series of gyroscopes and linear accelerometers. The measurements can provide the velocity of the system, as well as the orientation. In a pinch, the IMU information can be used to estimate the position of the system as well, through double integration of the accelerations. Unfortunately, the errors that accrue at each sampling point eventually degrade the estimate beyond the acceptable bounds of accuracy, unless a fixed keystone measurement (such as accurate GPS) is used to anchor the system. In our system, the GPS is the only device that provides these absolute points of measurement, which sets the bounds on the accuracy of the pose estimation subsystem. Under non-ideal conditions, the degradation of the GPS signal increases the uncertainty in the self-localization process. In this case, we can monitor the uncertainty of the hardwarebased pose estimation system, and when it falls below a specified threshold, we can switch over to a video-based method. The video-based method determines the vehicle’s motion from a sequence of video images by finding corresponding features between the images and using the scene’s epipolar geometry to compute pose between views (Branca et al., 2000; Chroust and Vincze, 2004; Rivlin et al., 2003; Usher et al., 2003). First, distinctive features in an image pair are identified using a Harris corner detector (Harris and Stephens, 1988). Next, features in the first image are matched to corresponding features in the second image, using intensity correlation followed by our in-house method for false match removal. Given a good set of correspondences, the motion state of the camera can be calculated, up to scale, using a two stage motion estimation algorithm similar to those described by Johnson et al. (2000) and Hartley and Zisserman (2000). We can then use the onboard laser range finder of our system to get an absolute distance to a known point in the scene, providing the scale, and giving us the full 6 degree of freedom (DoF) motion estimate. 286
Mobile scanning system
Sensor Review
Brad Grinstead et al.
Volume 26 · Number 4 · 2006 · 283 –289
Figure 3 A multi-resolution representation of a building model with the textured model shown above the wire frame and point cloud representations
Experimental results
required to acquire the data, which encompassed over 1.5 km of scanning. The textured 3D model shown in Figure 6 is a small subset of the entire dataset, which is shown in reduced point cloud form. In addition to the structure scanning system, we are also currently working with a scanning platform designed to acquire the terrain (ground) the system is moving over. This system uses a downwards looking laser range scanner to digitize the terrain. The process for data fusion and model processing is the same as the previous system due to the modularity that went into the system design process.
We have used our mobile scanning system to acquire 3D models for a number of different environments, in a variety of configurations. For this paper we will discuss two different configurations of the mobile scanning system. The first will be the system we use to develop models of building and other above-ground-level structures. These models are suitable for populating driving simulators, aiding robotic path planning and manipulation tasks, etc. The second configuration is a working example of how the mobile scanning system can acquire detailed models of the terrain over which it moves – i.e. 3D models of the ground itself. Figure 4 shows the instrumentation for both systems, with the downward-looking laser range scanner for the road scanning setup, as well as the long-range side-scanning laser for the building fac¸ade generation (inset). The mobile scanning system is easily reconfigurable, with a substitution of instrumentation possible with a change in configuration files. For the structure scanning configuration, we have used a mobile platform – in this case a van – with the sensor package mounted on the roof for maximum field of view and minimal pedestrian impact. The sensor package consists of: a Leica GS500 D-RTK GPS system, an XSens MT9 IMU, a JVC GR-HD1 high definition, and a Riegl LMS-Z210 laser range scanner (Table II for sensor details). Figure 5 shows the digitization of a small, but complex scene. In this case, the mobile scanning system was driven around a shopping strip, acquiring the 3D geometry from all four sides of the building, to generate a more complete model. This model consists of 500,000 triangles and was acquired in 5 min. Figure 6 is a large-scale structure model of the Downtown West Shopping Mall in Knoxville, TN. The mobile scanning system was driven around the entire mall, acquiring the geometry and color information to combine into a detailed 3D model. The dataset is rather large, consisting of over 5,000,000 data points, 5,000 color images, and 48,000 pose measurements. However, only 18 min of scanning time was
Figure 4 Experimental setup for both the building fac¸ade scanning system and the roadway inspection and modeling system
287
Mobile scanning system
Sensor Review
Brad Grinstead et al.
Volume 26 · Number 4 · 2006 · 283 –289
Table II Experiment instrumentation and specifications Component name
Data type
Accuracy
Acquisition rate
Leica GS500 D-RTK GPS XSens MT9 IMU JVC GR-HD1 Hi-def camcorder Riegl LMS-Z210 IVP ranger SICK LMS200
Position Orientation/accelerations Video navigation/texture Laser range Laser range Laser range
Up to 2 cm ,1
10 samples/s 100 samples/s 1280 £ 720 @ 30 frames/s 10,000 points/s (20 profiles/s) 50, 000 points/s 12, 600 points/s (35 profiles/s)
5 cm @ up to 350 m 5 mm @ up to 0.5 m 1 cm @ up to 8 m
There are two versions of the downward looking system that we are currently using. One is a micro-scale system that is capable of measuring the geometry very densely (approximately 1 mm between data points) with an accuracy on the order of 5 mm, at the cost of having a very limited fieldof-view and a high amount of raw data to process. The other system uses a laser range scanner designed to scan larger objects, similar to the Riegl scanner used in the previous discussion. The micro-scale system utilizes an IVP Ranger to acquire high-resolution, high-accuracy 3D models of roads and other surfaces. This level of resolution is useful for tasks such as pavement inspection. The macro-scale terrain scanning system uses a SICK LMS200 system to acquire terrain models on a larger scale. This scanner provides terrain models appropriate for terrain-tire interaction, vehicle dynamics simulation, etc. See Table II for further specifications on these sensors. Figure 7 shows an example of the mobile scanning system with the LMS200 laser range scanner providing the 3D terrain geometry. The 1.2 km path scanned is on a gravel road and parking lot, with a number of cars, ditches, and railroad tracks to provide obstructions and details on the ground. Figure 7(a) shows an aerial view of the region that was digitized, with the scanning platform’s path superimposed. Figure 7(b) shows the digitized surface, with a zoomed in view of the raw data in point cloud form shown in Figure 7(c), displaying the geometry of the road as well as the ditches, cars, and other objects of interest in the terrain model. The model contains over 3,000,000 data points, and took approximately 6 min to acquire.
Figure 5 Point cloud and textured view of a shopping strip model
Figure 6 3D model of the downtown west shopping mall shown in point cloud form. A textured triangulated surface of a small subset of the data is also shown
Conclusions In this paper we have presented a mobile scanning system for the fast digitization of 3D terrain models that is modular in nature. The system consists of laser range scanners, highresolution digital cameras, and pose estimation instrumentation, and a mobile platform. This system can digitize kilometers’ worth of data in a short amount of time, and the modularity of the equipment allows it to be easily configured to meet a wide variety of applications. The results presented show the ability of our system to handle a variety of applications and environments, yielding accurate 3D models in a robust fashion. Switching out the laser range scanners allows the system to quickly switch between macro structure scanning (buildings) and micro geometry scanning (inspection tasks). Future efforts for extending the capabilities of the mobile scanning system include: improving the pose estimation 288
Mobile scanning system
Sensor Review
Brad Grinstead et al.
Volume 26 · Number 4 · 2006 · 283 –289
Figure 7 Large-scale terrain digitization of a “double-U” loop on a gravel road and parking lot
Hartley, R. and Zisserman, A. (2000), Multiple View Geometry in Computer Vision, Cambridge University Press, Cambridge. INO (2000), “INO-LRMS: laser rut measurement system”, available at: www.ino.ca/En/Notre_offre/Vision_industrielle/ realisations/LRMS.aspx (accessed February 10, 2005) Johnson, A.E., Yang, C. and Matthies, L.H. (2000), “Machine vision for autonomous small body navigation”, Proceedings of the IEEE Aerospace Conference,Vol. 7, pp. 661-71. Pollefeys, M., Koch, R., Vergauwen, M. and Gool, L.V. (2000), “Automated reconstruction of 3D scenes from sequences of images”, ISPRS Journal of Photogrammetry & Remote Sensing, Vol. 55 No. 4, pp. 251-67. Rivlin, E., Shimshoni, I. and Smolyar, E. (2003), “Imagebased robot navigation in unknown indoor environments”, Proceedings of the International Conference on Intelligent Robots and Systems,Vol. 3, pp. 2736-42. Roy, M., Foufou, S., Koschan, A., Truchutet, F. and Abidi, M. (2003), “Multiresolution analysis for irregular meshes”, Proceedings of the SPIE: Photonics East,Vol. 5266, pp. 249-59. Sequeira, V., Ng, K., Wolfart, E., Goncalves, J.G.M. and Hogg, D. (1999), “Automated reconstruction of 3D models from real environments”, ISPRS Journal of Photogrammetry and Remote Sensing, Vol. 54 No. 1, pp. 1-22. Usher, K., Ridley, P. and Corke, P. (2003), “Visual servoing of a car-like vehicle – an application of omnidirectional vision”, Proceedings of the International Conference on Robotics and Automation, pp. 4288-93. Zhao, H. and Shibasaki, R. (2001), “Reconstructing urban 3D model using vehicle-borne laser range scanners”, Proceedings of the International Conference on 3D Digital Imaging and Modeling, pp. 349-56. Zisserman, A., Fitzgibbon, A.W. and Cross, G. (1999), “VHS to VRML: 3D graphical models from video sequences”, Proceedings of the International Conference on Multimedia and Systems, pp. 51-7.
algorithms, adaptive regularization of the surface for noise removal, software enhancement of small-scale details, and improving the automation and robustness.
References Antone, M.E. and Teller, S. (2000), “Automatic recovery of relative camera positions in urban scenes”, Computer Vision and Pattern Recognition, Vol. 2, pp. 282-9. Baillard, C. and Maıˆtre, H. (1999), “3-D reconstruction of urban scenes from aerial stereo imagery: a focusing strategy”, Computer Vision and Image Understanding, Vol. 76 No. 3, pp. 244-58. Bartels, R.H., Beatty, J.C. and Barsky, B.A. (1998), “Hermite and cubic spline interpolation”, An Introduction to Splines for Use in Computer Graphics and Geometric Modelling, Morgan Kaufmann, San Francisco, CA. Branca, A., Stella, E. and Distante, A. (2000), “Passive navigation using egomotion estimates”, Image and Vision Computing, Vol. 18, pp. 833-41. Chroust, S.G. and Vincze, M. (2004), “Fusion of vision and inertial data for motion and structure estimation”, Journal of Robotic Systems, Vol. 21 No. 2, pp. 73-83. El-Hakim, S.F., Boulanger, P., Blais, F., Beraldin, J.A. and Roth, G. (1997), “A mobile system for indoors 3-D mapping and positioning”, Proceedings of the Optical 3-D Measurement Techniques, pp. 275-82. Frere, D., Vandekerckhove, J., Moons, T. and VanGool, L. (1998), “Automatic modeling and 3D reconstruction of urban buildings from aerial imagery”, Proceedings of the IEEE International Geoscience and Remote Sensing Symposium, pp. 2593-6. Fru¨h, C. and Zakhor, A. (2001), “3D model generation for cities using aerial photographs and ground level laser scans”, Computer Vision and Pattern Recognition, Vol. 2, pp. 31-8. Grewal, M.S., Weill, L.R. and Andrews, A.P. (2001), Global Positioning Systems, Inertial Navigation, and Integration, Wiley, New York, NY. Harris, C. and Stephens, M. (1988), “A combined corner and edge detector”, Proceedings of the Alvey Vision Conference, pp. 147-51.
Corresponding author Brad Grinstead can be contacted at:
[email protected]
To purchase reprints of this article please e-mail:
[email protected] Or visit our web site for further details: www.emeraldinsight.com/reprints
289